Zip Codes with the Highest Percentage of Population Employed in Accommodation & Food Services in Des Plaines, IL
RELATED REPORTS & OPTIONS
Accommodation & Food Services
Des Plaines
Compare Zip Codes
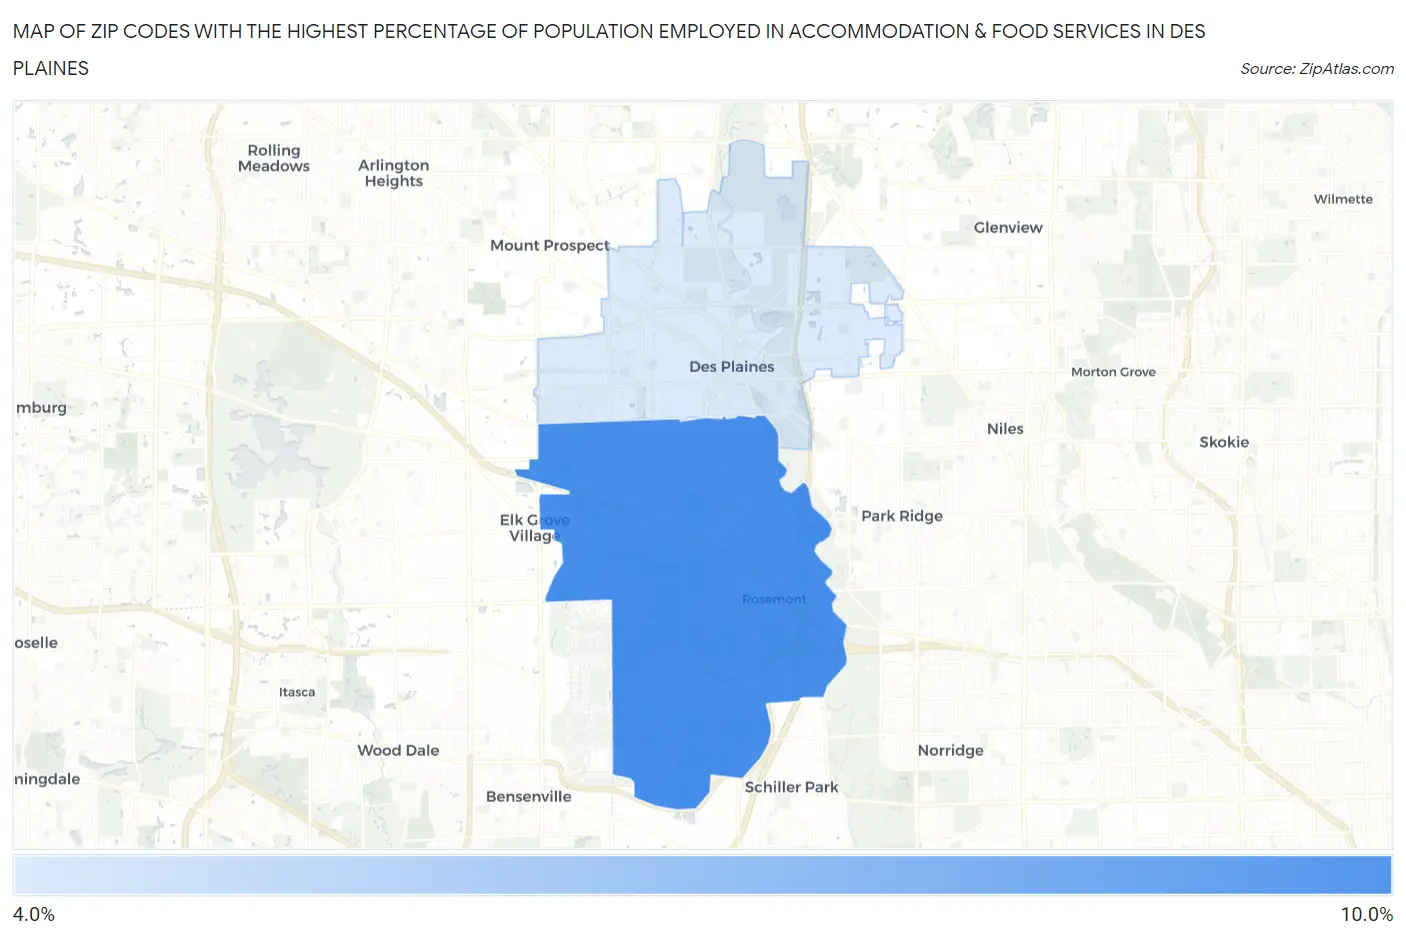
Map of Zip Codes with the Highest Percentage of Population Employed in Accommodation & Food Services in Des Plaines
0.0%
10.0%
Zip Codes with the Highest Percentage of Population Employed in Accommodation & Food Services in Des Plaines, IL
| Zip Code | % Employed | vs State | vs National | |
| 1. | 60018 | 8.9% | 6.5%(+2.42)#193 | 6.9%(+2.00)#6,143 |
| 2. | 60016 | 4.9% | 6.5%(-1.55)#683 | 6.9%(-1.96)#17,094 |
1
Common Questions
What are the Top Zip Codes with the Highest Percentage of Population Employed in Accommodation & Food Services in Des Plaines, IL?
Top Zip Codes with the Highest Percentage of Population Employed in Accommodation & Food Services in Des Plaines, IL are:
What zip code has the Highest Percentage of Population Employed in Accommodation & Food Services in Des Plaines, IL?
60018 has the Highest Percentage of Population Employed in Accommodation & Food Services in Des Plaines, IL with 8.9%.
What is the Percentage of Population Employed in Accommodation & Food Services in Des Plaines, IL?
Percentage of Population Employed in Accommodation & Food Services in Des Plaines is 5.6%.
What is the Percentage of Population Employed in Accommodation & Food Services in Illinois?
Percentage of Population Employed in Accommodation & Food Services in Illinois is 6.5%.
What is the Percentage of Population Employed in Accommodation & Food Services in the United States?
Percentage of Population Employed in Accommodation & Food Services in the United States is 6.9%.