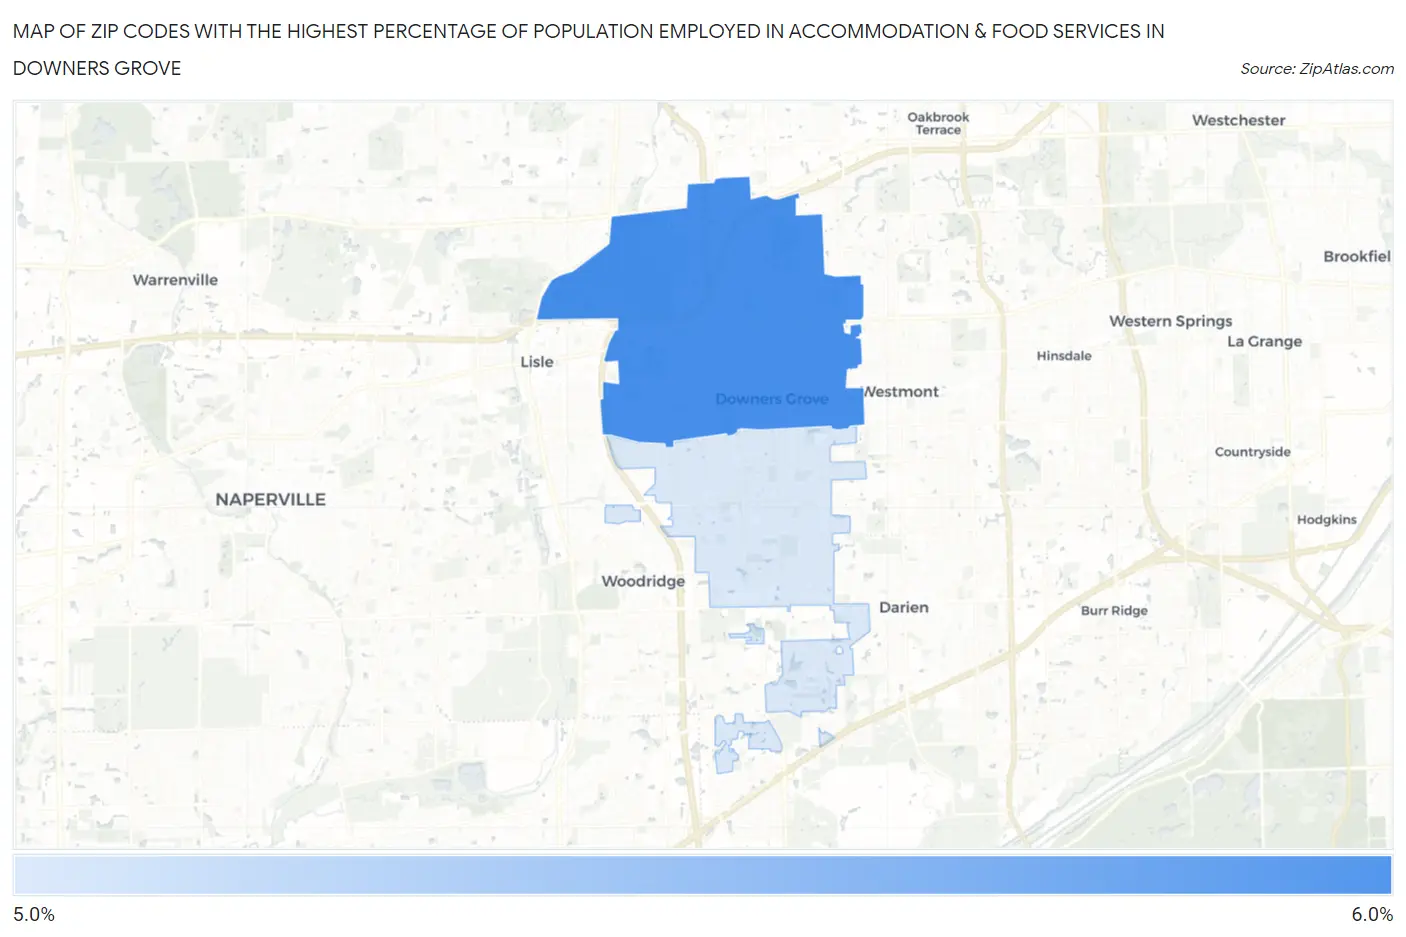
Zip Codes with the Highest Percentage of Population Employed in Accommodation & Food Services in Downers Grove, IL
RELATED REPORTS & OPTIONS
Accommodation & Food Services
Downers Grove
Compare Zip Codes
Map of Zip Codes with the Highest Percentage of Population Employed in Accommodation & Food Services in Downers Grove
0.0%
6.0%
Zip Codes with the Highest Percentage of Population Employed in Accommodation & Food Services in Downers Grove, IL
| Zip Code | % Employed | vs State | vs National | |
| 1. | 60515 | 5.3% | 6.5%(-1.16)#605 | 6.9%(-1.58)#15,762 |
| 2. | 60516 | 5.2% | 6.5%(-1.22)#616 | 6.9%(-1.63)#15,956 |
1
Common Questions
What are the Top Zip Codes with the Highest Percentage of Population Employed in Accommodation & Food Services in Downers Grove, IL?
Top Zip Codes with the Highest Percentage of Population Employed in Accommodation & Food Services in Downers Grove, IL are:
What zip code has the Highest Percentage of Population Employed in Accommodation & Food Services in Downers Grove, IL?
60515 has the Highest Percentage of Population Employed in Accommodation & Food Services in Downers Grove, IL with 5.3%.
What is the Percentage of Population Employed in Accommodation & Food Services in Downers Grove, IL?
Percentage of Population Employed in Accommodation & Food Services in Downers Grove is 5.4%.
What is the Percentage of Population Employed in Accommodation & Food Services in Illinois?
Percentage of Population Employed in Accommodation & Food Services in Illinois is 6.5%.
What is the Percentage of Population Employed in Accommodation & Food Services in the United States?
Percentage of Population Employed in Accommodation & Food Services in the United States is 6.9%.