Zip Codes with the Highest Poverty Level Among Children Under the Age of 5 in New Hampshire
RELATED REPORTS & OPTIONS
Highest Poverty | Child 0-5
New Hampshire
Compare Zip Codes
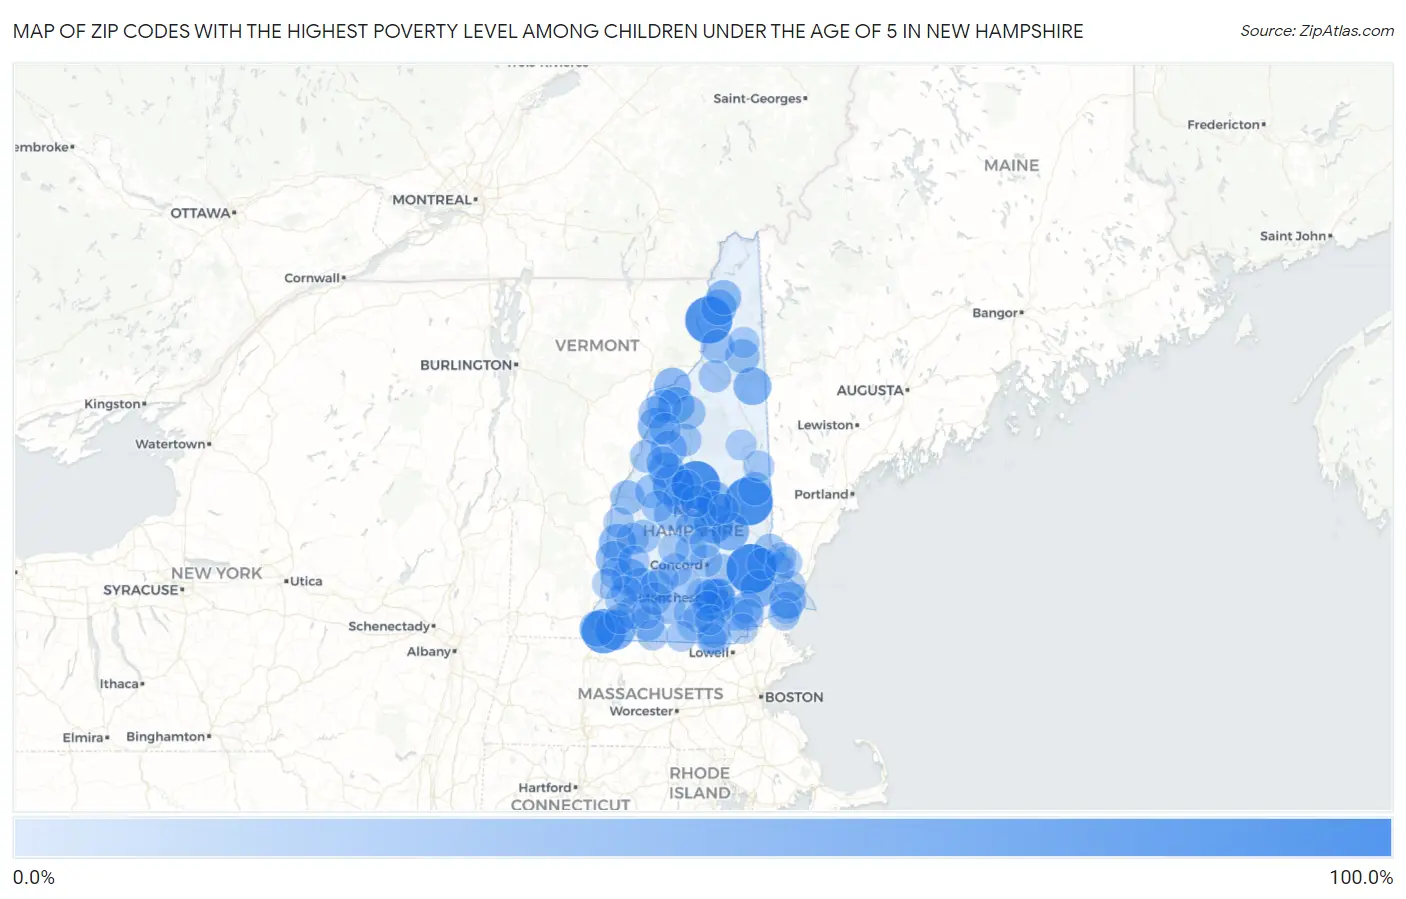
Map of Zip Codes with the Highest Poverty Level Among Children Under the Age of 5 in New Hampshire
0.0%
100.0%
Zip Codes with the Highest Poverty Level Among Children Under the Age of 5 in New Hampshire
| Zip Code | Child Poverty | vs State | vs National | |
| 1. | 03291 | 100.0% | 9.4%(+90.6)#1 | 18.1%(+81.9)#482 |
| 2. | 03894 | 92.3% | 9.4%(+82.9)#2 | 18.1%(+74.2)#610 |
| 3. | 03217 | 91.7% | 9.4%(+82.3)#3 | 18.1%(+73.6)#619 |
| 4. | 03590 | 87.7% | 9.4%(+78.3)#4 | 18.1%(+69.6)#659 |
| 5. | 03441 | 73.0% | 9.4%(+63.6)#5 | 18.1%(+54.9)#1,051 |
| 6. | 03241 | 59.4% | 9.4%(+50.0)#6 | 18.1%(+41.3)#1,735 |
| 7. | 03470 | 51.7% | 9.4%(+42.3)#7 | 18.1%(+33.7)#2,366 |
| 8. | 03101 | 48.5% | 9.4%(+39.1)#8 | 18.1%(+30.4)#2,759 |
| 9. | 03220 | 46.4% | 9.4%(+37.1)#9 | 18.1%(+28.4)#2,984 |
| 10. | 03837 | 41.6% | 9.4%(+32.2)#10 | 18.1%(+23.5)#3,730 |
| 11. | 03581 | 40.0% | 9.4%(+30.6)#11 | 18.1%(+21.9)#4,004 |
| 12. | 03042 | 38.2% | 9.4%(+28.8)#12 | 18.1%(+20.2)#4,367 |
| 13. | 03743 | 36.3% | 9.4%(+26.9)#13 | 18.1%(+18.2)#4,754 |
| 14. | 03561 | 36.1% | 9.4%(+26.8)#14 | 18.1%(+18.1)#4,794 |
| 15. | 03456 | 35.7% | 9.4%(+26.3)#15 | 18.1%(+17.7)#4,889 |
| 16. | 03862 | 35.4% | 9.4%(+26.0)#16 | 18.1%(+17.4)#4,974 |
| 17. | 03774 | 34.8% | 9.4%(+25.5)#17 | 18.1%(+16.8)#5,105 |
| 18. | 03586 | 33.3% | 9.4%(+24.0)#18 | 18.1%(+15.3)#5,491 |
| 19. | 03279 | 31.2% | 9.4%(+21.9)#19 | 18.1%(+13.2)#6,021 |
| 20. | 03451 | 31.0% | 9.4%(+21.6)#20 | 18.1%(+12.9)#6,105 |
| 21. | 03266 | 30.1% | 9.4%(+20.8)#21 | 18.1%(+12.1)#6,311 |
| 22. | 03597 | 29.4% | 9.4%(+20.0)#22 | 18.1%(+11.3)#6,533 |
| 23. | 03603 | 29.4% | 9.4%(+20.0)#23 | 18.1%(+11.3)#6,540 |
| 24. | 03253 | 28.7% | 9.4%(+19.3)#24 | 18.1%(+10.7)#6,726 |
| 25. | 03246 | 26.9% | 9.4%(+17.5)#25 | 18.1%(+8.83)#7,340 |
| 26. | 03103 | 26.3% | 9.4%(+16.9)#26 | 18.1%(+8.25)#7,547 |
| 27. | 03576 | 25.3% | 9.4%(+15.9)#27 | 18.1%(+7.24)#7,881 |
| 28. | 03464 | 25.0% | 9.4%(+15.6)#28 | 18.1%(+6.94)#8,000 |
| 29. | 03230 | 24.3% | 9.4%(+14.9)#29 | 18.1%(+6.22)#8,251 |
| 30. | 03102 | 23.1% | 9.4%(+13.7)#30 | 18.1%(+5.00)#8,748 |
| 31. | 03766 | 22.3% | 9.4%(+12.9)#31 | 18.1%(+4.20)#9,063 |
| 32. | 03570 | 21.5% | 9.4%(+12.1)#32 | 18.1%(+3.43)#9,390 |
| 33. | 03269 | 21.4% | 9.4%(+12.1)#33 | 18.1%(+3.37)#9,410 |
| 34. | 03440 | 21.2% | 9.4%(+11.8)#34 | 18.1%(+3.12)#9,532 |
| 35. | 03582 | 19.8% | 9.4%(+10.5)#35 | 18.1%(+1.76)#10,122 |
| 36. | 03452 | 19.7% | 9.4%(+10.3)#36 | 18.1%(+1.66)#10,169 |
| 37. | 03455 | 19.4% | 9.4%(+9.98)#37 | 18.1%(+1.29)#10,333 |
| 38. | 03864 | 18.6% | 9.4%(+9.20)#38 | 18.1%(+0.509)#10,694 |
| 39. | 03038 | 18.3% | 9.4%(+8.89)#39 | 18.1%(+0.197)#10,823 |
| 40. | 03580 | 17.9% | 9.4%(+8.48)#40 | 18.1%(-0.206)#11,026 |
| 41. | 03585 | 17.4% | 9.4%(+8.02)#41 | 18.1%(-0.671)#11,237 |
| 42. | 03104 | 16.3% | 9.4%(+6.97)#42 | 18.1%(-1.72)#11,727 |
| 43. | 03741 | 15.8% | 9.4%(+6.42)#43 | 18.1%(-2.27)#12,022 |
| 44. | 03782 | 15.7% | 9.4%(+6.34)#44 | 18.1%(-2.35)#12,068 |
| 45. | 03047 | 15.4% | 9.4%(+6.01)#45 | 18.1%(-2.68)#12,232 |
| 46. | 03262 | 15.4% | 9.4%(+6.01)#46 | 18.1%(-2.68)#12,238 |
| 47. | 03242 | 14.6% | 9.4%(+5.18)#47 | 18.1%(-3.51)#12,704 |
| 48. | 03064 | 14.3% | 9.4%(+4.91)#48 | 18.1%(-3.78)#12,823 |
| 49. | 03449 | 14.3% | 9.4%(+4.91)#49 | 18.1%(-3.78)#12,848 |
| 50. | 03740 | 13.8% | 9.4%(+4.42)#50 | 18.1%(-4.27)#13,166 |
| 51. | 03777 | 13.7% | 9.4%(+4.35)#51 | 18.1%(-4.34)#13,201 |
| 52. | 03060 | 13.6% | 9.4%(+4.20)#52 | 18.1%(-4.49)#13,284 |
| 53. | 03867 | 13.6% | 9.4%(+4.20)#53 | 18.1%(-4.49)#13,285 |
| 54. | 03282 | 13.4% | 9.4%(+4.07)#54 | 18.1%(-4.62)#13,359 |
| 55. | 03583 | 12.9% | 9.4%(+3.53)#55 | 18.1%(-5.16)#13,684 |
| 56. | 03873 | 12.9% | 9.4%(+3.50)#56 | 18.1%(-5.19)#13,704 |
| 57. | 03275 | 12.8% | 9.4%(+3.38)#57 | 18.1%(-5.30)#13,776 |
| 58. | 03773 | 12.6% | 9.4%(+3.18)#58 | 18.1%(-5.51)#13,871 |
| 59. | 03301 | 11.8% | 9.4%(+2.45)#59 | 18.1%(-6.24)#14,326 |
| 60. | 03235 | 11.4% | 9.4%(+1.99)#60 | 18.1%(-6.70)#14,596 |
| 61. | 03602 | 11.1% | 9.4%(+1.74)#61 | 18.1%(-6.95)#14,753 |
| 62. | 03842 | 11.0% | 9.4%(+1.61)#62 | 18.1%(-7.08)#14,844 |
| 63. | 03431 | 10.9% | 9.4%(+1.55)#63 | 18.1%(-7.14)#14,881 |
| 64. | 03222 | 10.9% | 9.4%(+1.53)#64 | 18.1%(-7.15)#14,889 |
| 65. | 03256 | 10.4% | 9.4%(+1.07)#65 | 18.1%(-7.62)#15,153 |
| 66. | 03303 | 10.0% | 9.4%(+0.586)#66 | 18.1%(-8.10)#15,446 |
| 67. | 03841 | 9.7% | 9.4%(+0.348)#67 | 18.1%(-8.34)#15,581 |
| 68. | 03785 | 9.7% | 9.4%(+0.303)#68 | 18.1%(-8.39)#15,606 |
| 69. | 03869 | 9.4% | 9.4%(-0.022)#69 | 18.1%(-8.71)#15,819 |
| 70. | 03801 | 9.3% | 9.4%(-0.037)#70 | 18.1%(-8.73)#15,831 |
| 71. | 03825 | 9.2% | 9.4%(-0.174)#71 | 18.1%(-8.86)#15,921 |
| 72. | 03240 | 8.8% | 9.4%(-0.602)#72 | 18.1%(-9.29)#16,226 |
| 73. | 03448 | 8.5% | 9.4%(-0.900)#73 | 18.1%(-9.59)#16,436 |
| 74. | 03605 | 8.5% | 9.4%(-0.924)#74 | 18.1%(-9.61)#16,449 |
| 75. | 03045 | 8.0% | 9.4%(-1.41)#75 | 18.1%(-10.1)#16,784 |
| 76. | 03874 | 7.4% | 9.4%(-2.01)#76 | 18.1%(-10.7)#17,154 |
| 77. | 03224 | 7.3% | 9.4%(-2.03)#77 | 18.1%(-10.7)#17,169 |
| 78. | 03836 | 7.1% | 9.4%(-2.23)#78 | 18.1%(-10.9)#17,292 |
| 79. | 03588 | 6.8% | 9.4%(-2.56)#79 | 18.1%(-11.2)#17,512 |
| 80. | 03278 | 6.7% | 9.4%(-2.71)#80 | 18.1%(-11.4)#17,621 |
| 81. | 03055 | 5.7% | 9.4%(-3.67)#81 | 18.1%(-12.4)#18,281 |
| 82. | 03062 | 5.3% | 9.4%(-4.06)#82 | 18.1%(-12.7)#18,567 |
| 83. | 03446 | 5.0% | 9.4%(-4.33)#83 | 18.1%(-13.0)#18,733 |
| 84. | 03461 | 5.0% | 9.4%(-4.37)#84 | 18.1%(-13.1)#18,760 |
| 85. | 03444 | 4.9% | 9.4%(-4.44)#85 | 18.1%(-13.1)#18,811 |
| 86. | 03818 | 4.9% | 9.4%(-4.52)#86 | 18.1%(-13.2)#18,877 |
| 87. | 03057 | 4.8% | 9.4%(-4.61)#87 | 18.1%(-13.3)#18,929 |
| 88. | 03608 | 4.7% | 9.4%(-4.67)#88 | 18.1%(-13.4)#18,976 |
| 89. | 03281 | 4.5% | 9.4%(-4.87)#89 | 18.1%(-13.6)#19,112 |
| 90. | 03031 | 4.5% | 9.4%(-4.92)#90 | 18.1%(-13.6)#19,151 |
| 91. | 03745 | 4.4% | 9.4%(-4.93)#91 | 18.1%(-13.6)#19,162 |
| 92. | 03079 | 4.0% | 9.4%(-5.37)#92 | 18.1%(-14.1)#19,489 |
| 93. | 03110 | 3.9% | 9.4%(-5.52)#93 | 18.1%(-14.2)#19,603 |
| 94. | 03048 | 3.8% | 9.4%(-5.58)#94 | 18.1%(-14.3)#19,653 |
| 95. | 03264 | 3.5% | 9.4%(-5.84)#95 | 18.1%(-14.5)#19,831 |
| 96. | 03820 | 3.3% | 9.4%(-6.03)#96 | 18.1%(-14.7)#19,939 |
| 97. | 03244 | 3.2% | 9.4%(-6.18)#97 | 18.1%(-14.9)#20,034 |
| 98. | 03878 | 2.8% | 9.4%(-6.54)#98 | 18.1%(-15.2)#20,284 |
| 99. | 03249 | 2.2% | 9.4%(-7.17)#99 | 18.1%(-15.9)#20,701 |
| 100. | 03054 | 2.0% | 9.4%(-7.37)#100 | 18.1%(-16.1)#20,834 |
Common Questions
What are the Top 10 Zip Codes with the Highest Poverty Level Among Children Under the Age of 5 in New Hampshire?
Top 10 Zip Codes with the Highest Poverty Level Among Children Under the Age of 5 in New Hampshire are:
What zip code has the Highest Poverty Level Among Children Under the Age of 5 in New Hampshire?
03291 has the Highest Poverty Level Among Children Under the Age of 5 in New Hampshire with 100.0%.
What is the Poverty Level Among Children Under the Age of 5 in the State of New Hampshire?
Poverty Level Among Children Under the Age of 5 in New Hampshire is 9.4%.
What is the Poverty Level Among Children Under the Age of 5 in the United States?
Poverty Level Among Children Under the Age of 5 in the United States is 18.1%.