Zip Codes with the Highest Poverty Level Among Children Under the Age of 5 in New Jersey
RELATED REPORTS & OPTIONS
Highest Poverty | Child 0-5
New Jersey
Compare Zip Codes
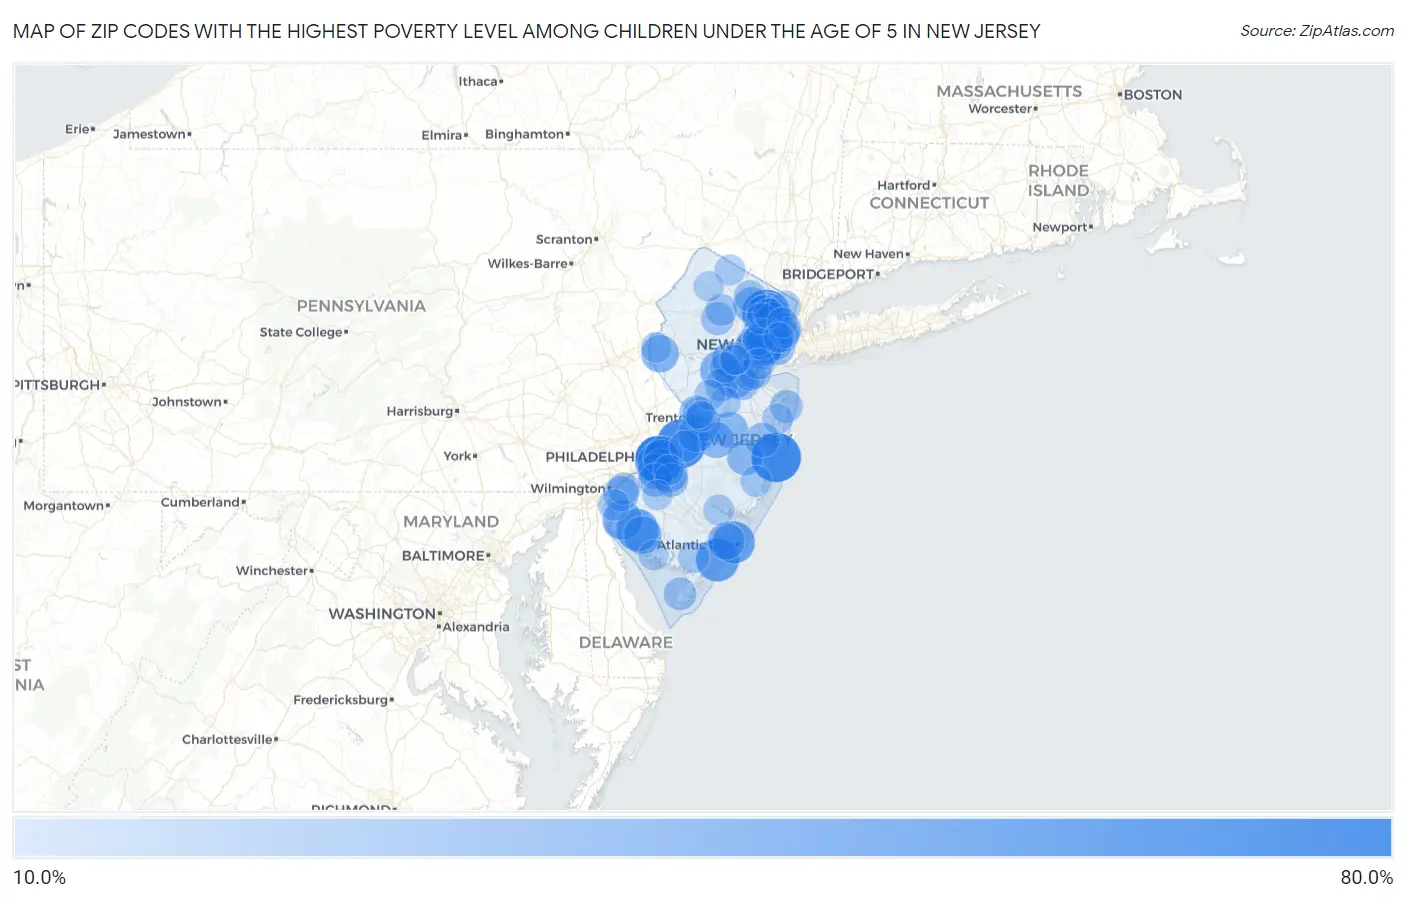
Map of Zip Codes with the Highest Poverty Level Among Children Under the Age of 5 in New Jersey
0.0%
80.0%
Zip Codes with the Highest Poverty Level Among Children Under the Age of 5 in New Jersey
| Zip Code | Child Poverty | vs State | vs National | |
| 1. | 08751 | 74.8% | 14.3%(+60.5)#1 | 18.1%(+56.7)#978 |
| 2. | 08010 | 72.6% | 14.3%(+58.3)#2 | 18.1%(+54.6)#1,063 |
| 3. | 07505 | 70.7% | 14.3%(+56.4)#3 | 18.1%(+52.6)#1,129 |
| 4. | 08103 | 69.4% | 14.3%(+55.1)#4 | 18.1%(+51.3)#1,175 |
| 5. | 07102 | 58.9% | 14.3%(+44.6)#5 | 18.1%(+40.8)#1,776 |
| 6. | 08102 | 56.2% | 14.3%(+41.9)#6 | 18.1%(+38.1)#1,975 |
| 7. | 08226 | 55.8% | 14.3%(+41.5)#7 | 18.1%(+37.8)#2,001 |
| 8. | 08104 | 54.3% | 14.3%(+40.0)#8 | 18.1%(+36.3)#2,117 |
| 9. | 08401 | 53.5% | 14.3%(+39.2)#9 | 18.1%(+35.5)#2,189 |
| 10. | 08353 | 52.9% | 14.3%(+38.7)#10 | 18.1%(+34.9)#2,254 |
| 11. | 07103 | 52.9% | 14.3%(+38.7)#11 | 18.1%(+34.9)#2,255 |
| 12. | 07108 | 48.8% | 14.3%(+34.5)#12 | 18.1%(+30.7)#2,720 |
| 13. | 08079 | 45.9% | 14.3%(+31.7)#13 | 18.1%(+27.9)#3,054 |
| 14. | 08901 | 43.0% | 14.3%(+28.7)#14 | 18.1%(+24.9)#3,488 |
| 15. | 08302 | 41.2% | 14.3%(+27.0)#15 | 18.1%(+23.2)#3,791 |
| 16. | 07503 | 41.2% | 14.3%(+26.9)#16 | 18.1%(+23.1)#3,797 |
| 17. | 08083 | 40.5% | 14.3%(+26.2)#17 | 18.1%(+22.4)#3,933 |
| 18. | 08611 | 40.4% | 14.3%(+26.1)#18 | 18.1%(+22.3)#3,944 |
| 19. | 08835 | 39.8% | 14.3%(+25.5)#19 | 18.1%(+21.7)#4,063 |
| 20. | 08804 | 39.6% | 14.3%(+25.4)#20 | 18.1%(+21.6)#4,094 |
| 21. | 08110 | 39.0% | 14.3%(+24.7)#21 | 18.1%(+21.0)#4,210 |
| 22. | 08059 | 38.8% | 14.3%(+24.6)#22 | 18.1%(+20.8)#4,242 |
| 23. | 07501 | 38.7% | 14.3%(+24.4)#23 | 18.1%(+20.6)#4,266 |
| 24. | 08232 | 38.3% | 14.3%(+24.1)#24 | 18.1%(+20.3)#4,336 |
| 25. | 07055 | 37.4% | 14.3%(+23.2)#25 | 18.1%(+19.4)#4,512 |
| 26. | 07514 | 37.4% | 14.3%(+23.1)#26 | 18.1%(+19.3)#4,519 |
| 27. | 08812 | 37.3% | 14.3%(+23.0)#27 | 18.1%(+19.2)#4,541 |
| 28. | 08093 | 37.0% | 14.3%(+22.7)#28 | 18.1%(+18.9)#4,596 |
| 29. | 07033 | 37.0% | 14.3%(+22.7)#29 | 18.1%(+18.9)#4,604 |
| 30. | 08554 | 36.7% | 14.3%(+22.4)#30 | 18.1%(+18.7)#4,656 |
| 31. | 07114 | 36.1% | 14.3%(+21.8)#31 | 18.1%(+18.0)#4,808 |
| 32. | 08514 | 35.9% | 14.3%(+21.6)#32 | 18.1%(+17.8)#4,857 |
| 33. | 07524 | 35.9% | 14.3%(+21.6)#33 | 18.1%(+17.8)#4,858 |
| 34. | 08562 | 35.7% | 14.3%(+21.4)#34 | 18.1%(+17.6)#4,905 |
| 35. | 08105 | 35.4% | 14.3%(+21.2)#35 | 18.1%(+17.4)#4,965 |
| 36. | 07513 | 35.3% | 14.3%(+21.0)#36 | 18.1%(+17.2)#5,012 |
| 37. | 07444 | 34.7% | 14.3%(+20.4)#37 | 18.1%(+16.6)#5,140 |
| 38. | 08759 | 34.3% | 14.3%(+20.0)#38 | 18.1%(+16.2)#5,224 |
| 39. | 07107 | 34.2% | 14.3%(+19.9)#39 | 18.1%(+16.2)#5,243 |
| 40. | 07522 | 34.1% | 14.3%(+19.8)#40 | 18.1%(+16.1)#5,272 |
| 41. | 08069 | 32.9% | 14.3%(+18.6)#41 | 18.1%(+14.8)#5,622 |
| 42. | 07305 | 32.7% | 14.3%(+18.4)#42 | 18.1%(+14.6)#5,676 |
| 43. | 07407 | 32.2% | 14.3%(+17.9)#43 | 18.1%(+14.1)#5,800 |
| 44. | 07105 | 31.7% | 14.3%(+17.4)#44 | 18.1%(+13.6)#5,908 |
| 45. | 07502 | 31.3% | 14.3%(+17.0)#45 | 18.1%(+13.2)#5,997 |
| 46. | 08701 | 31.0% | 14.3%(+16.7)#46 | 18.1%(+12.9)#6,085 |
| 47. | 08618 | 29.7% | 14.3%(+15.4)#47 | 18.1%(+11.7)#6,445 |
| 48. | 07050 | 29.0% | 14.3%(+14.7)#48 | 18.1%(+10.9)#6,665 |
| 49. | 08090 | 28.7% | 14.3%(+14.5)#49 | 18.1%(+10.7)#6,724 |
| 50. | 08021 | 28.5% | 14.3%(+14.2)#50 | 18.1%(+10.4)#6,823 |
| 51. | 07026 | 28.1% | 14.3%(+13.8)#51 | 18.1%(+10.0)#6,951 |
| 52. | 07205 | 27.9% | 14.3%(+13.6)#52 | 18.1%(+9.83)#6,993 |
| 53. | 07018 | 27.6% | 14.3%(+13.4)#53 | 18.1%(+9.58)#7,078 |
| 54. | 07206 | 27.5% | 14.3%(+13.2)#54 | 18.1%(+9.45)#7,130 |
| 55. | 07111 | 27.3% | 14.3%(+13.0)#55 | 18.1%(+9.22)#7,208 |
| 56. | 07803 | 27.1% | 14.3%(+12.9)#56 | 18.1%(+9.07)#7,262 |
| 57. | 07104 | 27.1% | 14.3%(+12.8)#57 | 18.1%(+9.06)#7,267 |
| 58. | 07017 | 26.4% | 14.3%(+12.1)#58 | 18.1%(+8.34)#7,510 |
| 59. | 07087 | 26.4% | 14.3%(+12.1)#59 | 18.1%(+8.32)#7,518 |
| 60. | 08882 | 26.4% | 14.3%(+12.1)#60 | 18.1%(+8.31)#7,519 |
| 61. | 08861 | 26.2% | 14.3%(+12.0)#61 | 18.1%(+8.18)#7,570 |
| 62. | 08251 | 26.2% | 14.3%(+12.0)#62 | 18.1%(+8.17)#7,573 |
| 63. | 07740 | 26.2% | 14.3%(+11.9)#63 | 18.1%(+8.16)#7,576 |
| 64. | 07304 | 26.1% | 14.3%(+11.8)#64 | 18.1%(+8.06)#7,606 |
| 65. | 08823 | 26.0% | 14.3%(+11.7)#65 | 18.1%(+7.91)#7,650 |
| 66. | 07201 | 25.6% | 14.3%(+11.3)#66 | 18.1%(+7.53)#7,775 |
| 67. | 07022 | 25.3% | 14.3%(+11.1)#67 | 18.1%(+7.28)#7,866 |
| 68. | 07088 | 25.0% | 14.3%(+10.7)#68 | 18.1%(+6.94)#7,969 |
| 69. | 08067 | 24.6% | 14.3%(+10.4)#69 | 18.1%(+6.59)#8,129 |
| 70. | 07112 | 24.1% | 14.3%(+9.82)#70 | 18.1%(+6.03)#8,318 |
| 71. | 07885 | 23.8% | 14.3%(+9.51)#71 | 18.1%(+5.73)#8,454 |
| 72. | 07420 | 23.7% | 14.3%(+9.47)#72 | 18.1%(+5.68)#8,472 |
| 73. | 07060 | 23.7% | 14.3%(+9.41)#73 | 18.1%(+5.62)#8,494 |
| 74. | 07106 | 23.6% | 14.3%(+9.33)#74 | 18.1%(+5.55)#8,528 |
| 75. | 08638 | 23.3% | 14.3%(+9.04)#75 | 18.1%(+5.26)#8,641 |
| 76. | 08832 | 23.2% | 14.3%(+8.95)#76 | 18.1%(+5.17)#8,672 |
| 77. | 08070 | 22.8% | 14.3%(+8.56)#77 | 18.1%(+4.77)#8,826 |
| 78. | 07424 | 22.6% | 14.3%(+8.34)#78 | 18.1%(+4.55)#8,912 |
| 79. | 08046 | 22.6% | 14.3%(+8.30)#79 | 18.1%(+4.52)#8,933 |
| 80. | 08758 | 22.5% | 14.3%(+8.24)#80 | 18.1%(+4.46)#8,955 |
| 81. | 08270 | 22.2% | 14.3%(+7.97)#81 | 18.1%(+4.18)#9,068 |
| 82. | 07008 | 21.4% | 14.3%(+7.12)#82 | 18.1%(+3.34)#9,439 |
| 83. | 07641 | 21.3% | 14.3%(+7.00)#83 | 18.1%(+3.21)#9,494 |
| 84. | 08512 | 21.2% | 14.3%(+6.96)#84 | 18.1%(+3.17)#9,515 |
| 85. | 07093 | 20.7% | 14.3%(+6.40)#85 | 18.1%(+2.62)#9,730 |
| 86. | 08215 | 20.6% | 14.3%(+6.37)#86 | 18.1%(+2.58)#9,741 |
| 87. | 08540 | 20.6% | 14.3%(+6.37)#87 | 18.1%(+2.58)#9,742 |
| 88. | 07462 | 20.6% | 14.3%(+6.31)#88 | 18.1%(+2.53)#9,768 |
| 89. | 07753 | 20.5% | 14.3%(+6.27)#89 | 18.1%(+2.48)#9,786 |
| 90. | 08045 | 20.4% | 14.3%(+6.11)#90 | 18.1%(+2.33)#9,853 |
| 91. | 08865 | 20.3% | 14.3%(+6.04)#91 | 18.1%(+2.25)#9,885 |
| 92. | 08880 | 20.3% | 14.3%(+6.01)#92 | 18.1%(+2.22)#9,901 |
| 93. | 07504 | 20.0% | 14.3%(+5.74)#93 | 18.1%(+1.96)#10,000 |
| 94. | 07660 | 19.8% | 14.3%(+5.51)#94 | 18.1%(+1.72)#10,142 |
| 95. | 07063 | 19.8% | 14.3%(+5.49)#95 | 18.1%(+1.71)#10,151 |
| 96. | 08609 | 19.7% | 14.3%(+5.40)#96 | 18.1%(+1.62)#10,185 |
| 97. | 08345 | 19.6% | 14.3%(+5.33)#97 | 18.1%(+1.55)#10,222 |
| 98. | 07307 | 19.5% | 14.3%(+5.24)#98 | 18.1%(+1.46)#10,256 |
| 99. | 07848 | 19.3% | 14.3%(+4.99)#99 | 18.1%(+1.20)#10,375 |
| 100. | 08028 | 19.1% | 14.3%(+4.87)#100 | 18.1%(+1.08)#10,442 |
Common Questions
What are the Top 10 Zip Codes with the Highest Poverty Level Among Children Under the Age of 5 in New Jersey?
Top 10 Zip Codes with the Highest Poverty Level Among Children Under the Age of 5 in New Jersey are:
What zip code has the Highest Poverty Level Among Children Under the Age of 5 in New Jersey?
08751 has the Highest Poverty Level Among Children Under the Age of 5 in New Jersey with 74.8%.
What is the Poverty Level Among Children Under the Age of 5 in the State of New Jersey?
Poverty Level Among Children Under the Age of 5 in New Jersey is 14.3%.
What is the Poverty Level Among Children Under the Age of 5 in the United States?
Poverty Level Among Children Under the Age of 5 in the United States is 18.1%.