Immigrants from Latin America vs Hawaiian Married-couple Households

COMPARE

Immigrants from Latin America
Race
Ancestry
AfghanAfricanAlaska NativeAlaskan AthabascanAlbanianAleutAlsatianAmericanApacheArabArapahoArgentineanArmenianAssyrian/Chaldean/SyriacAustralianAustrianBahamianBangladeshiBarbadianBasqueBelgianBelizeanBermudanBhutaneseBlackfeetBolivianBrazilianBritishBritish West IndianBulgarianBurmeseCajunCambodianCanadianCape VerdeanCarpatho RusynCelticCentral AmericanCentral American IndianCherokeeCheyenneChickasawChileanChineseChippewaChoctawColombianColvilleComancheCosta RicanCreeCreekCroatianCrowCubanCypriotCzechCzechoslovakianDanishDelawareDominicanDutchDutch West IndianEastern EuropeanEcuadorianEgyptianEnglishEstonianEthiopianEuropeanFijianFilipinoFinnishFrenchFrench American IndianFrench CanadianGermanGerman RussianGhanaianGreekGuamanian/ChamorroGuatemalanGuyaneseHaitianHmongHonduranHopiHoumaHungarianIcelanderIndian (Asian)IndonesianInupiatIranianIraqiIrishIroquoisIsraeliItalianJamaicanJapaneseJordanianKenyanKiowaKoreanLaotianLatvianLebaneseLiberianLithuanianLumbeeLuxembourgerMacedonianMalaysianMalteseMarshalleseMenomineeMexicanMexican American IndianMongolianMoroccanNative HawaiianNavajoNepaleseNew ZealanderNicaraguanNigerianNorthern EuropeanNorwegianOkinawanOsageOttawaPaiutePakistaniPalestinianPanamanianParaguayanPennsylvania GermanPeruvianPimaPolishPortuguesePotawatomiPuebloPuerto RicanPuget Sound SalishRomanianRussianSalvadoranSamoanScandinavianScotch-IrishScottishSeminoleSenegaleseSerbianShoshoneSierra LeoneanSiouxSlavicSlovakSloveneSomaliSouth AfricanSouth AmericanSouth American IndianSoviet UnionSpaniardSpanishSpanish AmericanSpanish American IndianSri LankanSubsaharan AfricanSudaneseSwedishSwissSyrianTaiwaneseThaiTlingit-HaidaTohono O'OdhamTonganTrinidadian and TobagonianTsimshianTurkishU.S. Virgin IslanderUgandanUkrainianUruguayanUteVenezuelanVietnameseWelshWest IndianYakamaYaquiYugoslavianYumanYup'ikZimbabwean
Immigration
NonimmigrantsImmigrantsAfghanistanAfricaAlbaniaArgentinaArmeniaAsiaAustraliaAustriaBahamasBangladeshBarbadosBelarusBelgiumBelizeBoliviaBosnia and HerzegovinaBrazilBulgariaBurma/MyanmarCabo VerdeCambodiaCameroonCanadaCaribbeanCentral AmericaChileChinaColombiaCongoCosta RicaCroatiaCubaCzechoslovakiaDenmarkDominicaDominican RepublicEastern AfricaEastern AsiaEastern EuropeEcuadorEgyptEl SalvadorEnglandEritreaEthiopiaEuropeFijiFranceGermanyGhanaGreeceGrenadaGuatemalaGuyanaHaitiHondurasHong KongHungaryIndiaIndonesiaIranIraqIrelandIsraelItalyJamaicaJapanJordanKazakhstanKenyaKoreaKuwaitLaosLatin AmericaLatviaLebanonLiberiaLithuaniaMalaysiaMexicoMicronesiaMiddle AfricaMoldovaMoroccoNepalNetherlandsNicaraguaNigeriaNorth AmericaNorth MacedoniaNorthern AfricaNorthern EuropeNorwayOceaniaPakistanPanamaPeruPhilippinesPolandPortugalRomaniaRussiaSaudi ArabiaScotlandSenegalSerbiaSierra LeoneSingaporeSomaliaSouth AfricaSouth AmericaSouth Central AsiaSouth Eastern AsiaSouthern EuropeSpainSri LankaSt. Vincent and the GrenadinesSudanSwedenSwitzerlandSyriaTaiwanThailandTrinidad and TobagoTurkeyUgandaUkraineUruguayUzbekistanVenezuelaVietnamWest IndiesWestern AfricaWestern AsiaWestern EuropeYemenZaireZimbabweAzores
Hawaiian
Race
Ancestry
AfghanAfricanAlaska NativeAlaskan AthabascanAlbanianAleutAlsatianAmericanApacheArabArapahoArgentineanArmenianAssyrian/Chaldean/SyriacAustralianAustrianBahamianBangladeshiBarbadianBasqueBelgianBelizeanBermudanBhutaneseBlackfeetBolivianBrazilianBritishBritish West IndianBulgarianBurmeseCajunCambodianCanadianCape VerdeanCarpatho RusynCelticCentral AmericanCentral American IndianCherokeeCheyenneChickasawChileanChineseChippewaChoctawColombianColvilleComancheCosta RicanCreeCreekCroatianCrowCubanCypriotCzechCzechoslovakianDanishDelawareDominicanDutchDutch West IndianEastern EuropeanEcuadorianEgyptianEnglishEstonianEthiopianEuropeanFijianFilipinoFinnishFrenchFrench American IndianFrench CanadianGermanGerman RussianGhanaianGreekGuamanian/ChamorroGuatemalanGuyaneseHaitianHmongHonduranHopiHoumaHungarianIcelanderIndian (Asian)IndonesianInupiatIranianIraqiIrishIroquoisIsraeliItalianJamaicanJapaneseJordanianKenyanKiowaKoreanLaotianLatvianLebaneseLiberianLithuanianLumbeeLuxembourgerMacedonianMalaysianMalteseMarshalleseMenomineeMexicanMexican American IndianMongolianMoroccanNative HawaiianNavajoNepaleseNew ZealanderNicaraguanNigerianNorthern EuropeanNorwegianOkinawanOsageOttawaPaiutePakistaniPalestinianPanamanianParaguayanPennsylvania GermanPeruvianPimaPolishPortuguesePotawatomiPuebloPuerto RicanPuget Sound SalishRomanianRussianSalvadoranSamoanScandinavianScotch-IrishScottishSeminoleSenegaleseSerbianShoshoneSierra LeoneanSiouxSlavicSlovakSloveneSomaliSouth AfricanSouth AmericanSouth American IndianSoviet UnionSpaniardSpanishSpanish AmericanSpanish American IndianSri LankanSubsaharan AfricanSudaneseSwedishSwissSyrianTaiwaneseThaiTlingit-HaidaTohono O'OdhamTonganTrinidadian and TobagonianTsimshianTurkishU.S. Virgin IslanderUgandanUkrainianUruguayanUteVenezuelanVietnameseWelshWest IndianYakamaYaquiYugoslavianYumanYup'ikZimbabwean
Immigration
NonimmigrantsImmigrantsAfghanistanAfricaAlbaniaArgentinaArmeniaAsiaAustraliaAustriaBahamasBangladeshBarbadosBelarusBelgiumBelizeBoliviaBosnia and HerzegovinaBrazilBulgariaBurma/MyanmarCabo VerdeCambodiaCameroonCanadaCaribbeanCentral AmericaChileChinaColombiaCongoCosta RicaCroatiaCubaCzechoslovakiaDenmarkDominicaDominican RepublicEastern AfricaEastern AsiaEastern EuropeEcuadorEgyptEl SalvadorEnglandEritreaEthiopiaEuropeFijiFranceGermanyGhanaGreeceGrenadaGuatemalaGuyanaHaitiHondurasHong KongHungaryIndiaIndonesiaIranIraqIrelandIsraelItalyJamaicaJapanJordanKazakhstanKenyaKoreaKuwaitLaosLatviaLebanonLiberiaLithuaniaMalaysiaMexicoMicronesiaMiddle AfricaMoldovaMoroccoNepalNetherlandsNicaraguaNigeriaNorth AmericaNorth MacedoniaNorthern AfricaNorthern EuropeNorwayOceaniaPakistanPanamaPeruPhilippinesPolandPortugalRomaniaRussiaSaudi ArabiaScotlandSenegalSerbiaSierra LeoneSingaporeSomaliaSouth AfricaSouth AmericaSouth Central AsiaSouth Eastern AsiaSouthern EuropeSpainSri LankaSt. Vincent and the GrenadinesSudanSwedenSwitzerlandSyriaTaiwanThailandTrinidad and TobagoTurkeyUgandaUkraineUruguayUzbekistanVenezuelaVietnamWest IndiesWestern AfricaWestern AsiaWestern EuropeYemenZaireZimbabweAzores
Married-couple Households
Income
Poverty
Unemployment
Labor Participation
Family Structure
Vehicle Availability
Education Level
Disability

Married-couple Households Comparison

Immigrants from Latin America

Hawaiians

Tragic
Exceptional
44.7%
MARRIED-COUPLE HOUSEHOLDS
1.6/ 100
METRIC RATING
229th/ 347
METRIC RANK
47.8%
MARRIED-COUPLE HOUSEHOLDS
96.0/ 100
METRIC RATING
103rd/ 347
METRIC RANK

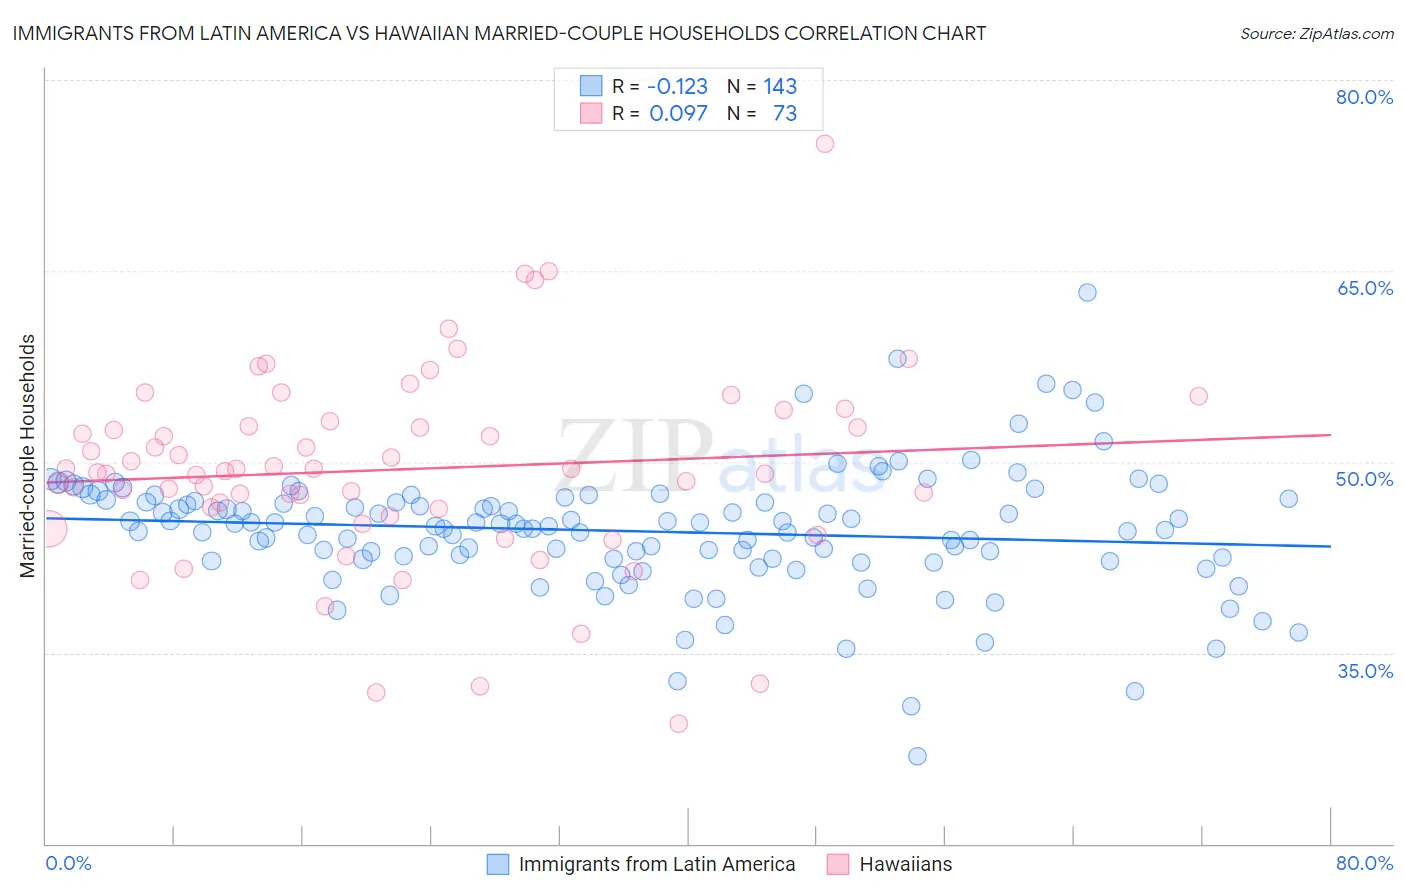
Immigrants from Latin America vs Hawaiian Married-couple Households Correlation Chart

The statistical analysis conducted on geographies consisting of 557,974,846 people shows a poor negative correlation between the proportion of Immigrants from Latin America and percentage of married-couple family households in the United States with a correlation coefficient (R) of -0.123 and weighted average of 44.7%. Similarly, the statistical analysis conducted on geographies consisting of 327,384,536 people shows a slight positive correlation between the proportion of Hawaiians and percentage of married-couple family households in the United States with a correlation coefficient (R) of 0.097 and weighted average of 47.8%, a difference of 7.1%.
Immigrants from Latin America vs Hawaiian Married-couple Households

Married-couple Households Correlation Summary

MeasurementImmigrants from Latin AmericaHawaiian
Minimum26.9%29.5%
Maximum63.3%75.0%
Range36.4%45.5%
Mean44.6%49.4%
Median45.0%49.3%
Interquartile 25% (IQ1)42.4%46.0%
Interquartile 75% (IQ3)47.0%53.0%
Interquartile Range (IQR)4.7%7.0%
Standard Deviation (Sample)4.9%7.7%
Standard Deviation (Population)4.9%7.7%

Similar Demographics by Married-couple Households

Demographics Similar to Immigrants from Latin America by Married-couple Households

In terms of married-couple households, the demographic groups most similar to Immigrants from Latin America are Soviet Union (44.6%, a difference of 0.040%), Kenyan (44.7%, a difference of 0.050%), Houma (44.6%, a difference of 0.050%), Marshallese (44.6%, a difference of 0.050%), and Immigrants from Uganda (44.6%, a difference of 0.090%).
DemographicsRating | RankMarried-couple Households
Immigrants | Laos
4.6
/100
|
#222
Tragic
45.1%
Immigrants | Cambodia
2.7
/100
|
#223
Tragic
44.9%
Immigrants | Micronesia
2.6
/100
|
#224
Tragic
44.9%
Dutch West Indians
2.6
/100
|
#225
Tragic
44.9%
Alsatians
2.3
/100
|
#226
Tragic
44.8%
Salvadorans
1.9
/100
|
#227
Tragic
44.7%
Kenyans
1.7
/100
|
#228
Tragic
44.7%
Immigrants | Latin America
1.6
/100
|
#229
Tragic
44.7%
Soviet Union
1.6
/100
|
#230
Tragic
44.6%
Houma
1.5
/100
|
#231
Tragic
44.6%
Marshallese
1.5
/100
|
#232
Tragic
44.6%
Immigrants | Uganda
1.5
/100
|
#233
Tragic
44.6%
Immigrants | Panama
1.3
/100
|
#234
Tragic
44.6%
Immigrants | Nicaragua
1.2
/100
|
#235
Tragic
44.5%
Yaqui
1.2
/100
|
#236
Tragic
44.5%

Demographics Similar to Hawaiians by Married-couple Households

In terms of married-couple households, the demographic groups most similar to Hawaiians are Slavic (47.8%, a difference of 0.0%), Immigrants from South Africa (47.8%, a difference of 0.010%), Turkish (47.8%, a difference of 0.020%), Immigrants from Italy (47.9%, a difference of 0.080%), and Immigrants from Austria (47.9%, a difference of 0.090%).
DemographicsRating | RankMarried-couple Households
Immigrants | Egypt
96.6
/100
|
#96
Exceptional
47.9%
Latvians
96.5
/100
|
#97
Exceptional
47.9%
Immigrants | North Macedonia
96.4
/100
|
#98
Exceptional
47.9%
Immigrants | Austria
96.4
/100
|
#99
Exceptional
47.9%
Immigrants | Italy
96.3
/100
|
#100
Exceptional
47.9%
Turks
96.1
/100
|
#101
Exceptional
47.8%
Slavs
96.0
/100
|
#102
Exceptional
47.8%
Hawaiians
96.0
/100
|
#103
Exceptional
47.8%
Immigrants | South Africa
96.0
/100
|
#104
Exceptional
47.8%
Immigrants | Czechoslovakia
95.5
/100
|
#105
Exceptional
47.8%
Portuguese
95.5
/100
|
#106
Exceptional
47.8%
Estonians
94.7
/100
|
#107
Exceptional
47.7%
Immigrants | Japan
94.4
/100
|
#108
Exceptional
47.7%
Immigrants | Jordan
94.1
/100
|
#109
Exceptional
47.7%
Macedonians
93.9
/100
|
#110
Exceptional
47.6%