Colville vs Sudanese Married-couple Households
COMPARE
Colville
Sudanese
Married-couple Households
Married-couple Households Comparison
Colville
Sudanese
41.0%
MARRIED-COUPLE HOUSEHOLDS
0.0/ 100
METRIC RATING
311th/ 347
METRIC RANK
42.1%
MARRIED-COUPLE HOUSEHOLDS
0.0/ 100
METRIC RATING
289th/ 347
METRIC RANK
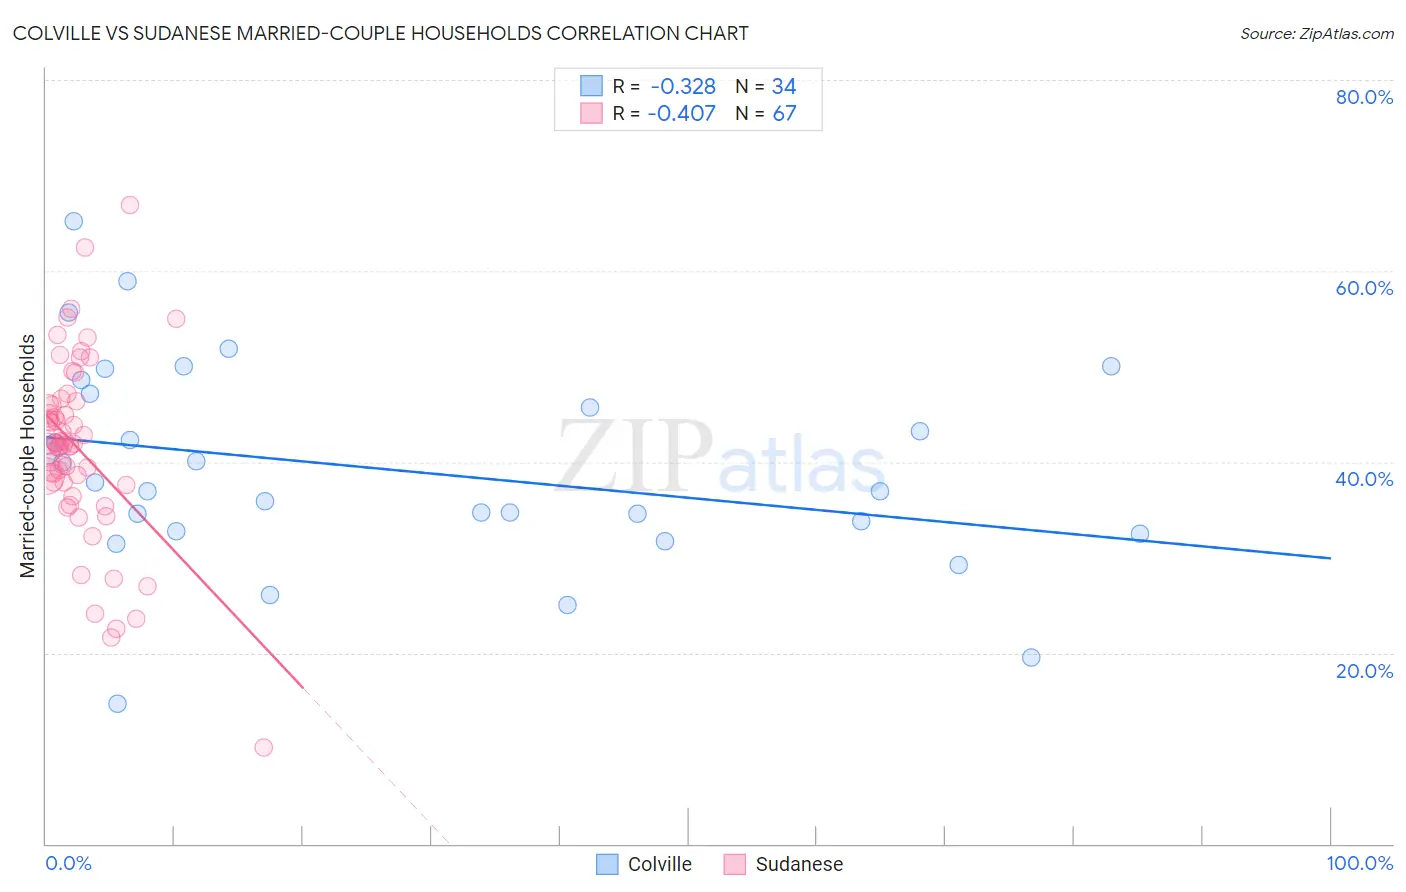
Colville vs Sudanese Married-couple Households Correlation Chart
The statistical analysis conducted on geographies consisting of 34,682,856 people shows a mild negative correlation between the proportion of Colville and percentage of married-couple family households in the United States with a correlation coefficient (R) of -0.328 and weighted average of 41.0%. Similarly, the statistical analysis conducted on geographies consisting of 110,110,852 people shows a moderate negative correlation between the proportion of Sudanese and percentage of married-couple family households in the United States with a correlation coefficient (R) of -0.407 and weighted average of 42.1%, a difference of 2.7%.
Married-couple Households Correlation Summary
| Measurement | Colville | Sudanese |
| Minimum | 14.7% | 10.0% |
| Maximum | 65.2% | 66.9% |
| Range | 50.6% | 56.9% |
| Mean | 39.2% | 41.4% |
| Median | 37.4% | 41.9% |
| Interquartile 25% (IQ1) | 32.8% | 37.8% |
| Interquartile 75% (IQ3) | 47.2% | 46.1% |
| Interquartile Range (IQR) | 14.4% | 8.3% |
| Standard Deviation (Sample) | 10.8% | 9.5% |
| Standard Deviation (Population) | 10.7% | 9.5% |
Similar Demographics by Married-couple Households
Demographics Similar to Colville by Married-couple Households
In terms of married-couple households, the demographic groups most similar to Colville are African (40.9%, a difference of 0.090%), Immigrants from Haiti (40.9%, a difference of 0.15%), Jamaican (40.9%, a difference of 0.22%), Trinidadian and Tobagonian (40.9%, a difference of 0.30%), and Immigrants from Caribbean (40.8%, a difference of 0.49%).
| Demographics | Rating | Rank | Married-couple Households |
| Immigrants | Guyana | 0.0 /100 | #304 | Tragic 41.6% |
| Sioux | 0.0 /100 | #305 | Tragic 41.5% |
| Guyanese | 0.0 /100 | #306 | Tragic 41.4% |
| Immigrants | Western Africa | 0.0 /100 | #307 | Tragic 41.4% |
| Crow | 0.0 /100 | #308 | Tragic 41.4% |
| Immigrants | Trinidad and Tobago | 0.0 /100 | #309 | Tragic 41.2% |
| Haitians | 0.0 /100 | #310 | Tragic 41.2% |
| Colville | 0.0 /100 | #311 | Tragic 41.0% |
| Africans | 0.0 /100 | #312 | Tragic 40.9% |
| Immigrants | Haiti | 0.0 /100 | #313 | Tragic 40.9% |
| Jamaicans | 0.0 /100 | #314 | Tragic 40.9% |
| Trinidadians and Tobagonians | 0.0 /100 | #315 | Tragic 40.9% |
| Immigrants | Caribbean | 0.0 /100 | #316 | Tragic 40.8% |
| Immigrants | Jamaica | 0.0 /100 | #317 | Tragic 40.7% |
| Liberians | 0.0 /100 | #318 | Tragic 40.7% |
Demographics Similar to Sudanese by Married-couple Households
In terms of married-couple households, the demographic groups most similar to Sudanese are Honduran (42.1%, a difference of 0.050%), Immigrants from Eritrea (42.1%, a difference of 0.060%), Paiute (42.1%, a difference of 0.060%), Indonesian (42.0%, a difference of 0.11%), and Chippewa (42.1%, a difference of 0.14%).
| Demographics | Rating | Rank | Married-couple Households |
| Bermudans | 0.0 /100 | #282 | Tragic 42.4% |
| Inupiat | 0.0 /100 | #283 | Tragic 42.4% |
| Cheyenne | 0.0 /100 | #284 | Tragic 42.3% |
| Ghanaians | 0.0 /100 | #285 | Tragic 42.2% |
| Belizeans | 0.0 /100 | #286 | Tragic 42.2% |
| Chippewa | 0.0 /100 | #287 | Tragic 42.1% |
| Immigrants | Eritrea | 0.0 /100 | #288 | Tragic 42.1% |
| Sudanese | 0.0 /100 | #289 | Tragic 42.1% |
| Hondurans | 0.0 /100 | #290 | Tragic 42.1% |
| Paiute | 0.0 /100 | #291 | Tragic 42.1% |
| Indonesians | 0.0 /100 | #292 | Tragic 42.0% |
| Menominee | 0.0 /100 | #293 | Tragic 42.0% |
| Immigrants | Yemen | 0.0 /100 | #294 | Tragic 42.0% |
| Kiowa | 0.0 /100 | #295 | Tragic 42.0% |
| Immigrants | Sudan | 0.0 /100 | #296 | Tragic 41.9% |