Celtic vs Colombian GED/Equivalency

COMPARE

Celtic
Race
Ancestry
AfghanAfricanAlaska NativeAlaskan AthabascanAlbanianAleutAlsatianAmericanApacheArabArapahoArgentineanArmenianAssyrian/Chaldean/SyriacAustralianAustrianBahamianBangladeshiBarbadianBasqueBelgianBelizeanBermudanBhutaneseBlackfeetBolivianBrazilianBritishBritish West IndianBulgarianBurmeseCajunCambodianCanadianCape VerdeanCarpatho RusynCelticCentral AmericanCentral American IndianCherokeeCheyenneChickasawChileanChineseChippewaChoctawColvilleComancheCosta RicanCreeCreekCroatianCrowCubanCypriotCzechCzechoslovakianDanishDelawareDominicanDutchDutch West IndianEastern EuropeanEcuadorianEgyptianEnglishEstonianEthiopianEuropeanFijianFilipinoFinnishFrenchFrench American IndianFrench CanadianGermanGerman RussianGhanaianGreekGuamanian/ChamorroGuatemalanGuyaneseHaitianHmongHonduranHopiHoumaHungarianIcelanderIndian (Asian)IndonesianInupiatIranianIraqiIrishIroquoisIsraeliItalianJamaicanJapaneseJordanianKenyanKiowaKoreanLaotianLatvianLebaneseLiberianLithuanianLumbeeLuxembourgerMacedonianMalaysianMalteseMarshalleseMenomineeMexicanMexican American IndianMongolianMoroccanNative HawaiianNavajoNepaleseNew ZealanderNicaraguanNigerianNorthern EuropeanNorwegianOkinawanOsageOttawaPaiutePakistaniPalestinianPanamanianParaguayanPennsylvania GermanPeruvianPimaPolishPortuguesePotawatomiPuebloPuerto RicanPuget Sound SalishRomanianRussianSalvadoranSamoanScandinavianScotch-IrishScottishSeminoleSenegaleseSerbianShoshoneSierra LeoneanSiouxSlavicSlovakSloveneSomaliSouth AfricanSouth AmericanSouth American IndianSoviet UnionSpaniardSpanishSpanish AmericanSpanish American IndianSri LankanSubsaharan AfricanSudaneseSwedishSwissSyrianTaiwaneseThaiTlingit-HaidaTohono O'OdhamTonganTrinidadian and TobagonianTsimshianTurkishU.S. Virgin IslanderUgandanUkrainianUruguayanUteVenezuelanVietnameseWelshWest IndianYakamaYaquiYugoslavianYumanYup'ikZimbabwean
Immigration
NonimmigrantsImmigrantsAfghanistanAfricaAlbaniaArgentinaArmeniaAsiaAustraliaAustriaBahamasBangladeshBarbadosBelarusBelgiumBelizeBoliviaBosnia and HerzegovinaBrazilBulgariaBurma/MyanmarCabo VerdeCambodiaCameroonCanadaCaribbeanCentral AmericaChileChinaColombiaCongoCosta RicaCroatiaCubaCzechoslovakiaDenmarkDominicaDominican RepublicEastern AfricaEastern AsiaEastern EuropeEcuadorEgyptEl SalvadorEnglandEritreaEthiopiaEuropeFijiFranceGermanyGhanaGreeceGrenadaGuatemalaGuyanaHaitiHondurasHong KongHungaryIndiaIndonesiaIranIraqIrelandIsraelItalyJamaicaJapanJordanKazakhstanKenyaKoreaKuwaitLaosLatin AmericaLatviaLebanonLiberiaLithuaniaMalaysiaMexicoMicronesiaMiddle AfricaMoldovaMoroccoNepalNetherlandsNicaraguaNigeriaNorth AmericaNorth MacedoniaNorthern AfricaNorthern EuropeNorwayOceaniaPakistanPanamaPeruPhilippinesPolandPortugalRomaniaRussiaSaudi ArabiaScotlandSenegalSerbiaSierra LeoneSingaporeSomaliaSouth AfricaSouth AmericaSouth Central AsiaSouth Eastern AsiaSouthern EuropeSpainSri LankaSt. Vincent and the GrenadinesSudanSwedenSwitzerlandSyriaTaiwanThailandTrinidad and TobagoTurkeyUgandaUkraineUruguayUzbekistanVenezuelaVietnamWest IndiesWestern AfricaWestern AsiaWestern EuropeYemenZaireZimbabweAzores
Colombian
Race
Ancestry
AfghanAfricanAlaska NativeAlaskan AthabascanAlbanianAleutAlsatianAmericanApacheArabArapahoArgentineanArmenianAssyrian/Chaldean/SyriacAustralianAustrianBahamianBangladeshiBarbadianBasqueBelgianBelizeanBermudanBhutaneseBlackfeetBolivianBrazilianBritishBritish West IndianBulgarianBurmeseCajunCambodianCanadianCape VerdeanCarpatho RusynCentral AmericanCentral American IndianCherokeeCheyenneChickasawChileanChineseChippewaChoctawColombianColvilleComancheCosta RicanCreeCreekCroatianCrowCubanCypriotCzechCzechoslovakianDanishDelawareDominicanDutchDutch West IndianEastern EuropeanEcuadorianEgyptianEnglishEstonianEthiopianEuropeanFijianFilipinoFinnishFrenchFrench American IndianFrench CanadianGermanGerman RussianGhanaianGreekGuamanian/ChamorroGuatemalanGuyaneseHaitianHmongHonduranHopiHoumaHungarianIcelanderIndian (Asian)IndonesianInupiatIranianIraqiIrishIroquoisIsraeliItalianJamaicanJapaneseJordanianKenyanKiowaKoreanLaotianLatvianLebaneseLiberianLithuanianLumbeeLuxembourgerMacedonianMalaysianMalteseMarshalleseMenomineeMexicanMexican American IndianMongolianMoroccanNative HawaiianNavajoNepaleseNew ZealanderNicaraguanNigerianNorthern EuropeanNorwegianOkinawanOsageOttawaPaiutePakistaniPalestinianPanamanianParaguayanPennsylvania GermanPeruvianPimaPolishPortuguesePotawatomiPuebloPuerto RicanPuget Sound SalishRomanianRussianSalvadoranSamoanScandinavianScotch-IrishScottishSeminoleSenegaleseSerbianShoshoneSierra LeoneanSiouxSlavicSlovakSloveneSomaliSouth AfricanSouth AmericanSouth American IndianSoviet UnionSpaniardSpanishSpanish AmericanSpanish American IndianSri LankanSubsaharan AfricanSudaneseSwedishSwissSyrianTaiwaneseThaiTlingit-HaidaTohono O'OdhamTonganTrinidadian and TobagonianTsimshianTurkishU.S. Virgin IslanderUgandanUkrainianUruguayanUteVenezuelanVietnameseWelshWest IndianYakamaYaquiYugoslavianYumanYup'ikZimbabwean
Immigration
NonimmigrantsImmigrantsAfghanistanAfricaAlbaniaArgentinaArmeniaAsiaAustraliaAustriaBahamasBangladeshBarbadosBelarusBelgiumBelizeBoliviaBosnia and HerzegovinaBrazilBulgariaBurma/MyanmarCabo VerdeCambodiaCameroonCanadaCaribbeanCentral AmericaChileChinaColombiaCongoCosta RicaCroatiaCubaCzechoslovakiaDenmarkDominicaDominican RepublicEastern AfricaEastern AsiaEastern EuropeEcuadorEgyptEl SalvadorEnglandEritreaEthiopiaEuropeFijiFranceGermanyGhanaGreeceGrenadaGuatemalaGuyanaHaitiHondurasHong KongHungaryIndiaIndonesiaIranIraqIrelandIsraelItalyJamaicaJapanJordanKazakhstanKenyaKoreaKuwaitLaosLatin AmericaLatviaLebanonLiberiaLithuaniaMalaysiaMexicoMicronesiaMiddle AfricaMoldovaMoroccoNepalNetherlandsNicaraguaNigeriaNorth AmericaNorth MacedoniaNorthern AfricaNorthern EuropeNorwayOceaniaPakistanPanamaPeruPhilippinesPolandPortugalRomaniaRussiaSaudi ArabiaScotlandSenegalSerbiaSierra LeoneSingaporeSomaliaSouth AfricaSouth AmericaSouth Central AsiaSouth Eastern AsiaSouthern EuropeSpainSri LankaSt. Vincent and the GrenadinesSudanSwedenSwitzerlandSyriaTaiwanThailandTrinidad and TobagoTurkeyUgandaUkraineUruguayUzbekistanVenezuelaVietnamWest IndiesWestern AfricaWestern AsiaWestern EuropeYemenZaireZimbabweAzores
GED/Equivalency
Income
Poverty
Unemployment
Labor Participation
Family Structure
Vehicle Availability
Education Level
Disability

GED/Equivalency Comparison

Celtics

Colombians

Exceptional
Poor
86.7%
GED/EQUIVALENCY
90.4/ 100
METRIC RATING
125th/ 347
METRIC RANK
84.9%
GED/EQUIVALENCY
12.3/ 100
METRIC RATING
209th/ 347
METRIC RANK

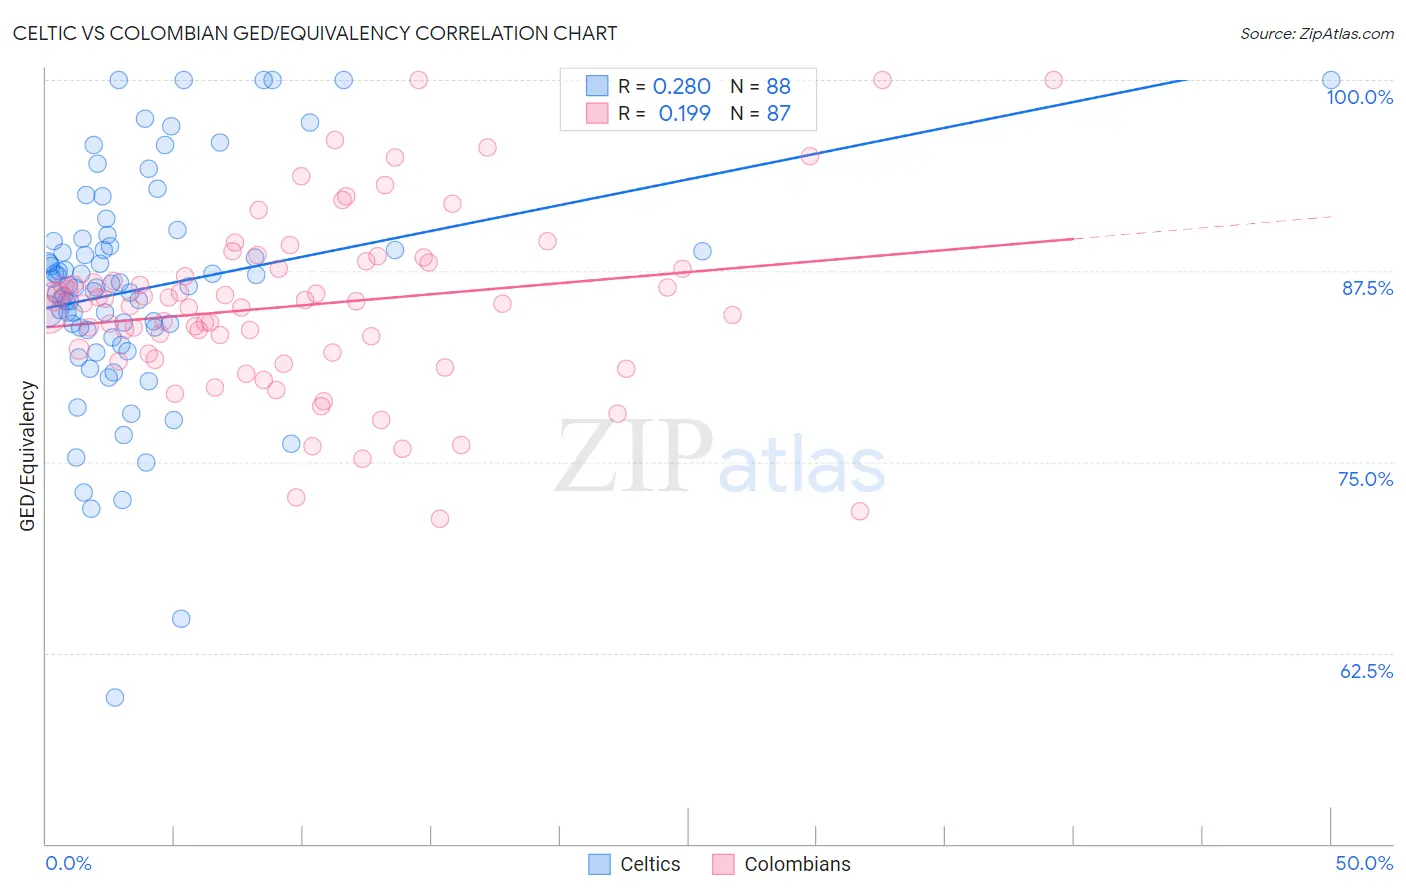
Celtic vs Colombian GED/Equivalency Correlation Chart

The statistical analysis conducted on geographies consisting of 168,876,981 people shows a weak positive correlation between the proportion of Celtics and percentage of population with at least ged/equivalency education in the United States with a correlation coefficient (R) of 0.280 and weighted average of 86.7%. Similarly, the statistical analysis conducted on geographies consisting of 419,701,153 people shows a poor positive correlation between the proportion of Colombians and percentage of population with at least ged/equivalency education in the United States with a correlation coefficient (R) of 0.199 and weighted average of 84.9%, a difference of 2.2%.
Celtic vs Colombian GED/Equivalency

GED/Equivalency Correlation Summary

MeasurementCelticColombian
Minimum59.6%71.3%
Maximum100.0%100.0%
Range40.4%28.7%
Mean86.4%85.3%
Median86.5%85.4%
Interquartile 25% (IQ1)83.7%82.1%
Interquartile 75% (IQ3)89.3%88.1%
Interquartile Range (IQR)5.6%6.0%
Standard Deviation (Sample)7.4%5.8%
Standard Deviation (Population)7.4%5.8%

Similar Demographics by GED/Equivalency

Demographics Similar to Celtics by GED/Equivalency

In terms of ged/equivalency, the demographic groups most similar to Celtics are Immigrants from Egypt (86.7%, a difference of 0.0%), Immigrants from Italy (86.7%, a difference of 0.010%), Asian (86.7%, a difference of 0.010%), Immigrants from Lebanon (86.8%, a difference of 0.030%), and Immigrants from Jordan (86.8%, a difference of 0.030%).
DemographicsRating | RankGED/Equivalency
French Canadians
93.2
/100
|
#118
Exceptional
86.9%
Immigrants | China
93.2
/100
|
#119
Exceptional
86.9%
Scotch-Irish
91.6
/100
|
#120
Exceptional
86.8%
Immigrants | Lebanon
90.9
/100
|
#121
Exceptional
86.8%
Immigrants | Jordan
90.8
/100
|
#122
Exceptional
86.8%
Immigrants | Italy
90.5
/100
|
#123
Exceptional
86.7%
Immigrants | Egypt
90.4
/100
|
#124
Exceptional
86.7%
Celtics
90.4
/100
|
#125
Exceptional
86.7%
Asians
90.3
/100
|
#126
Exceptional
86.7%
Argentineans
89.7
/100
|
#127
Excellent
86.7%
Yugoslavians
89.5
/100
|
#128
Excellent
86.7%
Immigrants | Ukraine
88.9
/100
|
#129
Excellent
86.7%
Immigrants | Germany
88.8
/100
|
#130
Excellent
86.7%
Immigrants | Spain
88.5
/100
|
#131
Excellent
86.7%
Immigrants | Brazil
88.4
/100
|
#132
Excellent
86.6%

Demographics Similar to Colombians by GED/Equivalency

In terms of ged/equivalency, the demographic groups most similar to Colombians are Marshallese (84.9%, a difference of 0.010%), Immigrants from Cameroon (84.9%, a difference of 0.010%), Hmong (84.9%, a difference of 0.040%), Samoan (84.9%, a difference of 0.060%), and South American (84.8%, a difference of 0.070%).
DemographicsRating | RankGED/Equivalency
Cree
15.9
/100
|
#202
Poor
85.0%
Panamanians
15.3
/100
|
#203
Poor
85.0%
Hawaiians
15.2
/100
|
#204
Poor
85.0%
Liberians
14.6
/100
|
#205
Poor
85.0%
Samoans
13.7
/100
|
#206
Poor
84.9%
Hmong
13.1
/100
|
#207
Poor
84.9%
Marshallese
12.5
/100
|
#208
Poor
84.9%
Colombians
12.3
/100
|
#209
Poor
84.9%
Immigrants | Cameroon
12.1
/100
|
#210
Poor
84.9%
South Americans
10.9
/100
|
#211
Poor
84.8%
Immigrants | Somalia
10.6
/100
|
#212
Poor
84.8%
Immigrants | Philippines
10.0
/100
|
#213
Poor
84.8%
Osage
9.5
/100
|
#214
Tragic
84.8%
Peruvians
9.2
/100
|
#215
Tragic
84.7%
Immigrants | Micronesia
8.7
/100
|
#216
Tragic
84.7%