Immigrants from Vietnam vs Immigrants from Chile Self-Care Disability

COMPARE

Immigrants from Vietnam
Race
Ancestry
AfghanAfricanAlaska NativeAlaskan AthabascanAlbanianAleutAlsatianAmericanApacheArabArapahoArgentineanArmenianAssyrian/Chaldean/SyriacAustralianAustrianBahamianBangladeshiBarbadianBasqueBelgianBelizeanBermudanBhutaneseBlackfeetBolivianBrazilianBritishBritish West IndianBulgarianBurmeseCajunCambodianCanadianCape VerdeanCarpatho RusynCelticCentral AmericanCentral American IndianCherokeeCheyenneChickasawChileanChineseChippewaChoctawColombianColvilleComancheCosta RicanCreeCreekCroatianCrowCubanCypriotCzechCzechoslovakianDanishDelawareDominicanDutchDutch West IndianEastern EuropeanEcuadorianEgyptianEnglishEstonianEthiopianEuropeanFijianFilipinoFinnishFrenchFrench American IndianFrench CanadianGermanGerman RussianGhanaianGreekGuamanian/ChamorroGuatemalanGuyaneseHaitianHmongHonduranHopiHoumaHungarianIcelanderIndian (Asian)IndonesianInupiatIranianIraqiIrishIroquoisIsraeliItalianJamaicanJapaneseJordanianKenyanKiowaKoreanLaotianLatvianLebaneseLiberianLithuanianLumbeeLuxembourgerMacedonianMalaysianMalteseMarshalleseMenomineeMexicanMexican American IndianMongolianMoroccanNative HawaiianNavajoNepaleseNew ZealanderNicaraguanNigerianNorthern EuropeanNorwegianOkinawanOsageOttawaPaiutePakistaniPalestinianPanamanianParaguayanPennsylvania GermanPeruvianPimaPolishPortuguesePotawatomiPuebloPuerto RicanPuget Sound SalishRomanianRussianSalvadoranSamoanScandinavianScotch-IrishScottishSeminoleSenegaleseSerbianShoshoneSierra LeoneanSiouxSlavicSlovakSloveneSomaliSouth AfricanSouth AmericanSouth American IndianSoviet UnionSpaniardSpanishSpanish AmericanSpanish American IndianSri LankanSubsaharan AfricanSudaneseSwedishSwissSyrianTaiwaneseThaiTlingit-HaidaTohono O'OdhamTonganTrinidadian and TobagonianTsimshianTurkishU.S. Virgin IslanderUgandanUkrainianUruguayanUteVenezuelanVietnameseWelshWest IndianYakamaYaquiYugoslavianYumanYup'ikZimbabwean
Immigration
NonimmigrantsImmigrantsAfghanistanAfricaAlbaniaArgentinaArmeniaAsiaAustraliaAustriaBahamasBangladeshBarbadosBelarusBelgiumBelizeBoliviaBosnia and HerzegovinaBrazilBulgariaBurma/MyanmarCabo VerdeCambodiaCameroonCanadaCaribbeanCentral AmericaChinaColombiaCongoCosta RicaCroatiaCubaCzechoslovakiaDenmarkDominicaDominican RepublicEastern AfricaEastern AsiaEastern EuropeEcuadorEgyptEl SalvadorEnglandEritreaEthiopiaEuropeFijiFranceGermanyGhanaGreeceGrenadaGuatemalaGuyanaHaitiHondurasHong KongHungaryIndiaIndonesiaIranIraqIrelandIsraelItalyJamaicaJapanJordanKazakhstanKenyaKoreaKuwaitLaosLatin AmericaLatviaLebanonLiberiaLithuaniaMalaysiaMexicoMicronesiaMiddle AfricaMoldovaMoroccoNepalNetherlandsNicaraguaNigeriaNorth AmericaNorth MacedoniaNorthern AfricaNorthern EuropeNorwayOceaniaPakistanPanamaPeruPhilippinesPolandPortugalRomaniaRussiaSaudi ArabiaScotlandSenegalSerbiaSierra LeoneSingaporeSomaliaSouth AfricaSouth AmericaSouth Central AsiaSouth Eastern AsiaSouthern EuropeSpainSri LankaSt. Vincent and the GrenadinesSudanSwedenSwitzerlandSyriaTaiwanThailandTrinidad and TobagoTurkeyUgandaUkraineUruguayUzbekistanVenezuelaVietnamWest IndiesWestern AfricaWestern AsiaWestern EuropeYemenZaireZimbabweAzores
Immigrants from Chile
Race
Ancestry
AfghanAfricanAlaska NativeAlaskan AthabascanAlbanianAleutAlsatianAmericanApacheArabArapahoArgentineanArmenianAssyrian/Chaldean/SyriacAustralianAustrianBahamianBangladeshiBarbadianBasqueBelgianBelizeanBermudanBhutaneseBlackfeetBolivianBrazilianBritishBritish West IndianBulgarianBurmeseCajunCambodianCanadianCape VerdeanCarpatho RusynCelticCentral AmericanCentral American IndianCherokeeCheyenneChickasawChileanChineseChippewaChoctawColombianColvilleComancheCosta RicanCreeCreekCroatianCrowCubanCypriotCzechCzechoslovakianDanishDelawareDominicanDutchDutch West IndianEastern EuropeanEcuadorianEgyptianEnglishEstonianEthiopianEuropeanFijianFilipinoFinnishFrenchFrench American IndianFrench CanadianGermanGerman RussianGhanaianGreekGuamanian/ChamorroGuatemalanGuyaneseHaitianHmongHonduranHopiHoumaHungarianIcelanderIndian (Asian)IndonesianInupiatIranianIraqiIrishIroquoisIsraeliItalianJamaicanJapaneseJordanianKenyanKiowaKoreanLaotianLatvianLebaneseLiberianLithuanianLumbeeLuxembourgerMacedonianMalaysianMalteseMarshalleseMenomineeMexicanMexican American IndianMongolianMoroccanNative HawaiianNavajoNepaleseNew ZealanderNicaraguanNigerianNorthern EuropeanNorwegianOkinawanOsageOttawaPaiutePakistaniPalestinianPanamanianParaguayanPennsylvania GermanPeruvianPimaPolishPortuguesePotawatomiPuebloPuerto RicanPuget Sound SalishRomanianRussianSalvadoranSamoanScandinavianScotch-IrishScottishSeminoleSenegaleseSerbianShoshoneSierra LeoneanSiouxSlavicSlovakSloveneSomaliSouth AfricanSouth AmericanSouth American IndianSoviet UnionSpaniardSpanishSpanish AmericanSpanish American IndianSri LankanSubsaharan AfricanSudaneseSwedishSwissSyrianTaiwaneseThaiTlingit-HaidaTohono O'OdhamTonganTrinidadian and TobagonianTsimshianTurkishU.S. Virgin IslanderUgandanUkrainianUruguayanUteVenezuelanVietnameseWelshWest IndianYakamaYaquiYugoslavianYumanYup'ikZimbabwean
Immigration
NonimmigrantsImmigrantsAfghanistanAfricaAlbaniaArgentinaArmeniaAsiaAustraliaAustriaBahamasBangladeshBarbadosBelarusBelgiumBelizeBoliviaBosnia and HerzegovinaBrazilBulgariaBurma/MyanmarCabo VerdeCambodiaCameroonCanadaCaribbeanCentral AmericaChileChinaColombiaCongoCosta RicaCroatiaCubaCzechoslovakiaDenmarkDominicaDominican RepublicEastern AfricaEastern AsiaEastern EuropeEcuadorEgyptEl SalvadorEnglandEritreaEthiopiaEuropeFijiFranceGermanyGhanaGreeceGrenadaGuatemalaGuyanaHaitiHondurasHong KongHungaryIndiaIndonesiaIranIraqIrelandIsraelItalyJamaicaJapanJordanKazakhstanKenyaKoreaKuwaitLaosLatin AmericaLatviaLebanonLiberiaLithuaniaMalaysiaMexicoMicronesiaMiddle AfricaMoldovaMoroccoNepalNetherlandsNicaraguaNigeriaNorth AmericaNorth MacedoniaNorthern AfricaNorthern EuropeNorwayOceaniaPakistanPanamaPeruPhilippinesPolandPortugalRomaniaRussiaSaudi ArabiaScotlandSenegalSerbiaSierra LeoneSingaporeSomaliaSouth AfricaSouth AmericaSouth Central AsiaSouth Eastern AsiaSouthern EuropeSpainSri LankaSt. Vincent and the GrenadinesSudanSwedenSwitzerlandSyriaTaiwanThailandTrinidad and TobagoTurkeyUgandaUkraineUruguayUzbekistanVenezuelaWest IndiesWestern AfricaWestern AsiaWestern EuropeYemenZaireZimbabweAzores
Self-Care Disability
Income
Poverty
Unemployment
Labor Participation
Family Structure
Vehicle Availability
Education Level
Disability

Self-Care Disability Comparison

Immigrants from Vietnam

Immigrants from Chile

Average
Exceptional
2.5%
SELF-CARE DISABILITY
59.3/ 100
METRIC RATING
164th/ 347
METRIC RANK
2.4%
SELF-CARE DISABILITY
96.7/ 100
METRIC RATING
96th/ 347
METRIC RANK

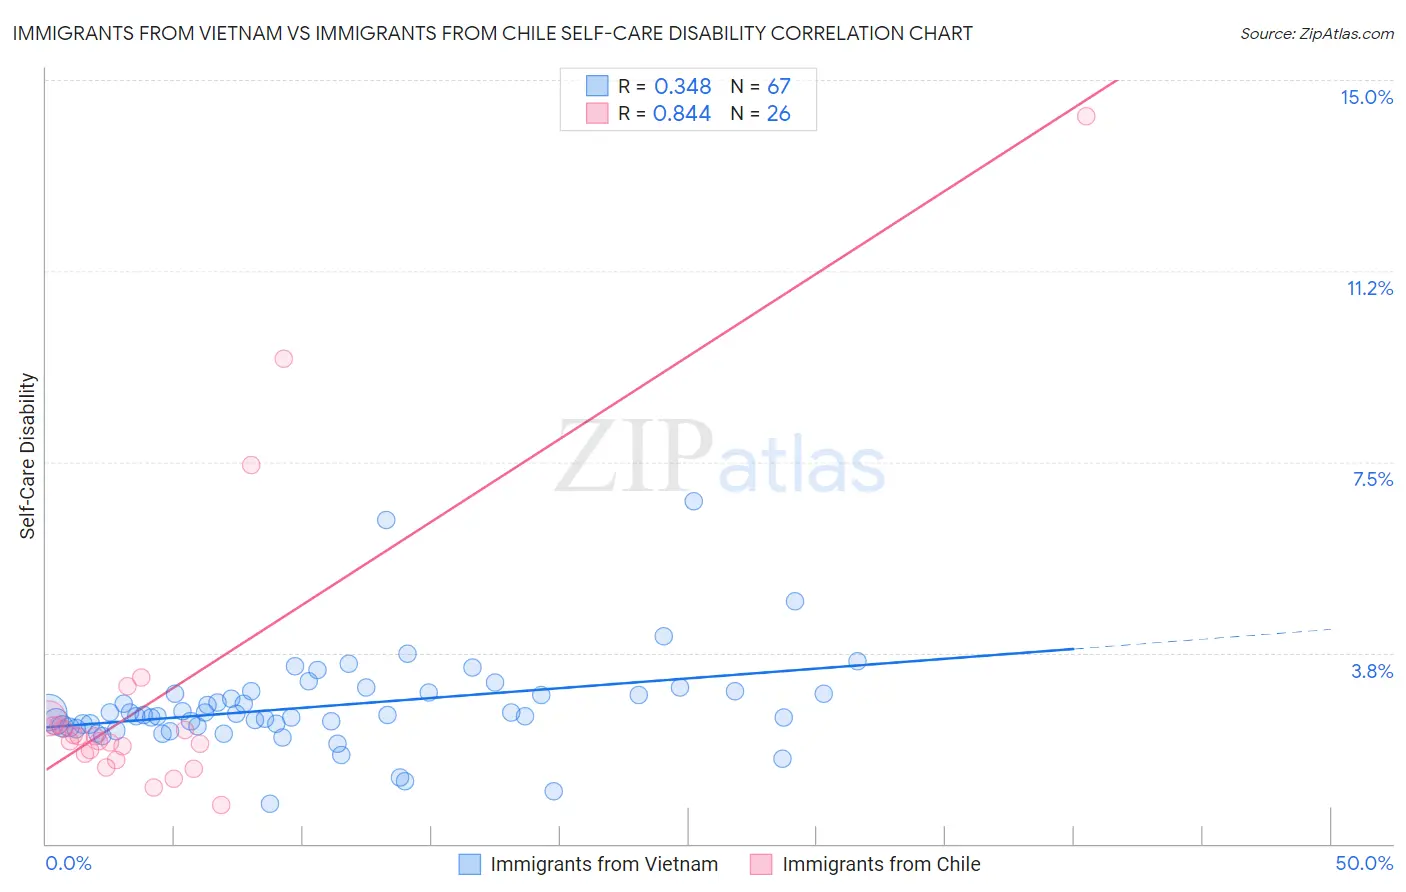
Immigrants from Vietnam vs Immigrants from Chile Self-Care Disability Correlation Chart

The statistical analysis conducted on geographies consisting of 404,358,280 people shows a mild positive correlation between the proportion of Immigrants from Vietnam and percentage of population with self-care disability in the United States with a correlation coefficient (R) of 0.348 and weighted average of 2.5%. Similarly, the statistical analysis conducted on geographies consisting of 218,576,088 people shows a very strong positive correlation between the proportion of Immigrants from Chile and percentage of population with self-care disability in the United States with a correlation coefficient (R) of 0.844 and weighted average of 2.4%, a difference of 3.7%.
Immigrants from Vietnam vs Immigrants from Chile Self-Care Disability

Self-Care Disability Correlation Summary

MeasurementImmigrants from VietnamImmigrants from Chile
Minimum0.78%0.76%
Maximum6.7%14.3%
Range5.9%13.5%
Mean2.7%3.0%
Median2.5%2.1%
Interquartile 25% (IQ1)2.3%1.8%
Interquartile 75% (IQ3)3.0%2.3%
Interquartile Range (IQR)0.66%0.58%
Standard Deviation (Sample)0.94%3.0%
Standard Deviation (Population)0.93%2.9%

Similar Demographics by Self-Care Disability

Demographics Similar to Immigrants from Vietnam by Self-Care Disability

In terms of self-care disability, the demographic groups most similar to Immigrants from Vietnam are Syrian (2.5%, a difference of 0.020%), Canadian (2.5%, a difference of 0.030%), Immigrants from Greece (2.5%, a difference of 0.10%), Ute (2.5%, a difference of 0.11%), and German Russian (2.5%, a difference of 0.17%).
DemographicsRating | RankSelf-Care Disability
Immigrants | Europe
69.6
/100
|
#157
Good
2.4%
Immigrants | Western Europe
68.6
/100
|
#158
Good
2.4%
Immigrants | Italy
68.5
/100
|
#159
Good
2.4%
Finns
67.0
/100
|
#160
Good
2.4%
Lebanese
66.5
/100
|
#161
Good
2.4%
Somalis
63.7
/100
|
#162
Good
2.5%
German Russians
62.7
/100
|
#163
Good
2.5%
Immigrants | Vietnam
59.3
/100
|
#164
Average
2.5%
Syrians
59.0
/100
|
#165
Average
2.5%
Canadians
58.8
/100
|
#166
Average
2.5%
Immigrants | Greece
57.3
/100
|
#167
Average
2.5%
Ute
57.1
/100
|
#168
Average
2.5%
Immigrants | Somalia
55.9
/100
|
#169
Average
2.5%
Scottish
54.3
/100
|
#170
Average
2.5%
Pennsylvania Germans
53.5
/100
|
#171
Average
2.5%

Demographics Similar to Immigrants from Chile by Self-Care Disability

In terms of self-care disability, the demographic groups most similar to Immigrants from Chile are Swiss (2.4%, a difference of 0.040%), Immigrants from Asia (2.4%, a difference of 0.060%), Macedonian (2.4%, a difference of 0.070%), Immigrants from Latvia (2.4%, a difference of 0.11%), and Immigrants from Poland (2.4%, a difference of 0.14%).
DemographicsRating | RankSelf-Care Disability
Immigrants | Congo
98.0
/100
|
#89
Exceptional
2.4%
Immigrants | Czechoslovakia
97.7
/100
|
#90
Exceptional
2.4%
Immigrants | Jordan
97.7
/100
|
#91
Exceptional
2.4%
Icelanders
97.4
/100
|
#92
Exceptional
2.4%
Immigrants | Latvia
97.0
/100
|
#93
Exceptional
2.4%
Macedonians
96.9
/100
|
#94
Exceptional
2.4%
Immigrants | Asia
96.9
/100
|
#95
Exceptional
2.4%
Immigrants | Chile
96.7
/100
|
#96
Exceptional
2.4%
Swiss
96.6
/100
|
#97
Exceptional
2.4%
Immigrants | Poland
96.4
/100
|
#98
Exceptional
2.4%
Immigrants | Israel
96.1
/100
|
#99
Exceptional
2.4%
Europeans
95.8
/100
|
#100
Exceptional
2.4%
Immigrants | Scotland
95.7
/100
|
#101
Exceptional
2.4%
Croatians
95.0
/100
|
#102
Exceptional
2.4%
Alsatians
94.9
/100
|
#103
Exceptional
2.4%