San Buenaventura Ventura, CA
San Buenaventura Ventura Map
San Buenaventura Ventura Overview
110,358
TOTAL POPULATION
55,277
MALE POPULATION
55,081
FEMALE POPULATION
100.36
MALES / 100 FEMALES
99.65
FEMALES / 100 MALES
41.3
MEDIAN AGE
3.1
AVG FAMILY SIZE
2.6
AVG HOUSEHOLD SIZE
$46,562
PER CAPITA INCOME
$112,232
AVG FAMILY INCOME
$96,036
AVG HOUSEHOLD INCOME
22.5%
WAGE / INCOME GAP [ % ]
77.5¢/ $1
WAGE / INCOME GAP [ $ ]
$10,504
FAMILY INCOME DEFICIT
0.43
INEQUALITY / GINI INDEX
58,144
LABOR FORCE [ PEOPLE ]
63.9%
PERCENT IN LABOR FORCE
4.9%
UNEMPLOYMENT RATE
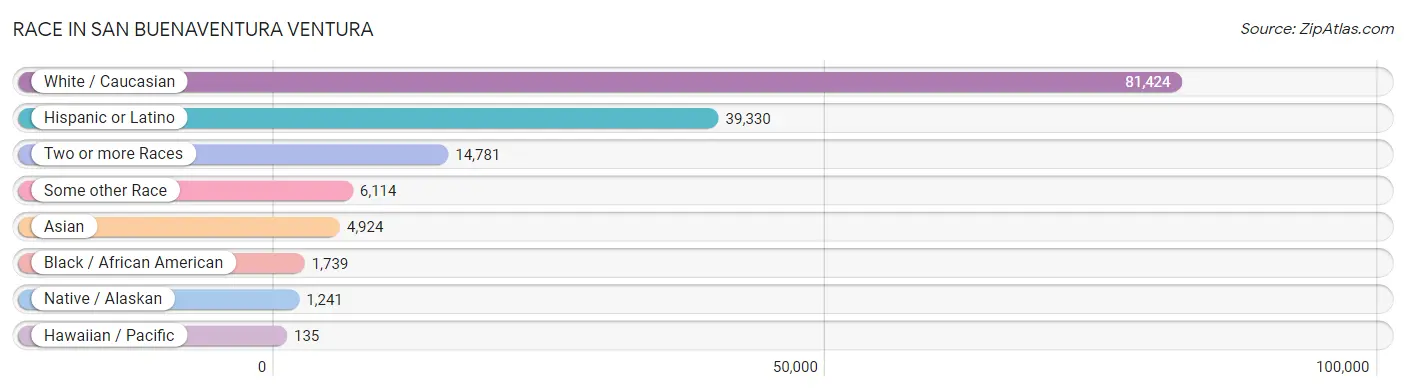
Race in San Buenaventura Ventura
The most populous races in San Buenaventura Ventura are White / Caucasian (81,424 | 73.8%), Hispanic or Latino (39,330 | 35.6%), and Two or more Races (14,781 | 13.4%).
| Race | # Population | % Population |
| Asian | 4,924 | 4.5% |
| Black / African American | 1,739 | 1.6% |
| Hawaiian / Pacific | 135 | 0.1% |
| Hispanic or Latino | 39,330 | 35.6% |
| Native / Alaskan | 1,241 | 1.1% |
| White / Caucasian | 81,424 | 73.8% |
| Two or more Races | 14,781 | 13.4% |
| Some other Race | 6,114 | 5.5% |
| Total | 110,358 | 100.0% |
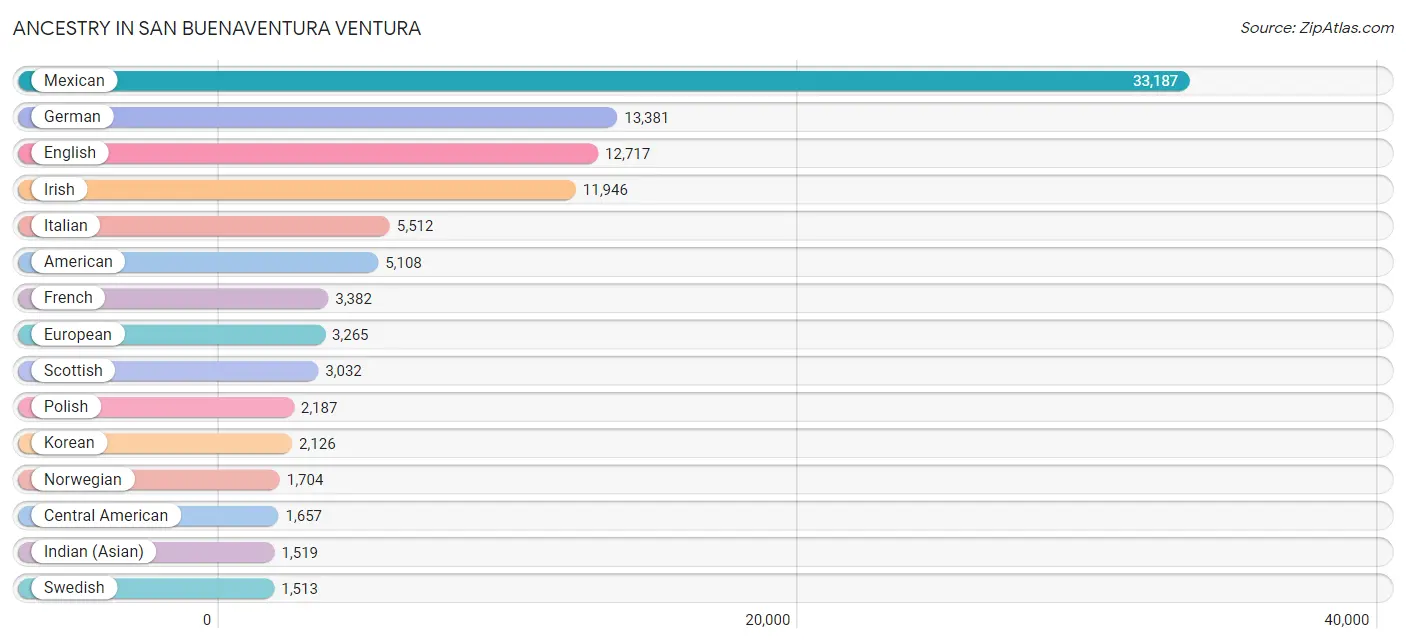
Ancestry in San Buenaventura Ventura
The most populous ancestries reported in San Buenaventura Ventura are Mexican (33,187 | 30.1%), German (13,381 | 12.1%), English (12,717 | 11.5%), Irish (11,946 | 10.8%), and Italian (5,512 | 5.0%), together accounting for 69.5% of all San Buenaventura Ventura residents.
| Ancestry | # Population | % Population |
| African | 21 | 0.0% |
| Albanian | 80 | 0.1% |
| American | 5,108 | 4.6% |
| Apache | 123 | 0.1% |
| Arab | 964 | 0.9% |
| Argentinean | 61 | 0.1% |
| Armenian | 169 | 0.2% |
| Australian | 12 | 0.0% |
| Austrian | 196 | 0.2% |
| Bangladeshi | 56 | 0.1% |
| Barbadian | 61 | 0.1% |
| Basque | 74 | 0.1% |
| Belgian | 166 | 0.2% |
| Bhutanese | 937 | 0.9% |
| Blackfeet | 150 | 0.1% |
| Brazilian | 72 | 0.1% |
| British | 606 | 0.5% |
| Bulgarian | 22 | 0.0% |
| Burmese | 642 | 0.6% |
| Canadian | 272 | 0.3% |
| Carpatho Rusyn | 11 | 0.0% |
| Celtic | 8 | 0.0% |
| Central American | 1,657 | 1.5% |
| Central American Indian | 175 | 0.2% |
| Cherokee | 603 | 0.5% |
| Chickasaw | 41 | 0.0% |
| Chilean | 307 | 0.3% |
| Chinese | 8 | 0.0% |
| Chippewa | 42 | 0.0% |
| Choctaw | 123 | 0.1% |
| Colombian | 294 | 0.3% |
| Comanche | 21 | 0.0% |
| Costa Rican | 26 | 0.0% |
| Creek | 22 | 0.0% |
| Croatian | 53 | 0.1% |
| Cuban | 255 | 0.2% |
| Czech | 495 | 0.4% |
| Czechoslovakian | 146 | 0.1% |
| Danish | 582 | 0.5% |
| Dominican | 29 | 0.0% |
| Dutch | 1,446 | 1.3% |
| Eastern European | 421 | 0.4% |
| Ecuadorian | 260 | 0.2% |
| Egyptian | 169 | 0.2% |
| English | 12,717 | 11.5% |
| European | 3,265 | 3.0% |
| Filipino | 90 | 0.1% |
| Finnish | 748 | 0.7% |
| French | 3,382 | 3.1% |
| French Canadian | 405 | 0.4% |
| German | 13,381 | 12.1% |
| German Russian | 3 | 0.0% |
| Greek | 573 | 0.5% |
| Guamanian / Chamorro | 38 | 0.0% |
| Guatemalan | 154 | 0.1% |
| Honduran | 9 | 0.0% |
| Hopi | 24 | 0.0% |
| Hungarian | 368 | 0.3% |
| Icelander | 55 | 0.1% |
| Indian (Asian) | 1,519 | 1.4% |
| Indonesian | 6 | 0.0% |
| Inupiat | 68 | 0.1% |
| Iranian | 678 | 0.6% |
| Irish | 11,946 | 10.8% |
| Iroquois | 37 | 0.0% |
| Israeli | 63 | 0.1% |
| Italian | 5,512 | 5.0% |
| Jamaican | 14 | 0.0% |
| Japanese | 45 | 0.0% |
| Jordanian | 9 | 0.0% |
| Korean | 2,126 | 1.9% |
| Laotian | 47 | 0.0% |
| Latvian | 131 | 0.1% |
| Lebanese | 166 | 0.2% |
| Lithuanian | 315 | 0.3% |
| Malaysian | 33 | 0.0% |
| Maltese | 21 | 0.0% |
| Mexican | 33,187 | 30.1% |
| Mexican American Indian | 309 | 0.3% |
| Moroccan | 21 | 0.0% |
| Native Hawaiian | 165 | 0.2% |
| Navajo | 25 | 0.0% |
| Nepalese | 2 | 0.0% |
| Nicaraguan | 85 | 0.1% |
| Nigerian | 45 | 0.0% |
| Northern European | 219 | 0.2% |
| Norwegian | 1,704 | 1.5% |
| Osage | 52 | 0.1% |
| Paiute | 23 | 0.0% |
| Pakistani | 176 | 0.2% |
| Palestinian | 6 | 0.0% |
| Panamanian | 225 | 0.2% |
| Pennsylvania German | 172 | 0.2% |
| Peruvian | 210 | 0.2% |
| Pima | 3 | 0.0% |
| Polish | 2,187 | 2.0% |
| Portuguese | 517 | 0.5% |
| Potawatomi | 18 | 0.0% |
| Pueblo | 70 | 0.1% |
| Puerto Rican | 722 | 0.6% |
| Romanian | 137 | 0.1% |
| Russian | 1,422 | 1.3% |
| Salvadoran | 1,158 | 1.1% |
| Samoan | 62 | 0.1% |
| Scandinavian | 572 | 0.5% |
| Scotch-Irish | 1,381 | 1.3% |
| Scottish | 3,032 | 2.8% |
| Serbian | 48 | 0.0% |
| Sioux | 41 | 0.0% |
| Slavic | 39 | 0.0% |
| Slovak | 139 | 0.1% |
| Slovene | 22 | 0.0% |
| South African | 65 | 0.1% |
| South American | 1,157 | 1.1% |
| Spaniard | 583 | 0.5% |
| Spanish | 1,078 | 1.0% |
| Spanish American Indian | 126 | 0.1% |
| Sri Lankan | 514 | 0.5% |
| Subsaharan African | 131 | 0.1% |
| Swedish | 1,513 | 1.4% |
| Swiss | 385 | 0.4% |
| Syrian | 356 | 0.3% |
| Thai | 804 | 0.7% |
| Tohono O'Odham | 46 | 0.0% |
| Tongan | 47 | 0.0% |
| Trinidadian and Tobagonian | 9 | 0.0% |
| Turkish | 121 | 0.1% |
| Ukrainian | 330 | 0.3% |
| Venezuelan | 25 | 0.0% |
| Welsh | 812 | 0.7% |
| West Indian | 26 | 0.0% |
| Yaqui | 29 | 0.0% |
| Yugoslavian | 144 | 0.1% | View All 133 Rows |
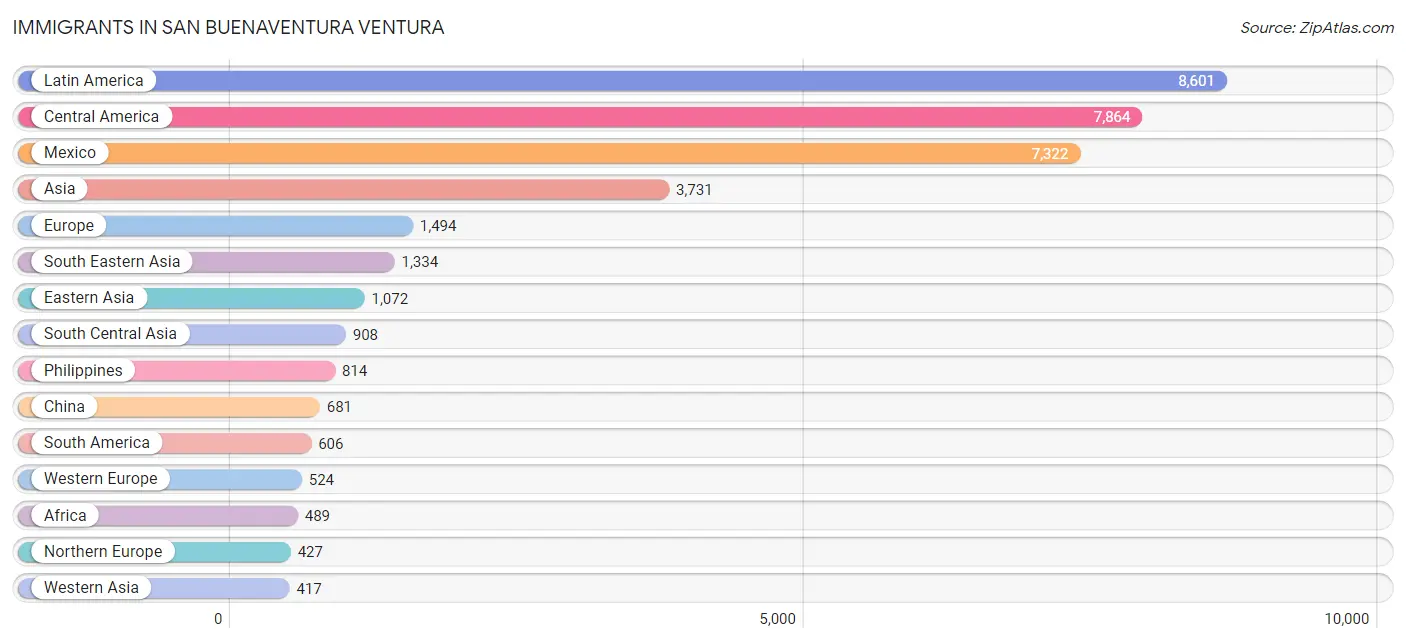
Immigrants in San Buenaventura Ventura
The most numerous immigrant groups reported in San Buenaventura Ventura came from Latin America (8,601 | 7.8%), Central America (7,864 | 7.1%), Mexico (7,322 | 6.6%), Asia (3,731 | 3.4%), and Europe (1,494 | 1.3%), together accounting for 26.3% of all San Buenaventura Ventura residents.
| Immigration Origin | # Population | % Population |
| Africa | 489 | 0.4% |
| Albania | 51 | 0.1% |
| Argentina | 91 | 0.1% |
| Armenia | 3 | 0.0% |
| Asia | 3,731 | 3.4% |
| Australia | 27 | 0.0% |
| Barbados | 12 | 0.0% |
| Belize | 12 | 0.0% |
| Brazil | 37 | 0.0% |
| Bulgaria | 22 | 0.0% |
| Cambodia | 32 | 0.0% |
| Canada | 378 | 0.3% |
| Caribbean | 131 | 0.1% |
| Central America | 7,864 | 7.1% |
| Chile | 101 | 0.1% |
| China | 681 | 0.6% |
| Colombia | 312 | 0.3% |
| Costa Rica | 15 | 0.0% |
| Cuba | 20 | 0.0% |
| Czechoslovakia | 25 | 0.0% |
| Eastern Africa | 42 | 0.0% |
| Eastern Asia | 1,072 | 1.0% |
| Eastern Europe | 406 | 0.4% |
| Ecuador | 15 | 0.0% |
| Egypt | 279 | 0.3% |
| El Salvador | 367 | 0.3% |
| England | 184 | 0.2% |
| Europe | 1,494 | 1.3% |
| Fiji | 17 | 0.0% |
| France | 75 | 0.1% |
| Germany | 285 | 0.3% |
| Guatemala | 92 | 0.1% |
| Haiti | 24 | 0.0% |
| Hong Kong | 92 | 0.1% |
| Hungary | 36 | 0.0% |
| India | 371 | 0.3% |
| Indonesia | 9 | 0.0% |
| Iran | 209 | 0.2% |
| Ireland | 45 | 0.0% |
| Israel | 41 | 0.0% |
| Italy | 75 | 0.1% |
| Jamaica | 68 | 0.1% |
| Japan | 123 | 0.1% |
| Jordan | 28 | 0.0% |
| Korea | 268 | 0.2% |
| Laos | 29 | 0.0% |
| Latin America | 8,601 | 7.8% |
| Latvia | 32 | 0.0% |
| Lebanon | 32 | 0.0% |
| Lithuania | 65 | 0.1% |
| Malaysia | 8 | 0.0% |
| Mexico | 7,322 | 6.6% |
| Morocco | 33 | 0.0% |
| Nepal | 47 | 0.0% |
| Netherlands | 154 | 0.1% |
| Nicaragua | 44 | 0.0% |
| Nigeria | 37 | 0.0% |
| Northern Africa | 312 | 0.3% |
| Northern Europe | 427 | 0.4% |
| Oceania | 123 | 0.1% |
| Pakistan | 142 | 0.1% |
| Panama | 12 | 0.0% |
| Peru | 25 | 0.0% |
| Philippines | 814 | 0.7% |
| Poland | 13 | 0.0% |
| Portugal | 13 | 0.0% |
| Romania | 94 | 0.1% |
| Russia | 68 | 0.1% |
| Scotland | 32 | 0.0% |
| South Africa | 98 | 0.1% |
| South America | 606 | 0.5% |
| South Central Asia | 908 | 0.8% |
| South Eastern Asia | 1,334 | 1.2% |
| Southern Europe | 137 | 0.1% |
| Spain | 49 | 0.0% |
| Sri Lanka | 131 | 0.1% |
| Sweden | 66 | 0.1% |
| Switzerland | 10 | 0.0% |
| Syria | 312 | 0.3% |
| Taiwan | 86 | 0.1% |
| Thailand | 86 | 0.1% |
| Uganda | 6 | 0.0% |
| Uzbekistan | 8 | 0.0% |
| Venezuela | 25 | 0.0% |
| Vietnam | 350 | 0.3% |
| Western Africa | 37 | 0.0% |
| Western Asia | 417 | 0.4% |
| Western Europe | 524 | 0.5% |
| Zimbabwe | 19 | 0.0% | View All 89 Rows |
Sex and Age in San Buenaventura Ventura
Sex and Age in San Buenaventura Ventura
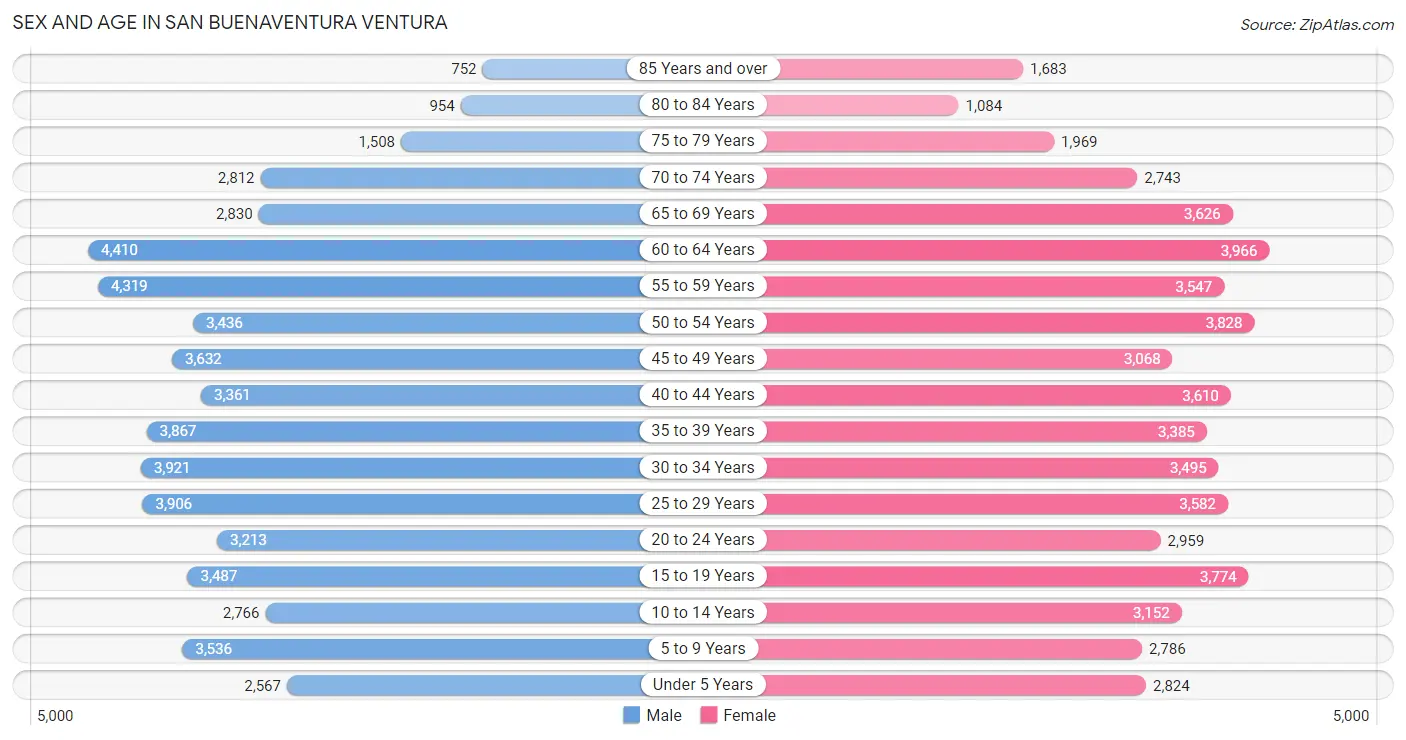
The most populous age groups in San Buenaventura Ventura are 60 to 64 Years (4,410 | 8.0%) for men and 60 to 64 Years (3,966 | 7.2%) for women.
| Age Bracket | Male | Female |
| Under 5 Years | 2,567 (4.6%) | 2,824 (5.1%) |
| 5 to 9 Years | 3,536 (6.4%) | 2,786 (5.1%) |
| 10 to 14 Years | 2,766 (5.0%) | 3,152 (5.7%) |
| 15 to 19 Years | 3,487 (6.3%) | 3,774 (6.9%) |
| 20 to 24 Years | 3,213 (5.8%) | 2,959 (5.4%) |
| 25 to 29 Years | 3,906 (7.1%) | 3,582 (6.5%) |
| 30 to 34 Years | 3,921 (7.1%) | 3,495 (6.4%) |
| 35 to 39 Years | 3,867 (7.0%) | 3,385 (6.1%) |
| 40 to 44 Years | 3,361 (6.1%) | 3,610 (6.6%) |
| 45 to 49 Years | 3,632 (6.6%) | 3,068 (5.6%) |
| 50 to 54 Years | 3,436 (6.2%) | 3,828 (7.0%) |
| 55 to 59 Years | 4,319 (7.8%) | 3,547 (6.4%) |
| 60 to 64 Years | 4,410 (8.0%) | 3,966 (7.2%) |
| 65 to 69 Years | 2,830 (5.1%) | 3,626 (6.6%) |
| 70 to 74 Years | 2,812 (5.1%) | 2,743 (5.0%) |
| 75 to 79 Years | 1,508 (2.7%) | 1,969 (3.6%) |
| 80 to 84 Years | 954 (1.7%) | 1,084 (2.0%) |
| 85 Years and over | 752 (1.4%) | 1,683 (3.1%) |
| Total | 55,277 (100.0%) | 55,081 (100.0%) |
Families and Households in San Buenaventura Ventura
Median Family Size in San Buenaventura Ventura
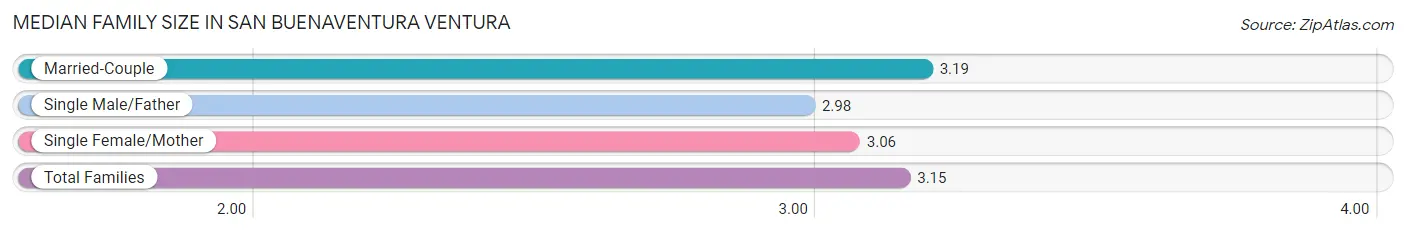
The median family size in San Buenaventura Ventura is 3.15 persons per family, with married-couple families (20,195 | 75.2%) accounting for the largest median family size of 3.19 persons per family. On the other hand, single male/father families (2,209 | 8.2%) represent the smallest median family size with 2.98 persons per family.
| Family Type | # Families | Family Size |
| Married-Couple | 20,195 (75.2%) | 3.19 |
| Single Male/Father | 2,209 (8.2%) | 2.98 |
| Single Female/Mother | 4,446 (16.6%) | 3.06 |
| Total Families | 26,850 (100.0%) | 3.15 |
Median Household Size in San Buenaventura Ventura
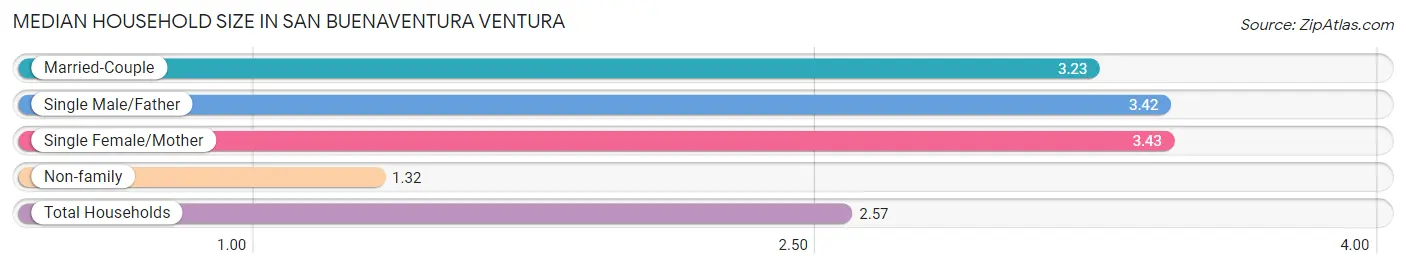
The median household size in San Buenaventura Ventura is 2.57 persons per household, with single female/mother households (4,446 | 10.6%) accounting for the largest median household size of 3.43 persons per household. non-family households (15,104 | 36.0%) represent the smallest median household size with 1.32 persons per household.
| Household Type | # Households | Household Size |
| Married-Couple | 20,195 (48.1%) | 3.23 |
| Single Male/Father | 2,209 (5.3%) | 3.42 |
| Single Female/Mother | 4,446 (10.6%) | 3.43 |
| Non-family | 15,104 (36.0%) | 1.32 |
| Total Households | 41,954 (100.0%) | 2.57 |
Household Size by Marriage Status in San Buenaventura Ventura
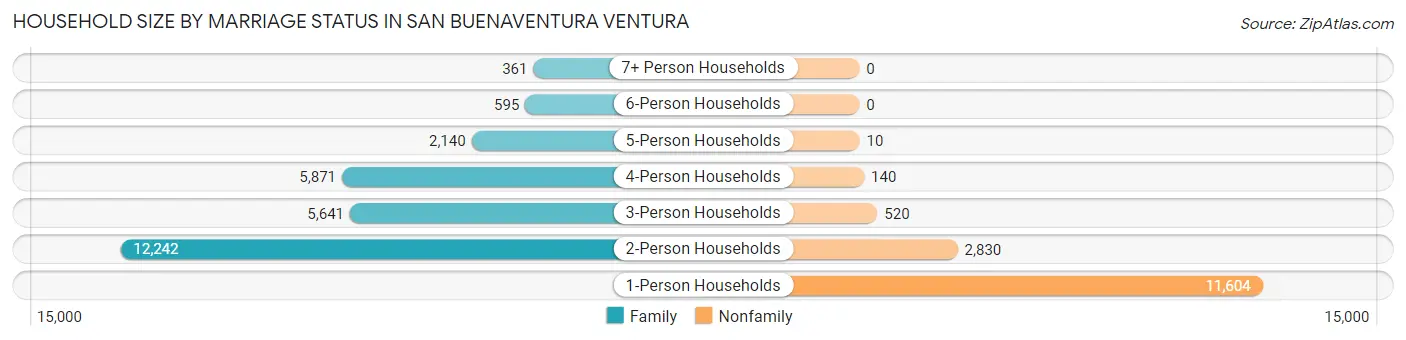
Out of a total of 41,954 households in San Buenaventura Ventura, 26,850 (64.0%) are family households, while 15,104 (36.0%) are nonfamily households. The most numerous type of family households are 2-person households, comprising 12,242, and the most common type of nonfamily households are 1-person households, comprising 11,604.
| Household Size | Family Households | Nonfamily Households |
| 1-Person Households | - | 11,604 (27.7%) |
| 2-Person Households | 12,242 (29.2%) | 2,830 (6.8%) |
| 3-Person Households | 5,641 (13.5%) | 520 (1.2%) |
| 4-Person Households | 5,871 (14.0%) | 140 (0.3%) |
| 5-Person Households | 2,140 (5.1%) | 10 (0.0%) |
| 6-Person Households | 595 (1.4%) | 0 (0.0%) |
| 7+ Person Households | 361 (0.9%) | 0 (0.0%) |
| Total | 26,850 (64.0%) | 15,104 (36.0%) |
Female Fertility in San Buenaventura Ventura
Fertility by Age in San Buenaventura Ventura
Average fertility rate in San Buenaventura Ventura is 34.0 births per 1,000 women. Women in the age bracket of 20 to 34 years have the highest fertility rate with 56.0 births per 1,000 women. Women in the age bracket of 20 to 34 years acount for 66.1% of all women with births.
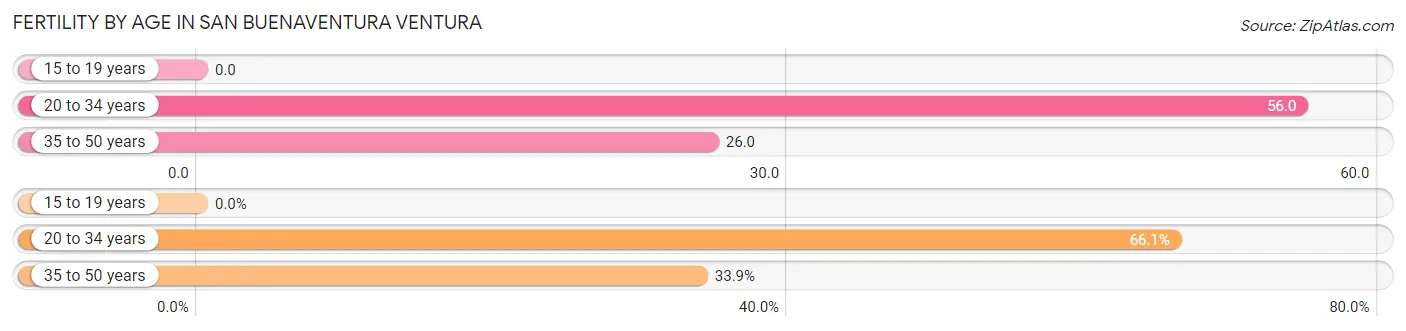
| Age Bracket | Women with Births | Births / 1,000 Women |
| 15 to 19 years | 0 (0.0%) | 0.0 |
| 20 to 34 years | 559 (66.1%) | 56.0 |
| 35 to 50 years | 287 (33.9%) | 26.0 |
| Total | 846 (100.0%) | 34.0 |
Fertility by Age by Marriage Status in San Buenaventura Ventura
70.0% of women with births (846) in San Buenaventura Ventura are married. The highest percentage of unmarried women with births falls into 20 to 34 years age bracket with 43.1% of them unmarried at the time of birth, while the lowest percentage of unmarried women with births belong to 35 to 50 years age bracket with 4.5% of them unmarried.
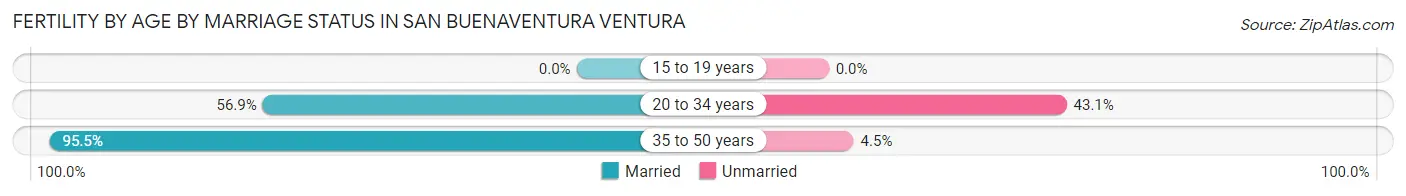
| Age Bracket | Married | Unmarried |
| 15 to 19 years | 0 (0.0%) | 0 (0.0%) |
| 20 to 34 years | 318 (56.9%) | 241 (43.1%) |
| 35 to 50 years | 274 (95.5%) | 13 (4.5%) |
| Total | 592 (70.0%) | 254 (30.0%) |
Fertility by Education in San Buenaventura Ventura
Average fertility rate in San Buenaventura Ventura is 34.0 births per 1,000 women. Women with the education attainment of graduate degree have the highest fertility rate of 59.0 births per 1,000 women, while women with the education attainment of less than high school have the lowest fertility at 6.0 births per 1,000 women. Women with the education attainment of bachelor's degree represent 32.4% of all women with births.
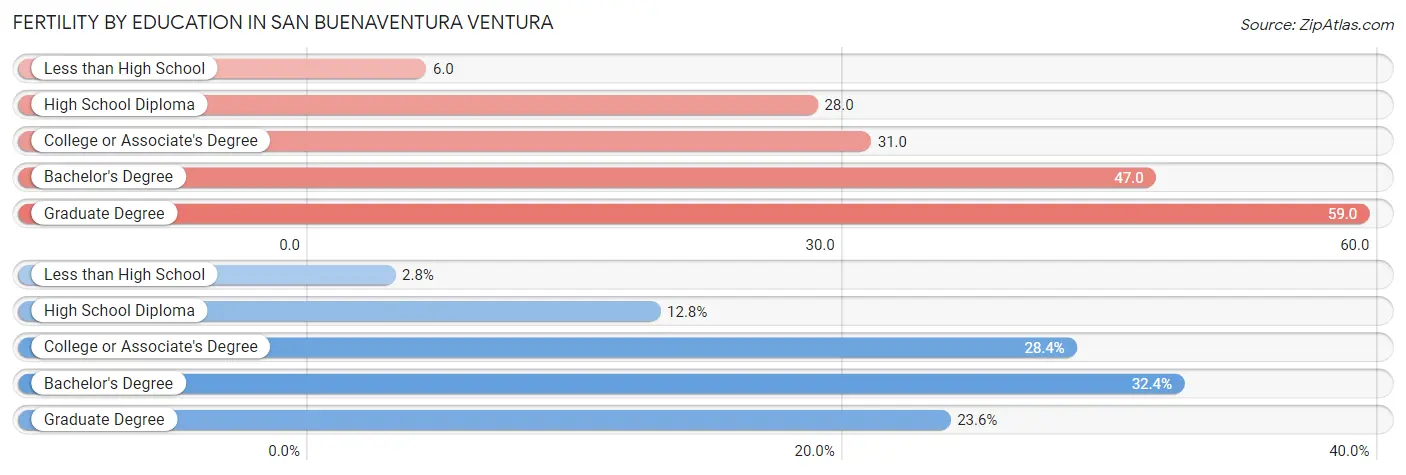
| Educational Attainment | Women with Births | Births / 1,000 Women |
| Less than High School | 24 (2.8%) | 6.0 |
| High School Diploma | 108 (12.8%) | 28.0 |
| College or Associate's Degree | 240 (28.4%) | 31.0 |
| Bachelor's Degree | 274 (32.4%) | 47.0 |
| Graduate Degree | 200 (23.6%) | 59.0 |
| Total | 846 (100.0%) | 34.0 |
Fertility by Education by Marriage Status in San Buenaventura Ventura
30.0% of women with births in San Buenaventura Ventura are unmarried. Women with the educational attainment of graduate degree are most likely to be married with 93.5% of them married at childbirth, while women with the educational attainment of college or associate's degree are least likely to be married with 48.7% of them unmarried at childbirth.
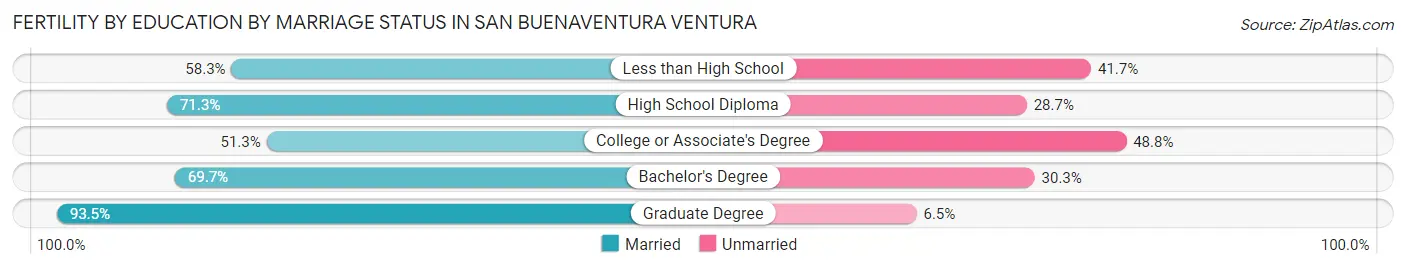
| Educational Attainment | Married | Unmarried |
| Less than High School | 14 (58.3%) | 10 (41.7%) |
| High School Diploma | 77 (71.3%) | 31 (28.7%) |
| College or Associate's Degree | 123 (51.2%) | 117 (48.7%) |
| Bachelor's Degree | 191 (69.7%) | 83 (30.3%) |
| Graduate Degree | 187 (93.5%) | 13 (6.5%) |
| Total | 592 (70.0%) | 254 (30.0%) |
Income in San Buenaventura Ventura
Income Overview in San Buenaventura Ventura
Per Capita Income in San Buenaventura Ventura is $46,562, while median incomes of families and households are $112,232 and $96,036 respectively.
| Characteristic | Number | Measure |
| Per Capita Income | 110,358 | $46,562 |
| Median Family Income | 26,850 | $112,232 |
| Mean Family Income | 26,850 | $136,896 |
| Median Household Income | 41,954 | $96,036 |
| Mean Household Income | 41,954 | $118,805 |
| Income Deficit | 26,850 | $10,504 |
| Wage / Income Gap (%) | 110,358 | 22.55% |
| Wage / Income Gap ($) | 110,358 | 77.45¢ per $1 |
| Gini / Inequality Index | 110,358 | 0.43 |
Earnings by Sex in San Buenaventura Ventura
Average Earnings in San Buenaventura Ventura are $47,113, $54,242 for men and $42,011 for women, a difference of 22.6%.
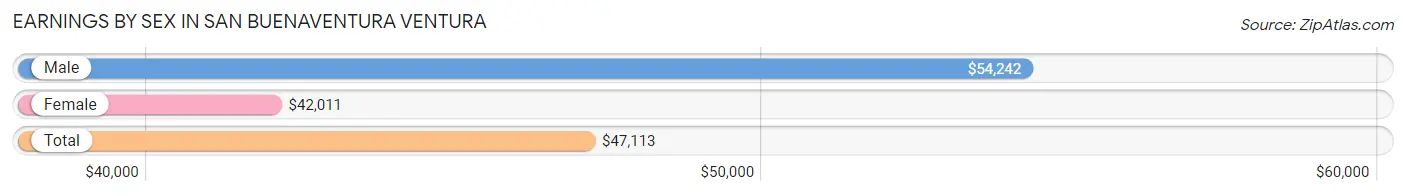
| Sex | Number | Average Earnings |
| Male | 32,425 (54.3%) | $54,242 |
| Female | 27,315 (45.7%) | $42,011 |
| Total | 59,740 (100.0%) | $47,113 |
Earnings by Sex by Income Bracket in San Buenaventura Ventura
The most common earnings brackets in San Buenaventura Ventura are $100,000+ for men (7,809 | 24.1%) and $100,000+ for women (4,068 | 14.9%).
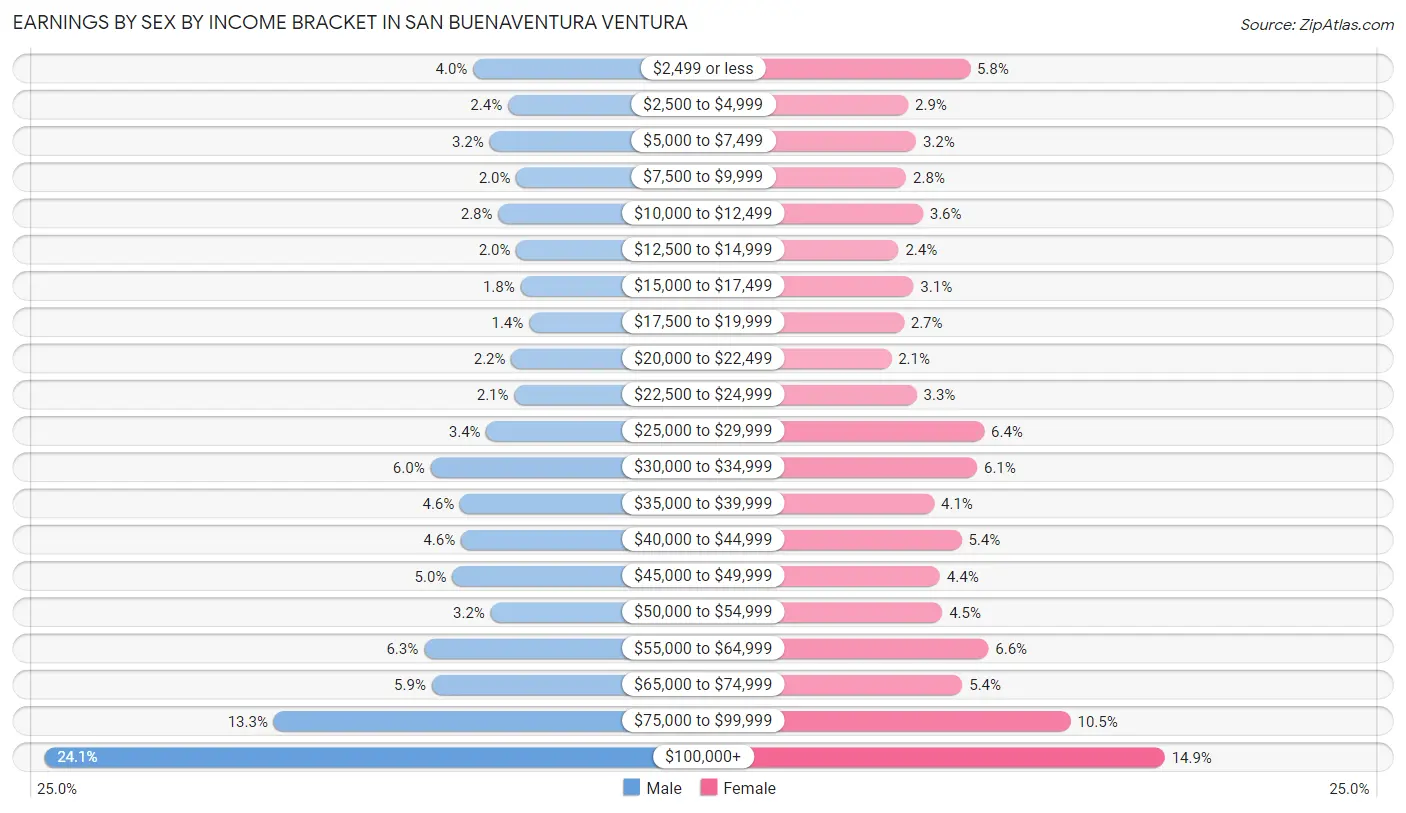
| Income | Male | Female |
| $2,499 or less | 1,294 (4.0%) | 1,575 (5.8%) |
| $2,500 to $4,999 | 764 (2.4%) | 783 (2.9%) |
| $5,000 to $7,499 | 1,043 (3.2%) | 886 (3.2%) |
| $7,500 to $9,999 | 640 (2.0%) | 759 (2.8%) |
| $10,000 to $12,499 | 911 (2.8%) | 972 (3.6%) |
| $12,500 to $14,999 | 638 (2.0%) | 661 (2.4%) |
| $15,000 to $17,499 | 573 (1.8%) | 853 (3.1%) |
| $17,500 to $19,999 | 443 (1.4%) | 730 (2.7%) |
| $20,000 to $22,499 | 712 (2.2%) | 569 (2.1%) |
| $22,500 to $24,999 | 668 (2.1%) | 893 (3.3%) |
| $25,000 to $29,999 | 1,092 (3.4%) | 1,756 (6.4%) |
| $30,000 to $34,999 | 1,943 (6.0%) | 1,665 (6.1%) |
| $35,000 to $39,999 | 1,490 (4.6%) | 1,117 (4.1%) |
| $40,000 to $44,999 | 1,479 (4.6%) | 1,467 (5.4%) |
| $45,000 to $49,999 | 1,610 (5.0%) | 1,190 (4.4%) |
| $50,000 to $54,999 | 1,029 (3.2%) | 1,220 (4.5%) |
| $55,000 to $64,999 | 2,041 (6.3%) | 1,812 (6.6%) |
| $65,000 to $74,999 | 1,924 (5.9%) | 1,477 (5.4%) |
| $75,000 to $99,999 | 4,322 (13.3%) | 2,862 (10.5%) |
| $100,000+ | 7,809 (24.1%) | 4,068 (14.9%) |
| Total | 32,425 (100.0%) | 27,315 (100.0%) |
Earnings by Sex by Educational Attainment in San Buenaventura Ventura
Average earnings in San Buenaventura Ventura are $62,781 for men and $46,815 for women, a difference of 25.4%. Men with an educational attainment of graduate degree enjoy the highest average annual earnings of $114,430, while those with less than high school education earn the least with $40,096. Women with an educational attainment of graduate degree earn the most with the average annual earnings of $83,842, while those with less than high school education have the smallest earnings of $25,746.
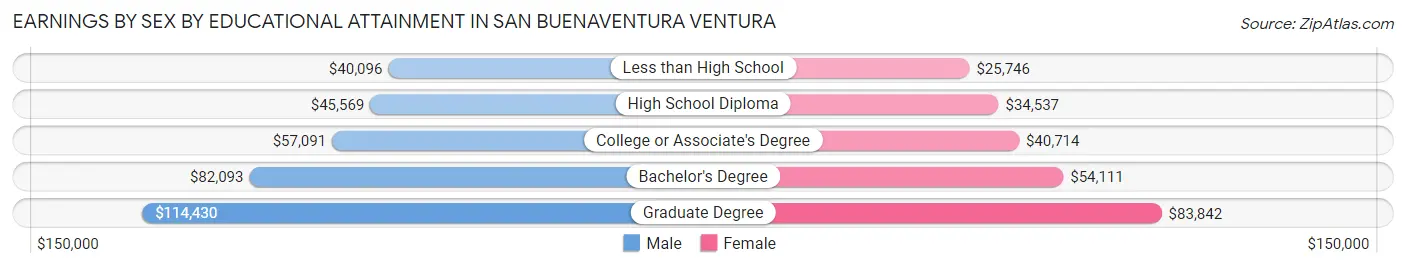
| Educational Attainment | Male Income | Female Income |
| Less than High School | $40,096 | $25,746 |
| High School Diploma | $45,569 | $34,537 |
| College or Associate's Degree | $57,091 | $40,714 |
| Bachelor's Degree | $82,093 | $54,111 |
| Graduate Degree | $114,430 | $83,842 |
| Total | $62,781 | $46,815 |
Family Income in San Buenaventura Ventura
Family Income Brackets in San Buenaventura Ventura
According to the San Buenaventura Ventura family income data, there are 5,826 families falling into the $100,000 to $149,999 income range, which is the most common income bracket and makes up 21.7% of all families. Conversely, the $10,000 to $14,999 income bracket is the least frequent group with only 456 families (1.7%) belonging to this category.
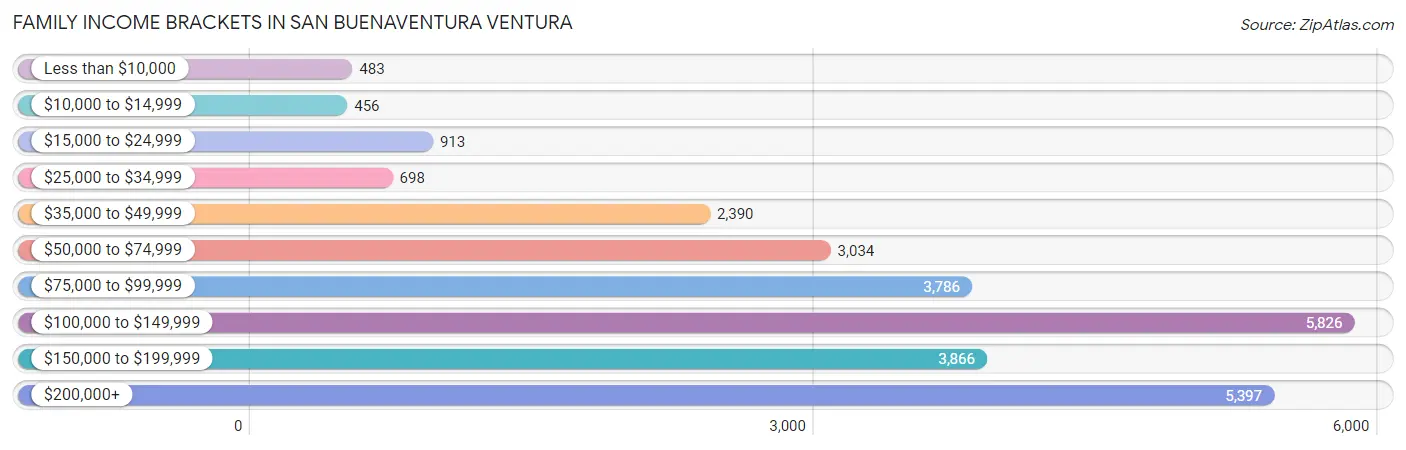
| Income Bracket | # Families | % Families |
| Less than $10,000 | 483 | 1.8% |
| $10,000 to $14,999 | 456 | 1.7% |
| $15,000 to $24,999 | 913 | 3.4% |
| $25,000 to $34,999 | 698 | 2.6% |
| $35,000 to $49,999 | 2,390 | 8.9% |
| $50,000 to $74,999 | 3,034 | 11.3% |
| $75,000 to $99,999 | 3,786 | 14.1% |
| $100,000 to $149,999 | 5,826 | 21.7% |
| $150,000 to $199,999 | 3,866 | 14.4% |
| $200,000+ | 5,397 | 20.1% |
Family Income by Famaliy Size in San Buenaventura Ventura
4-person families (5,590 | 20.8%) account for the highest median family income in San Buenaventura Ventura with $132,450 per family, while 2-person families (13,151 | 49.0%) have the highest median income of $49,785 per family member.
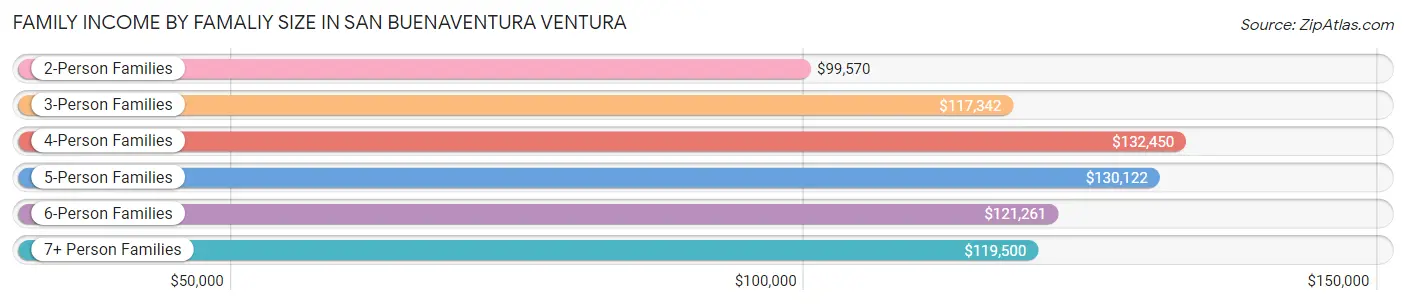
| Income Bracket | # Families | Median Income |
| 2-Person Families | 13,151 (49.0%) | $99,570 |
| 3-Person Families | 5,626 (20.9%) | $117,342 |
| 4-Person Families | 5,590 (20.8%) | $132,450 |
| 5-Person Families | 1,795 (6.7%) | $130,122 |
| 6-Person Families | 488 (1.8%) | $121,261 |
| 7+ Person Families | 200 (0.7%) | $119,500 |
| Total | 26,850 (100.0%) | $112,232 |
Family Income by Number of Earners in San Buenaventura Ventura
The median family income in San Buenaventura Ventura is $112,232, with families comprising 3+ earners (3,156) having the highest median family income of $152,575, while families with 1 earner (8,570) have the lowest median family income of $75,865, accounting for 11.7% and 31.9% of families, respectively.
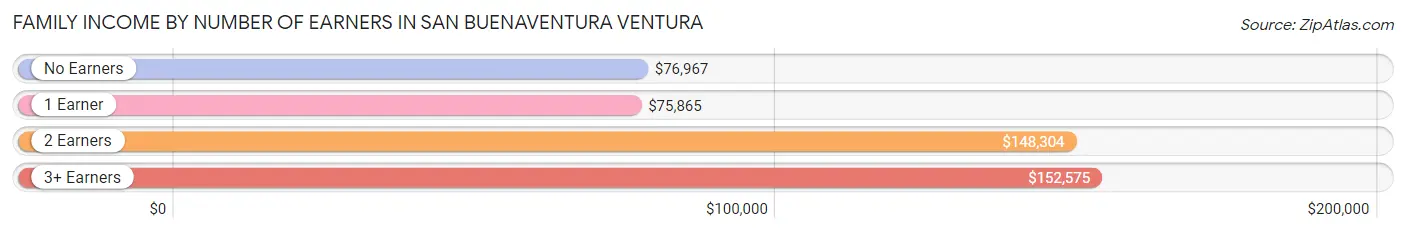
| Number of Earners | # Families | Median Income |
| No Earners | 3,858 (14.4%) | $76,967 |
| 1 Earner | 8,570 (31.9%) | $75,865 |
| 2 Earners | 11,266 (42.0%) | $148,304 |
| 3+ Earners | 3,156 (11.7%) | $152,575 |
| Total | 26,850 (100.0%) | $112,232 |
Household Income in San Buenaventura Ventura
Household Income Brackets in San Buenaventura Ventura
With 8,643 households falling in the category, the $100,000 to $149,999 income range is the most frequent in San Buenaventura Ventura, accounting for 20.6% of all households. In contrast, only 1,259 households (3.0%) fall into the $10,000 to $14,999 income bracket, making it the least populous group.
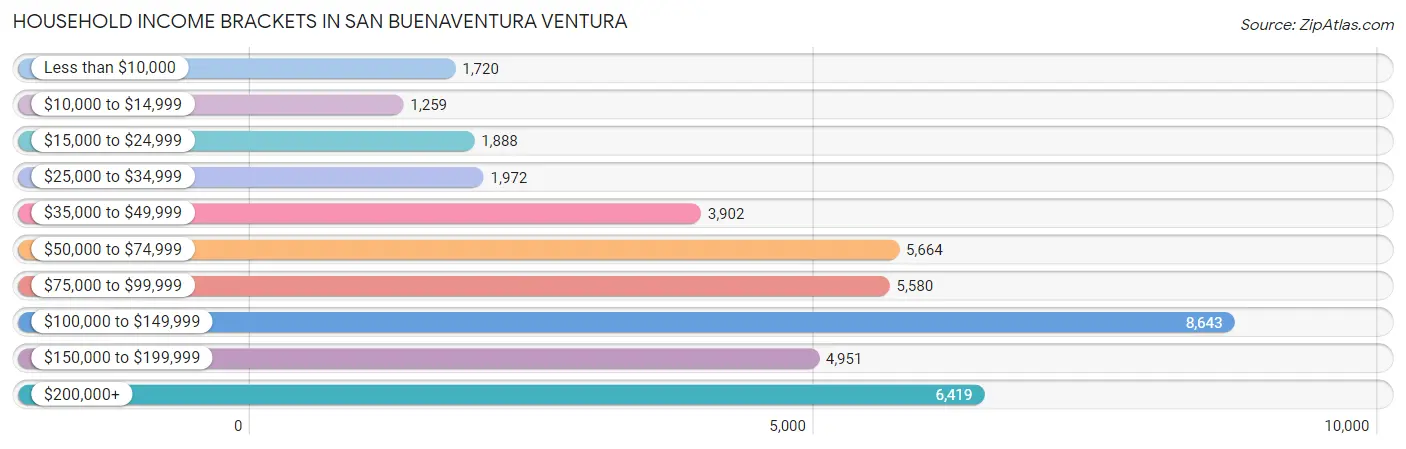
| Income Bracket | # Households | % Households |
| Less than $10,000 | 1,720 | 4.1% |
| $10,000 to $14,999 | 1,259 | 3.0% |
| $15,000 to $24,999 | 1,888 | 4.5% |
| $25,000 to $34,999 | 1,972 | 4.7% |
| $35,000 to $49,999 | 3,902 | 9.3% |
| $50,000 to $74,999 | 5,664 | 13.5% |
| $75,000 to $99,999 | 5,580 | 13.3% |
| $100,000 to $149,999 | 8,643 | 20.6% |
| $150,000 to $199,999 | 4,951 | 11.8% |
| $200,000+ | 6,419 | 15.3% |
Household Income by Householder Age in San Buenaventura Ventura
The median household income in San Buenaventura Ventura is $96,036, with the highest median household income of $108,007 found in the 45 to 64 years age bracket for the primary householder. A total of 16,232 households (38.7%) fall into this category. Meanwhile, the 15 to 24 years age bracket for the primary householder has the lowest median household income of $33,533, with 577 households (1.4%) in this group.
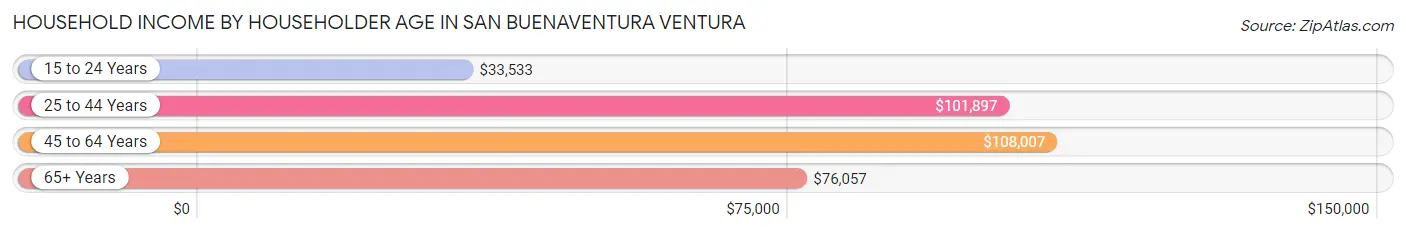
| Income Bracket | # Households | Median Income |
| 15 to 24 Years | 577 (1.4%) | $33,533 |
| 25 to 44 Years | 12,611 (30.1%) | $101,897 |
| 45 to 64 Years | 16,232 (38.7%) | $108,007 |
| 65+ Years | 12,534 (29.9%) | $76,057 |
| Total | 41,954 (100.0%) | $96,036 |
Poverty in San Buenaventura Ventura
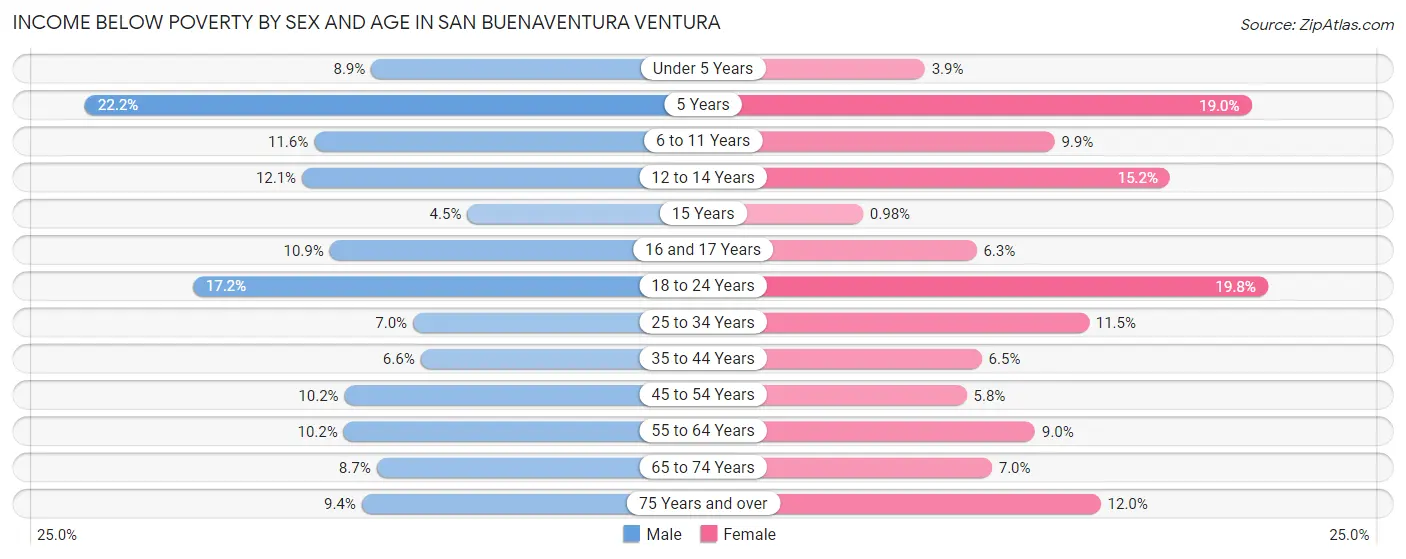
Income Below Poverty by Sex and Age in San Buenaventura Ventura
With 9.9% poverty level for males and 9.3% for females among the residents of San Buenaventura Ventura, 5 year old males and 18 to 24 year old females are the most vulnerable to poverty, with 186 males (22.2%) and 820 females (19.8%) in their respective age groups living below the poverty level.
| Age Bracket | Male | Female |
| Under 5 Years | 225 (8.9%) | 108 (3.8%) |
| 5 Years | 186 (22.2%) | 121 (19.0%) |
| 6 to 11 Years | 420 (11.6%) | 339 (9.9%) |
| 12 to 14 Years | 201 (12.1%) | 267 (15.2%) |
| 15 Years | 32 (4.5%) | 10 (1.0%) |
| 16 and 17 Years | 152 (10.8%) | 97 (6.2%) |
| 18 to 24 Years | 768 (17.2%) | 820 (19.8%) |
| 25 to 34 Years | 528 (7.0%) | 811 (11.5%) |
| 35 to 44 Years | 465 (6.6%) | 454 (6.5%) |
| 45 to 54 Years | 710 (10.2%) | 399 (5.8%) |
| 55 to 64 Years | 882 (10.2%) | 671 (9.0%) |
| 65 to 74 Years | 484 (8.7%) | 441 (7.0%) |
| 75 Years and over | 294 (9.4%) | 554 (12.0%) |
| Total | 5,347 (9.9%) | 5,092 (9.3%) |
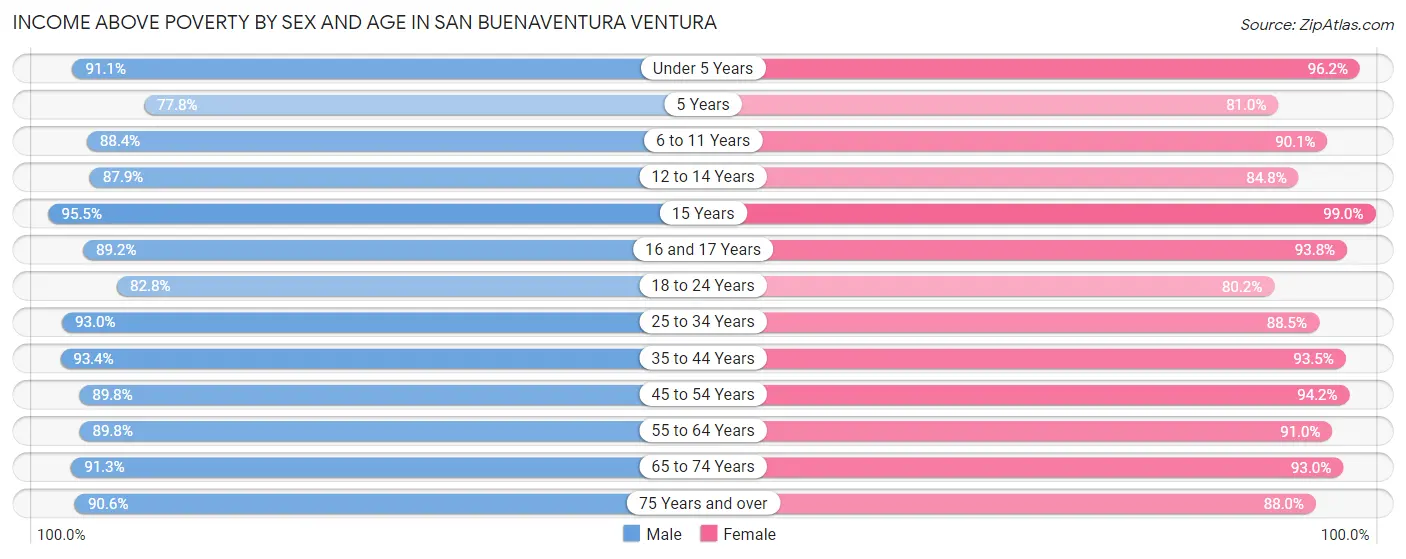
Income Above Poverty by Sex and Age in San Buenaventura Ventura
According to the poverty statistics in San Buenaventura Ventura, males aged 15 years and females aged 15 years are the age groups that are most secure financially, with 95.5% of males and 99.0% of females in these age groups living above the poverty line.
| Age Bracket | Male | Female |
| Under 5 Years | 2,297 (91.1%) | 2,696 (96.2%) |
| 5 Years | 652 (77.8%) | 516 (81.0%) |
| 6 to 11 Years | 3,209 (88.4%) | 3,096 (90.1%) |
| 12 to 14 Years | 1,456 (87.9%) | 1,487 (84.8%) |
| 15 Years | 685 (95.5%) | 1,008 (99.0%) |
| 16 and 17 Years | 1,249 (89.1%) | 1,456 (93.8%) |
| 18 to 24 Years | 3,700 (82.8%) | 3,330 (80.2%) |
| 25 to 34 Years | 7,040 (93.0%) | 6,266 (88.5%) |
| 35 to 44 Years | 6,548 (93.4%) | 6,539 (93.5%) |
| 45 to 54 Years | 6,281 (89.8%) | 6,497 (94.2%) |
| 55 to 64 Years | 7,768 (89.8%) | 6,815 (91.0%) |
| 65 to 74 Years | 5,101 (91.3%) | 5,894 (93.0%) |
| 75 Years and over | 2,846 (90.6%) | 4,057 (88.0%) |
| Total | 48,832 (90.1%) | 49,657 (90.7%) |
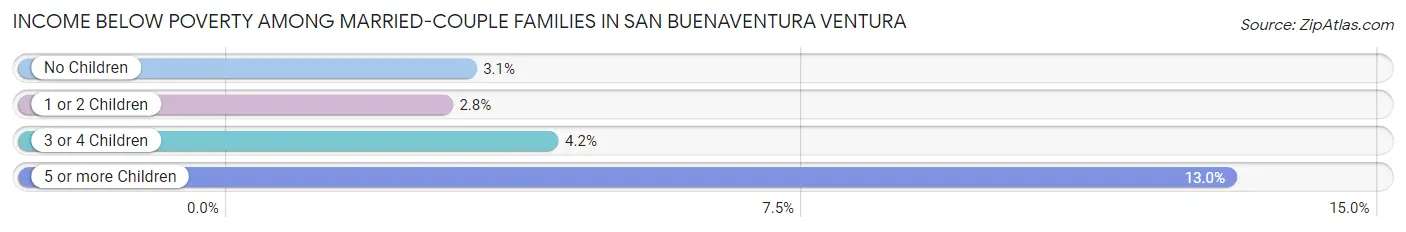
Income Below Poverty Among Married-Couple Families in San Buenaventura Ventura
The poverty statistics for married-couple families in San Buenaventura Ventura show that 3.1% or 625 of the total 20,195 families live below the poverty line. Families with 5 or more children have the highest poverty rate of 13.0%, comprising of 9 families. On the other hand, families with 1 or 2 children have the lowest poverty rate of 2.8%, which includes 192 families.
| Children | Above Poverty | Below Poverty |
| No Children | 11,864 (96.9%) | 381 (3.1%) |
| 1 or 2 Children | 6,661 (97.2%) | 192 (2.8%) |
| 3 or 4 Children | 985 (95.8%) | 43 (4.2%) |
| 5 or more Children | 60 (87.0%) | 9 (13.0%) |
| Total | 19,570 (96.9%) | 625 (3.1%) |
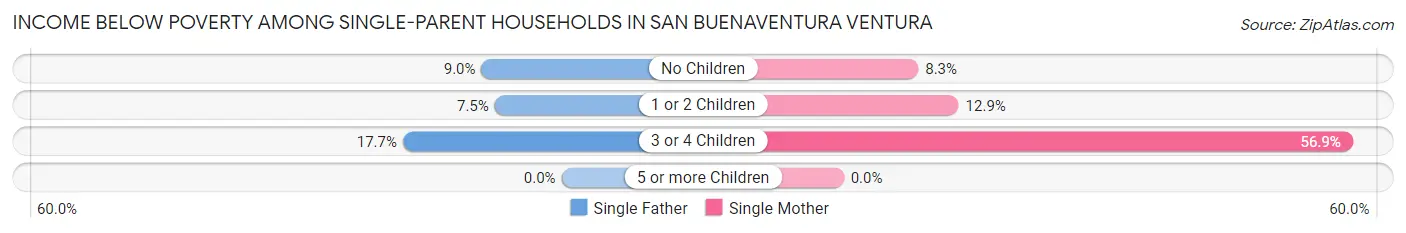
Income Below Poverty Among Single-Parent Households in San Buenaventura Ventura
According to the poverty data in San Buenaventura Ventura, 8.8% or 195 single-father households and 13.9% or 618 single-mother households are living below the poverty line. Among single-father households, those with 3 or 4 children have the highest poverty rate, with 25 households (17.7%) experiencing poverty. Likewise, among single-mother households, those with 3 or 4 children have the highest poverty rate, with 182 households (56.9%) falling below the poverty line.
| Children | Single Father | Single Mother |
| No Children | 94 (8.9%) | 174 (8.3%) |
| 1 or 2 Children | 76 (7.5%) | 262 (12.9%) |
| 3 or 4 Children | 25 (17.7%) | 182 (56.9%) |
| 5 or more Children | 0 (0.0%) | 0 (0.0%) |
| Total | 195 (8.8%) | 618 (13.9%) |
Income Below Poverty Among Married-Couple vs Single-Parent Households in San Buenaventura Ventura
The poverty data for San Buenaventura Ventura shows that 625 of the married-couple family households (3.1%) and 813 of the single-parent households (12.2%) are living below the poverty level. Within the married-couple family households, those with 5 or more children have the highest poverty rate, with 9 households (13.0%) falling below the poverty line. Among the single-parent households, those with 3 or 4 children have the highest poverty rate, with 207 household (44.9%) living below poverty.
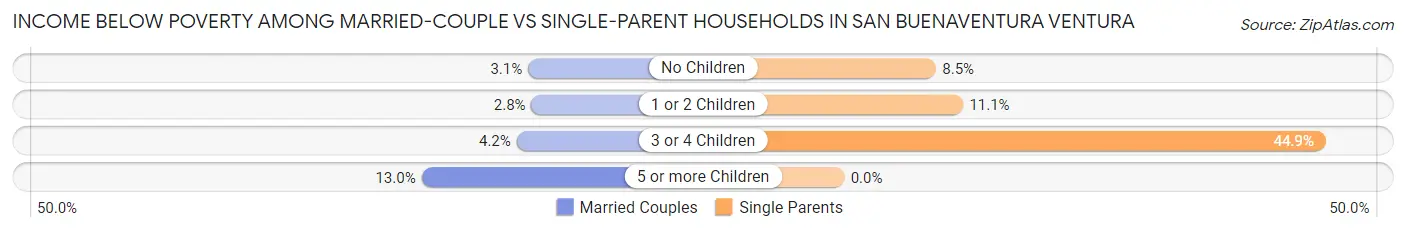
| Children | Married-Couple Families | Single-Parent Households |
| No Children | 381 (3.1%) | 268 (8.5%) |
| 1 or 2 Children | 192 (2.8%) | 338 (11.1%) |
| 3 or 4 Children | 43 (4.2%) | 207 (44.9%) |
| 5 or more Children | 9 (13.0%) | 0 (0.0%) |
| Total | 625 (3.1%) | 813 (12.2%) |
Employment Characteristics in San Buenaventura Ventura
Employment by Class of Employer in San Buenaventura Ventura
Among the 53,804 employed individuals in San Buenaventura Ventura, private company employees (32,428 | 60.3%), local government employees (6,860 | 12.8%), and self-employed (not incorporated) (4,335 | 8.1%) make up the most common classes of employment.
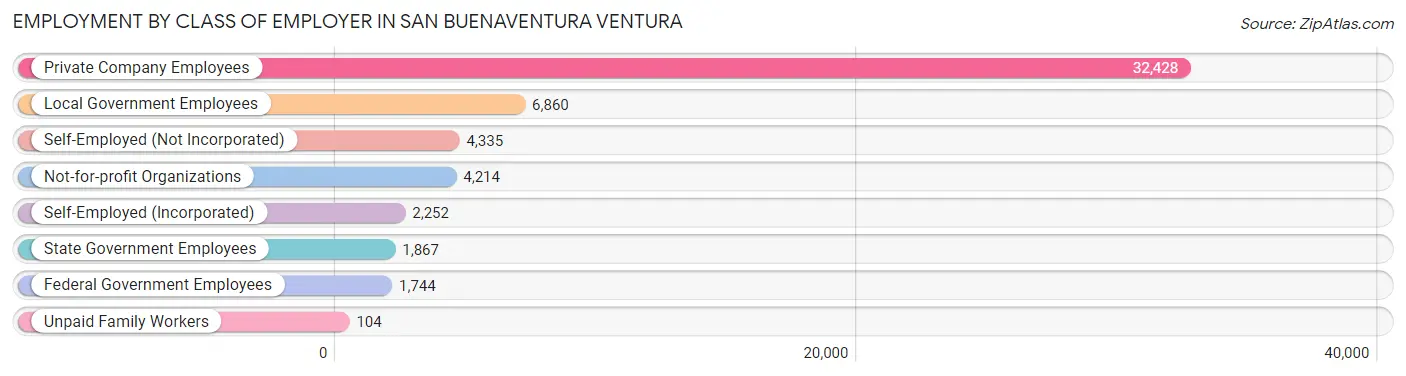
| Employer Class | # Employees | % Employees |
| Private Company Employees | 32,428 | 60.3% |
| Self-Employed (Incorporated) | 2,252 | 4.2% |
| Self-Employed (Not Incorporated) | 4,335 | 8.1% |
| Not-for-profit Organizations | 4,214 | 7.8% |
| Local Government Employees | 6,860 | 12.8% |
| State Government Employees | 1,867 | 3.5% |
| Federal Government Employees | 1,744 | 3.2% |
| Unpaid Family Workers | 104 | 0.2% |
| Total | 53,804 | 100.0% |
Employment Status by Age in San Buenaventura Ventura
According to the labor force statistics for San Buenaventura Ventura, out of the total population over 16 years of age (90,992), 63.9% or 58,144 individuals are in the labor force, with 4.9% or 2,849 of them unemployed. The age group with the highest labor force participation rate is 25 to 29 years, with 85.9% or 6,432 individuals in the labor force. Within the labor force, the 75 years and over age range has the highest percentage of unemployed individuals, with 17.8% or 100 of them being unemployed.
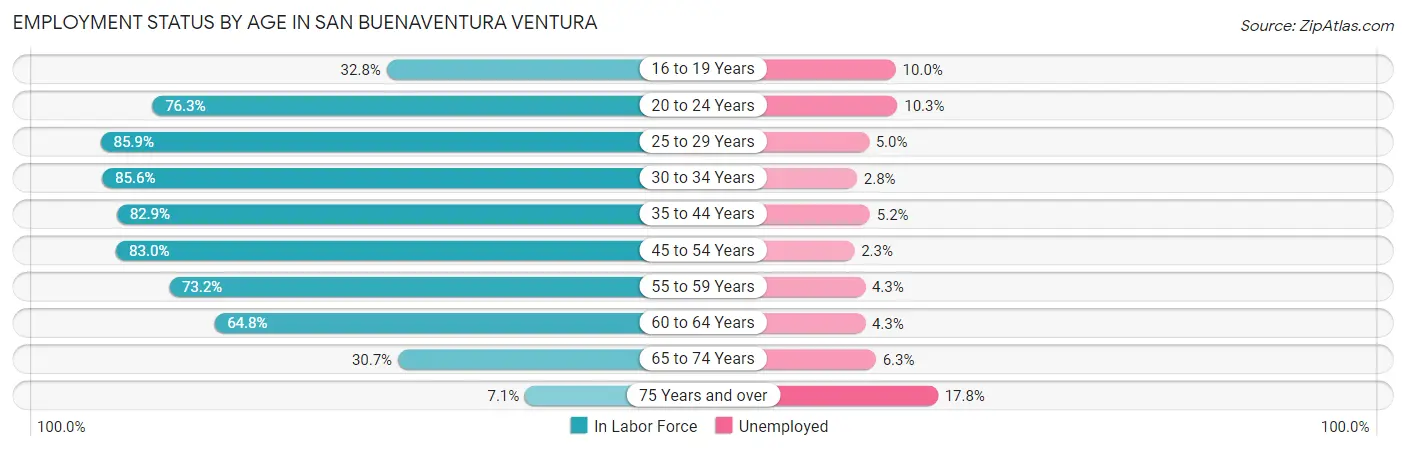
| Age Bracket | In Labor Force | Unemployed |
| 16 to 19 Years | 1,813 (32.8%) | 181 (10.0%) |
| 20 to 24 Years | 4,709 (76.3%) | 485 (10.3%) |
| 25 to 29 Years | 6,432 (85.9%) | 322 (5.0%) |
| 30 to 34 Years | 6,348 (85.6%) | 178 (2.8%) |
| 35 to 44 Years | 11,791 (82.9%) | 613 (5.2%) |
| 45 to 54 Years | 11,590 (83.0%) | 267 (2.3%) |
| 55 to 59 Years | 5,758 (73.2%) | 248 (4.3%) |
| 60 to 64 Years | 5,428 (64.8%) | 233 (4.3%) |
| 65 to 74 Years | 3,687 (30.7%) | 232 (6.3%) |
| 75 Years and over | 564 (7.1%) | 100 (17.8%) |
| Total | 58,144 (63.9%) | 2,849 (4.9%) |
Employment Status by Educational Attainment in San Buenaventura Ventura
According to labor force statistics for San Buenaventura Ventura, 79.8% of individuals (47,348) out of the total population between 25 and 64 years of age (59,333) are in the labor force, with 3.9% or 1,847 of them being unemployed. The group with the highest labor force participation rate are those with the educational attainment of bachelor's degree or higher, with 86.0% or 20,258 individuals in the labor force. Within the labor force, individuals with less than high school education have the highest percentage of unemployment, with 9.7% or 345 of them being unemployed.
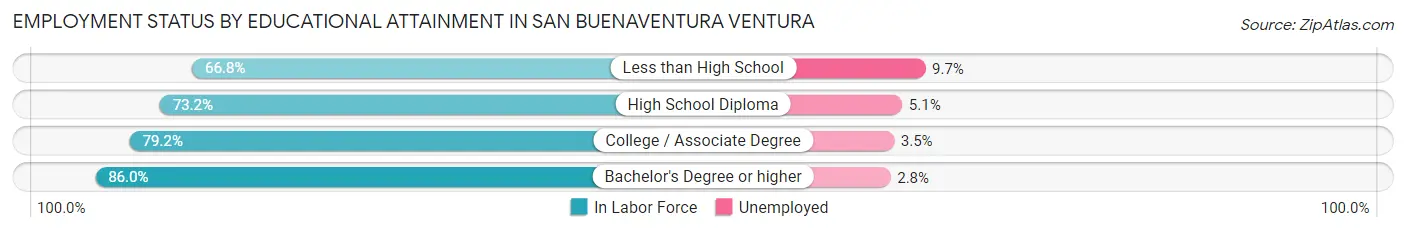
| Educational Attainment | In Labor Force | Unemployed |
| Less than High School | 3,559 (66.8%) | 517 (9.7%) |
| High School Diploma | 7,335 (73.2%) | 511 (5.1%) |
| College / Associate Degree | 16,180 (79.2%) | 715 (3.5%) |
| Bachelor's Degree or higher | 20,258 (86.0%) | 660 (2.8%) |
| Total | 47,348 (79.8%) | 2,314 (3.9%) |
Employment Occupations by Sex in San Buenaventura Ventura
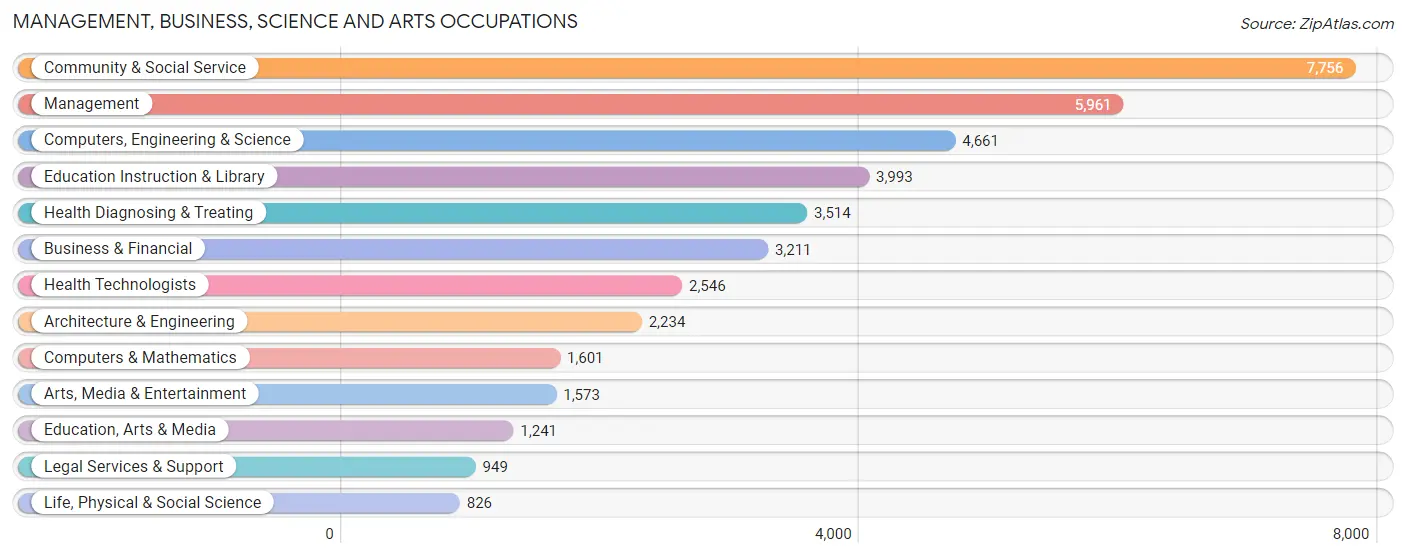
Management, Business, Science and Arts Occupations
The most common Management, Business, Science and Arts occupations in San Buenaventura Ventura are Community & Social Service (7,756 | 14.1%), Management (5,961 | 10.8%), Computers, Engineering & Science (4,661 | 8.5%), Education Instruction & Library (3,993 | 7.2%), and Health Diagnosing & Treating (3,514 | 6.4%).
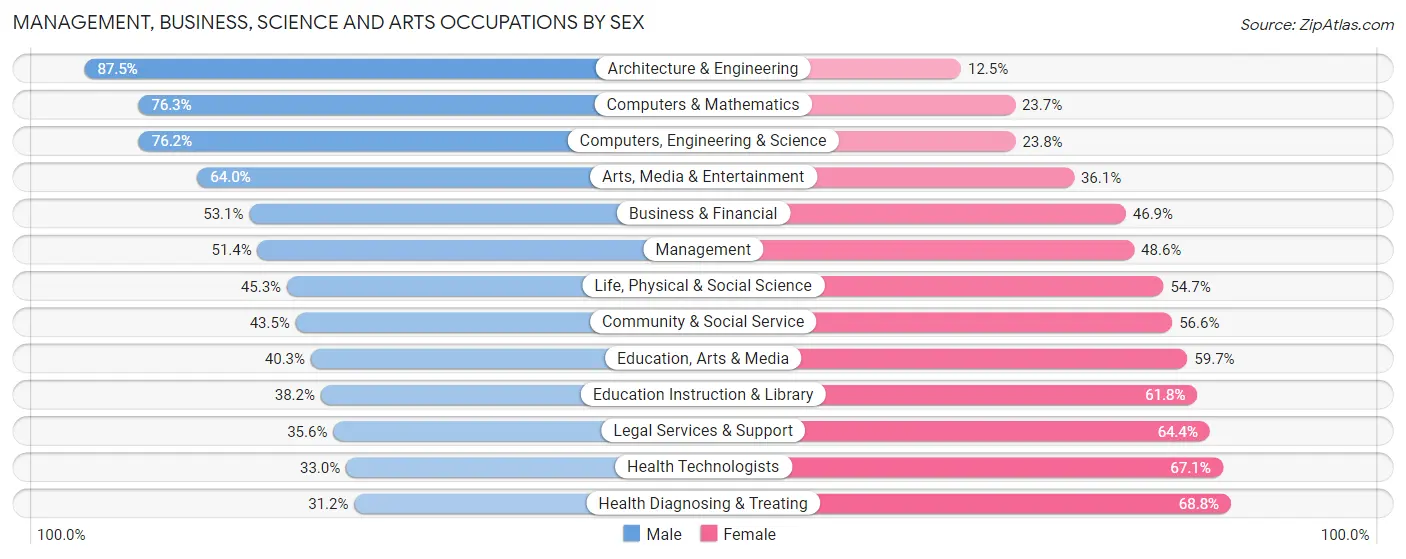
Management, Business, Science and Arts Occupations by Sex
Within the Management, Business, Science and Arts occupations in San Buenaventura Ventura, the most male-oriented occupations are Architecture & Engineering (87.5%), Computers & Mathematics (76.3%), and Computers, Engineering & Science (76.2%), while the most female-oriented occupations are Health Diagnosing & Treating (68.8%), Health Technologists (67.0%), and Legal Services & Support (64.4%).
| Occupation | Male | Female |
| Management | 3,064 (51.4%) | 2,897 (48.6%) |
| Business & Financial | 1,706 (53.1%) | 1,505 (46.9%) |
| Computers, Engineering & Science | 3,550 (76.2%) | 1,111 (23.8%) |
| Computers & Mathematics | 1,221 (76.3%) | 380 (23.7%) |
| Architecture & Engineering | 1,955 (87.5%) | 279 (12.5%) |
| Life, Physical & Social Science | 374 (45.3%) | 452 (54.7%) |
| Community & Social Service | 3,370 (43.4%) | 4,386 (56.6%) |
| Education, Arts & Media | 500 (40.3%) | 741 (59.7%) |
| Legal Services & Support | 338 (35.6%) | 611 (64.4%) |
| Education Instruction & Library | 1,526 (38.2%) | 2,467 (61.8%) |
| Arts, Media & Entertainment | 1,006 (63.9%) | 567 (36.0%) |
| Health Diagnosing & Treating | 1,097 (31.2%) | 2,417 (68.8%) |
| Health Technologists | 839 (33.0%) | 1,707 (67.0%) |
| Total (Category) | 12,787 (50.9%) | 12,316 (49.1%) |
| Total (Overall) | 29,839 (54.2%) | 25,218 (45.8%) |
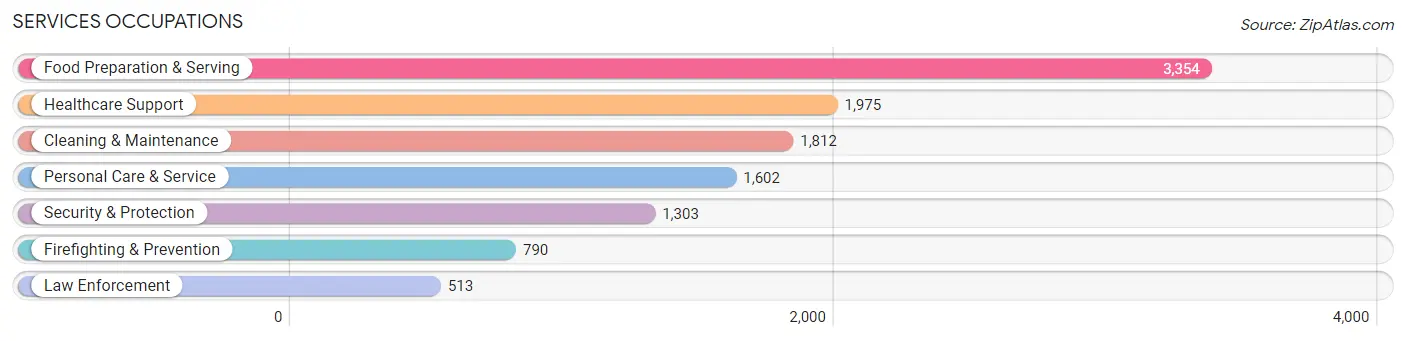
Services Occupations
The most common Services occupations in San Buenaventura Ventura are Food Preparation & Serving (3,354 | 6.1%), Healthcare Support (1,975 | 3.6%), Cleaning & Maintenance (1,812 | 3.3%), Personal Care & Service (1,602 | 2.9%), and Security & Protection (1,303 | 2.4%).
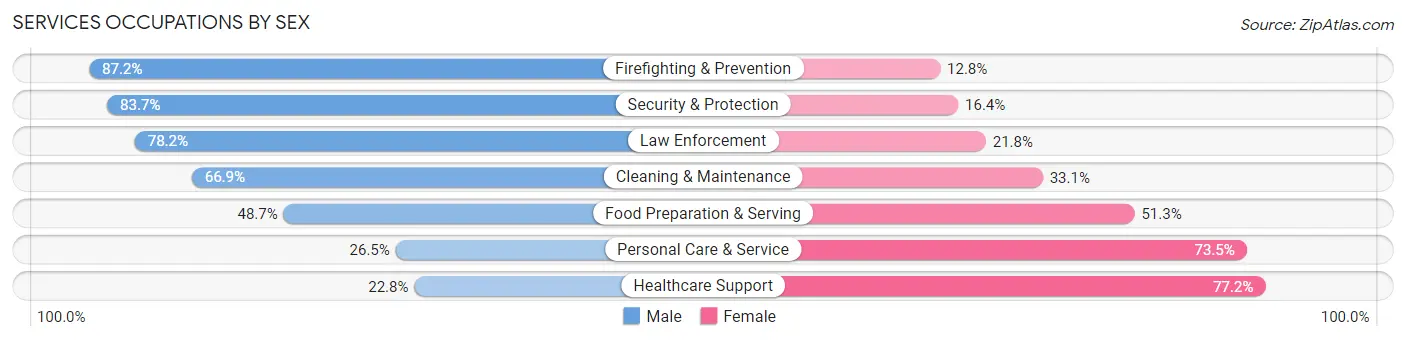
Services Occupations by Sex
Within the Services occupations in San Buenaventura Ventura, the most male-oriented occupations are Firefighting & Prevention (87.2%), Security & Protection (83.7%), and Law Enforcement (78.2%), while the most female-oriented occupations are Healthcare Support (77.2%), Personal Care & Service (73.5%), and Food Preparation & Serving (51.3%).
| Occupation | Male | Female |
| Healthcare Support | 451 (22.8%) | 1,524 (77.2%) |
| Security & Protection | 1,090 (83.7%) | 213 (16.4%) |
| Firefighting & Prevention | 689 (87.2%) | 101 (12.8%) |
| Law Enforcement | 401 (78.2%) | 112 (21.8%) |
| Food Preparation & Serving | 1,634 (48.7%) | 1,720 (51.3%) |
| Cleaning & Maintenance | 1,212 (66.9%) | 600 (33.1%) |
| Personal Care & Service | 425 (26.5%) | 1,177 (73.5%) |
| Total (Category) | 4,812 (47.9%) | 5,234 (52.1%) |
| Total (Overall) | 29,839 (54.2%) | 25,218 (45.8%) |
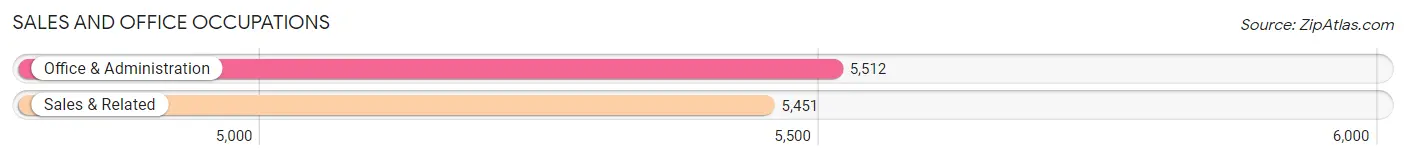
Sales and Office Occupations
The most common Sales and Office occupations in San Buenaventura Ventura are Office & Administration (5,512 | 10.0%), and Sales & Related (5,451 | 9.9%).
Sales and Office Occupations by Sex
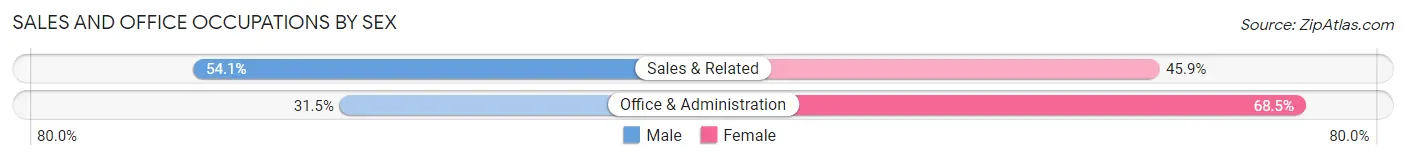
| Occupation | Male | Female |
| Sales & Related | 2,947 (54.1%) | 2,504 (45.9%) |
| Office & Administration | 1,737 (31.5%) | 3,775 (68.5%) |
| Total (Category) | 4,684 (42.7%) | 6,279 (57.3%) |
| Total (Overall) | 29,839 (54.2%) | 25,218 (45.8%) |
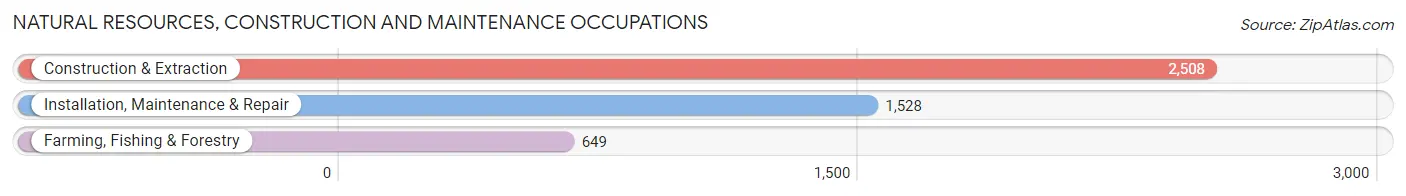
Natural Resources, Construction and Maintenance Occupations
The most common Natural Resources, Construction and Maintenance occupations in San Buenaventura Ventura are Construction & Extraction (2,508 | 4.6%), Installation, Maintenance & Repair (1,528 | 2.8%), and Farming, Fishing & Forestry (649 | 1.2%).
Natural Resources, Construction and Maintenance Occupations by Sex
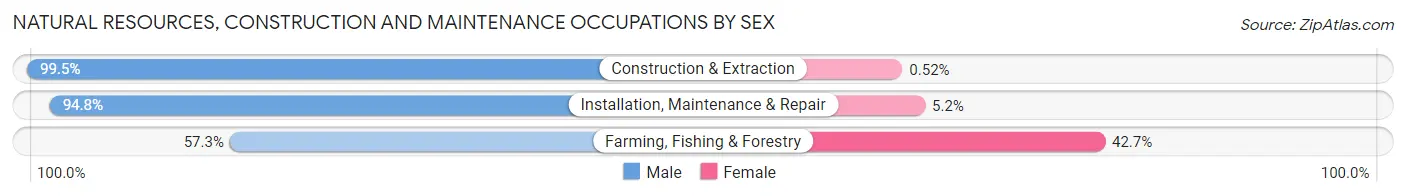
| Occupation | Male | Female |
| Farming, Fishing & Forestry | 372 (57.3%) | 277 (42.7%) |
| Construction & Extraction | 2,495 (99.5%) | 13 (0.5%) |
| Installation, Maintenance & Repair | 1,448 (94.8%) | 80 (5.2%) |
| Total (Category) | 4,315 (92.1%) | 370 (7.9%) |
| Total (Overall) | 29,839 (54.2%) | 25,218 (45.8%) |
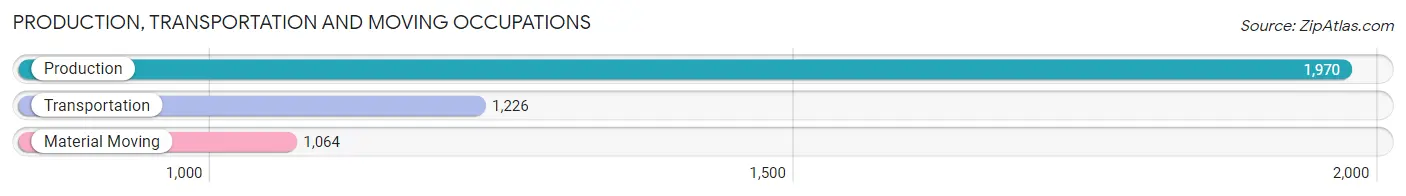
Production, Transportation and Moving Occupations
The most common Production, Transportation and Moving occupations in San Buenaventura Ventura are Production (1,970 | 3.6%), Transportation (1,226 | 2.2%), and Material Moving (1,064 | 1.9%).
Production, Transportation and Moving Occupations by Sex
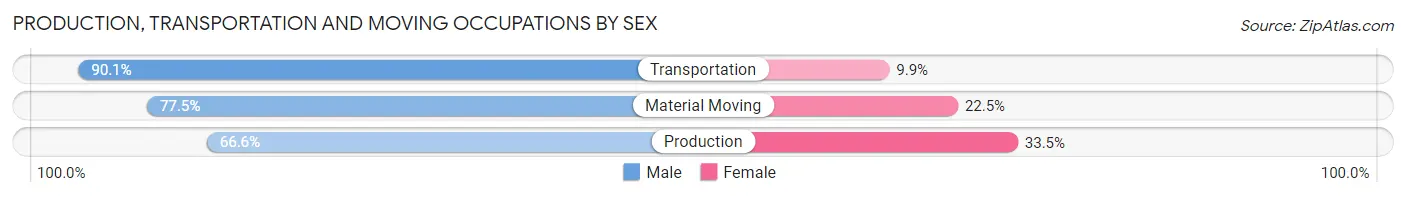
| Occupation | Male | Female |
| Production | 1,311 (66.5%) | 659 (33.5%) |
| Transportation | 1,105 (90.1%) | 121 (9.9%) |
| Material Moving | 825 (77.5%) | 239 (22.5%) |
| Total (Category) | 3,241 (76.1%) | 1,019 (23.9%) |
| Total (Overall) | 29,839 (54.2%) | 25,218 (45.8%) |
Employment Industries by Sex in San Buenaventura Ventura
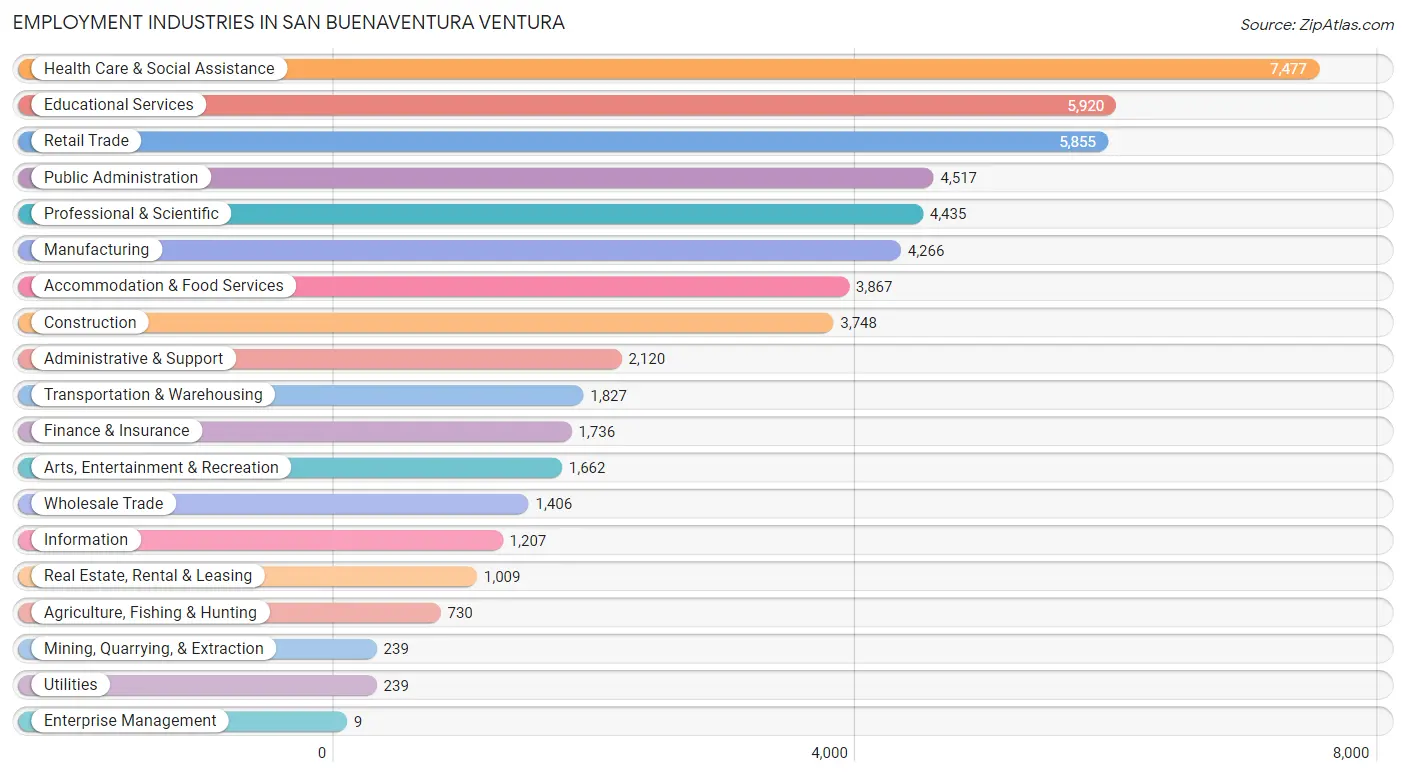
Employment Industries in San Buenaventura Ventura
The major employment industries in San Buenaventura Ventura include Health Care & Social Assistance (7,477 | 13.6%), Educational Services (5,920 | 10.7%), Retail Trade (5,855 | 10.6%), Public Administration (4,517 | 8.2%), and Professional & Scientific (4,435 | 8.1%).
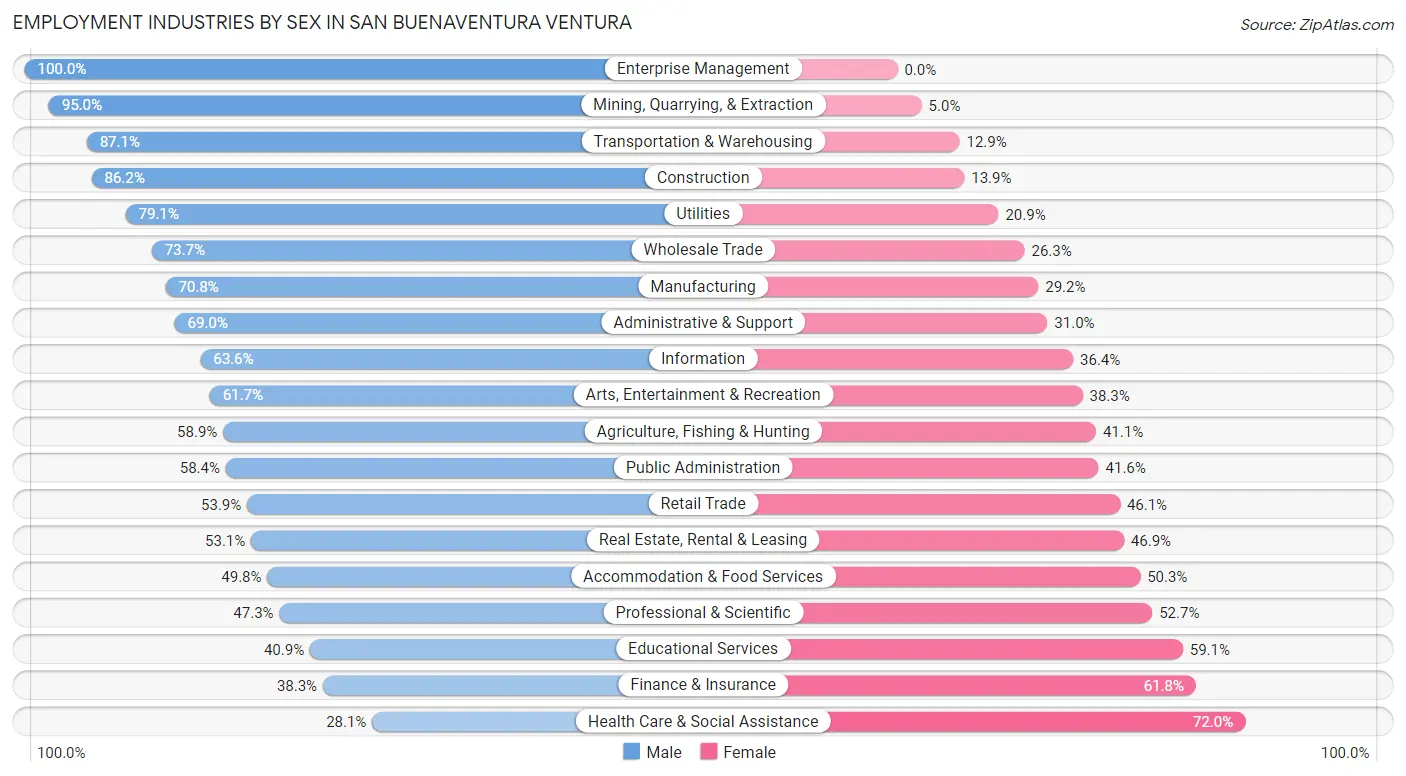
Employment Industries by Sex in San Buenaventura Ventura
The San Buenaventura Ventura industries that see more men than women are Enterprise Management (100.0%), Mining, Quarrying, & Extraction (95.0%), and Transportation & Warehousing (87.1%), whereas the industries that tend to have a higher number of women are Health Care & Social Assistance (72.0%), Finance & Insurance (61.8%), and Educational Services (59.1%).
| Industry | Male | Female |
| Agriculture, Fishing & Hunting | 430 (58.9%) | 300 (41.1%) |
| Mining, Quarrying, & Extraction | 227 (95.0%) | 12 (5.0%) |
| Construction | 3,229 (86.2%) | 519 (13.9%) |
| Manufacturing | 3,022 (70.8%) | 1,244 (29.2%) |
| Wholesale Trade | 1,036 (73.7%) | 370 (26.3%) |
| Retail Trade | 3,158 (53.9%) | 2,697 (46.1%) |
| Transportation & Warehousing | 1,592 (87.1%) | 235 (12.9%) |
| Utilities | 189 (79.1%) | 50 (20.9%) |
| Information | 768 (63.6%) | 439 (36.4%) |
| Finance & Insurance | 664 (38.3%) | 1,072 (61.8%) |
| Real Estate, Rental & Leasing | 536 (53.1%) | 473 (46.9%) |
| Professional & Scientific | 2,096 (47.3%) | 2,339 (52.7%) |
| Enterprise Management | 9 (100.0%) | 0 (0.0%) |
| Administrative & Support | 1,462 (69.0%) | 658 (31.0%) |
| Educational Services | 2,423 (40.9%) | 3,497 (59.1%) |
| Health Care & Social Assistance | 2,097 (28.1%) | 5,380 (72.0%) |
| Arts, Entertainment & Recreation | 1,025 (61.7%) | 637 (38.3%) |
| Accommodation & Food Services | 1,924 (49.7%) | 1,943 (50.2%) |
| Public Administration | 2,636 (58.4%) | 1,881 (41.6%) |
| Total | 29,839 (54.2%) | 25,218 (45.8%) |
Education in San Buenaventura Ventura
School Enrollment in San Buenaventura Ventura
The most common levels of schooling among the 25,758 students in San Buenaventura Ventura are high school (6,387 | 24.8%), college / undergraduate (5,528 | 21.5%), and elementary school (4,860 | 18.9%).
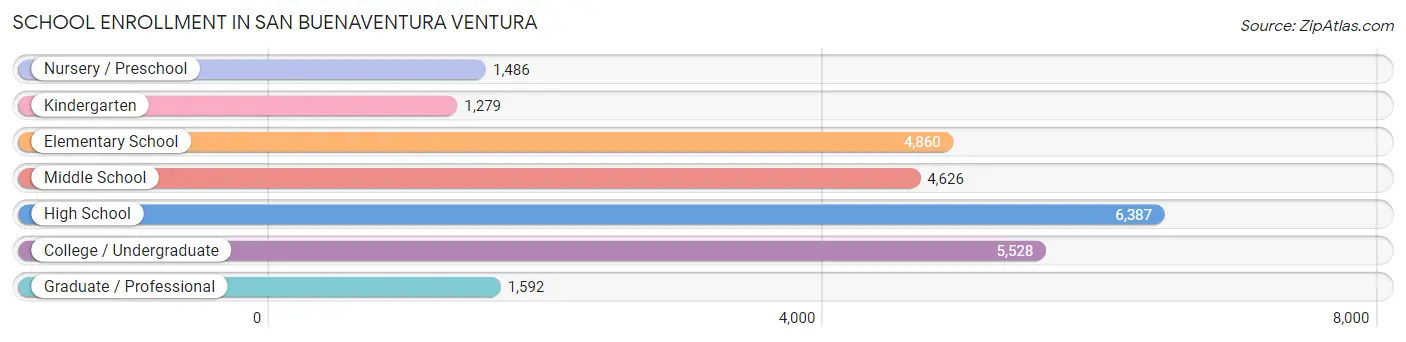
| School Level | # Students | % Students |
| Nursery / Preschool | 1,486 | 5.8% |
| Kindergarten | 1,279 | 5.0% |
| Elementary School | 4,860 | 18.9% |
| Middle School | 4,626 | 18.0% |
| High School | 6,387 | 24.8% |
| College / Undergraduate | 5,528 | 21.5% |
| Graduate / Professional | 1,592 | 6.2% |
| Total | 25,758 | 100.0% |
School Enrollment by Age by Funding Source in San Buenaventura Ventura
Out of a total of 25,758 students who are enrolled in schools in San Buenaventura Ventura, 3,967 (15.4%) attend a private institution, while the remaining 21,791 (84.6%) are enrolled in public schools. The age group of 3 to 4 year olds has the highest likelihood of being enrolled in private schools, with 532 (58.8% in the age bracket) enrolled. Conversely, the age group of 18 to 19 year olds has the lowest likelihood of being enrolled in a private school, with 1,929 (98.9% in the age bracket) attending a public institution.
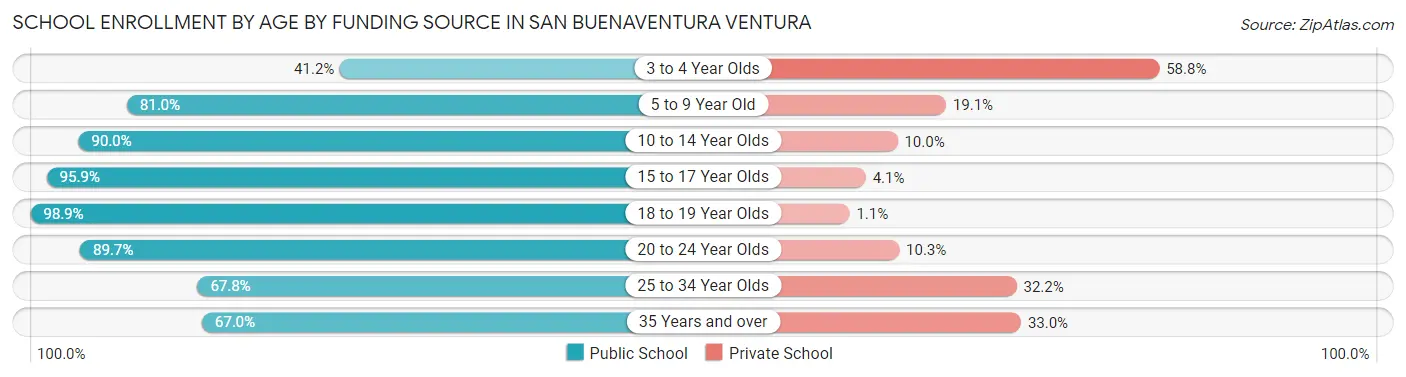
| Age Bracket | Public School | Private School |
| 3 to 4 Year Olds | 373 (41.2%) | 532 (58.8%) |
| 5 to 9 Year Old | 4,992 (80.9%) | 1,175 (19.1%) |
| 10 to 14 Year Olds | 5,209 (90.0%) | 580 (10.0%) |
| 15 to 17 Year Olds | 4,409 (95.9%) | 189 (4.1%) |
| 18 to 19 Year Olds | 1,929 (98.9%) | 21 (1.1%) |
| 20 to 24 Year Olds | 2,387 (89.7%) | 275 (10.3%) |
| 25 to 34 Year Olds | 1,360 (67.8%) | 646 (32.2%) |
| 35 Years and over | 1,126 (67.0%) | 555 (33.0%) |
| Total | 21,791 (84.6%) | 3,967 (15.4%) |
Educational Attainment by Field of Study in San Buenaventura Ventura
Business (4,816 | 14.2%), social sciences (4,121 | 12.2%), bio, nature & agricultural (3,126 | 9.2%), engineering (2,655 | 7.8%), and education (2,655 | 7.8%) are the most common fields of study among 33,881 individuals in San Buenaventura Ventura who have obtained a bachelor's degree or higher.
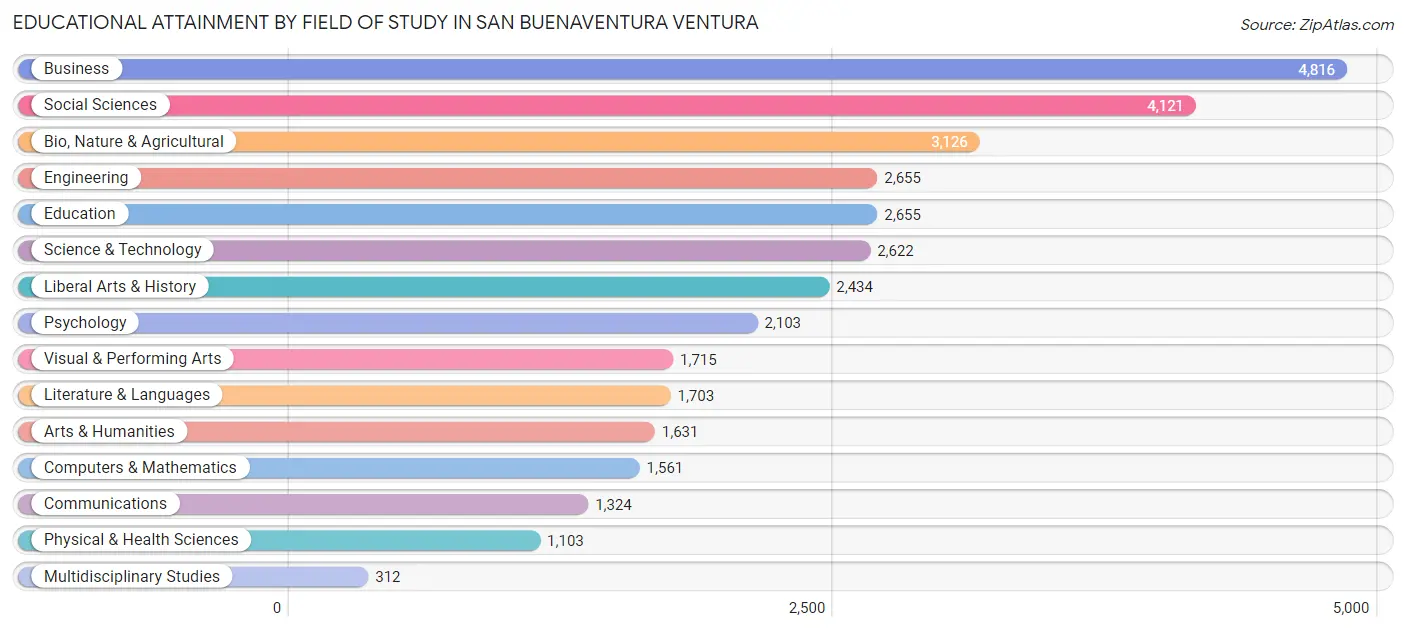
| Field of Study | # Graduates | % Graduates |
| Computers & Mathematics | 1,561 | 4.6% |
| Bio, Nature & Agricultural | 3,126 | 9.2% |
| Physical & Health Sciences | 1,103 | 3.3% |
| Psychology | 2,103 | 6.2% |
| Social Sciences | 4,121 | 12.2% |
| Engineering | 2,655 | 7.8% |
| Multidisciplinary Studies | 312 | 0.9% |
| Science & Technology | 2,622 | 7.7% |
| Business | 4,816 | 14.2% |
| Education | 2,655 | 7.8% |
| Literature & Languages | 1,703 | 5.0% |
| Liberal Arts & History | 2,434 | 7.2% |
| Visual & Performing Arts | 1,715 | 5.1% |
| Communications | 1,324 | 3.9% |
| Arts & Humanities | 1,631 | 4.8% |
| Total | 33,881 | 100.0% |
Transportation & Commute in San Buenaventura Ventura
Vehicle Availability by Sex in San Buenaventura Ventura
The most prevalent vehicle ownership categories in San Buenaventura Ventura are males with 2 vehicles (12,783, accounting for 43.9%) and females with 2 vehicles (9,907, making up 52.5%).
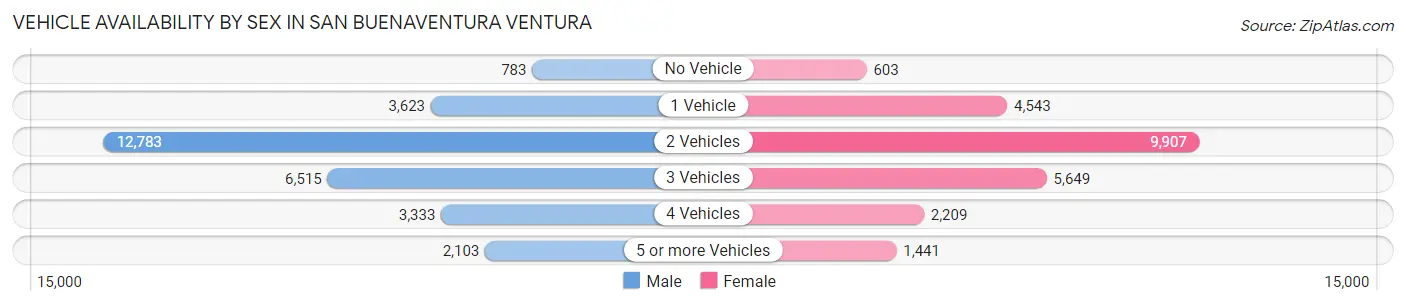
| Vehicles Available | Male | Female |
| No Vehicle | 783 (2.7%) | 603 (2.5%) |
| 1 Vehicle | 3,623 (12.4%) | 4,543 (18.7%) |
| 2 Vehicles | 12,783 (43.9%) | 9,907 (40.7%) |
| 3 Vehicles | 6,515 (22.4%) | 5,649 (23.2%) |
| 4 Vehicles | 3,333 (11.4%) | 2,209 (9.1%) |
| 5 or more Vehicles | 2,103 (7.2%) | 1,441 (5.9%) |
| Total | 29,140 (100.0%) | 24,352 (100.0%) |
Commute Time in San Buenaventura Ventura
The most frequently occuring commute durations in San Buenaventura Ventura are 10 to 14 minutes (8,719 commuters, 18.7%), 15 to 19 minutes (8,044 commuters, 17.2%), and 20 to 24 minutes (5,663 commuters, 12.1%).
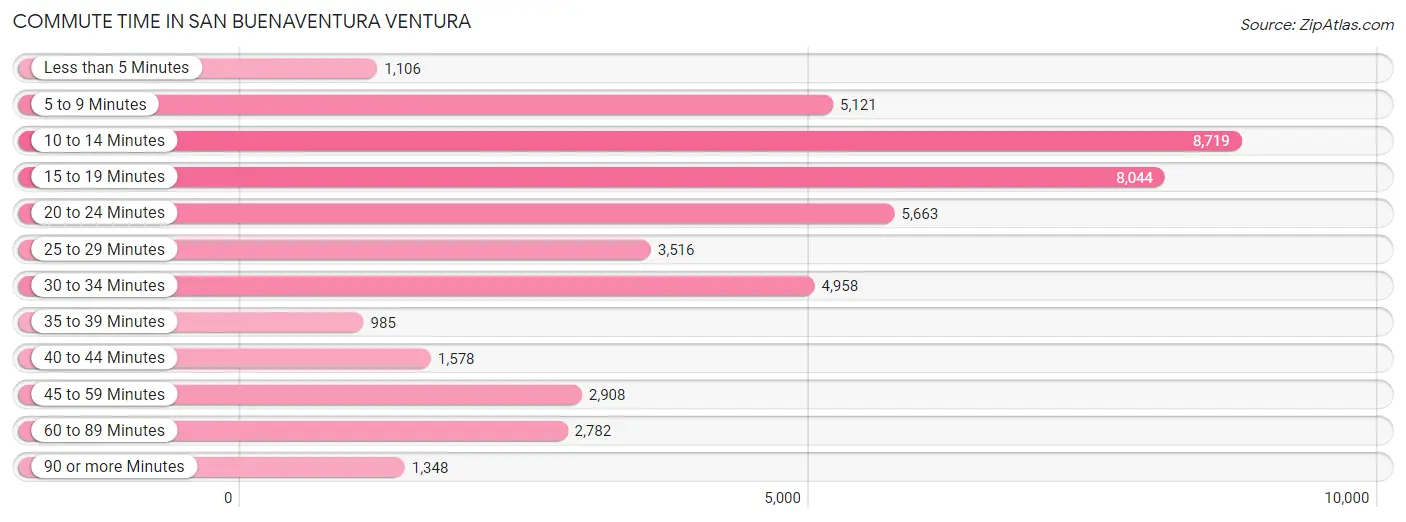
| Commute Time | # Commuters | % Commuters |
| Less than 5 Minutes | 1,106 | 2.4% |
| 5 to 9 Minutes | 5,121 | 11.0% |
| 10 to 14 Minutes | 8,719 | 18.7% |
| 15 to 19 Minutes | 8,044 | 17.2% |
| 20 to 24 Minutes | 5,663 | 12.1% |
| 25 to 29 Minutes | 3,516 | 7.5% |
| 30 to 34 Minutes | 4,958 | 10.6% |
| 35 to 39 Minutes | 985 | 2.1% |
| 40 to 44 Minutes | 1,578 | 3.4% |
| 45 to 59 Minutes | 2,908 | 6.2% |
| 60 to 89 Minutes | 2,782 | 5.9% |
| 90 or more Minutes | 1,348 | 2.9% |
Commute Time by Sex in San Buenaventura Ventura
The most common commute times in San Buenaventura Ventura are 10 to 14 minutes (4,746 commuters, 18.2%) for males and 10 to 14 minutes (3,973 commuters, 19.2%) for females.
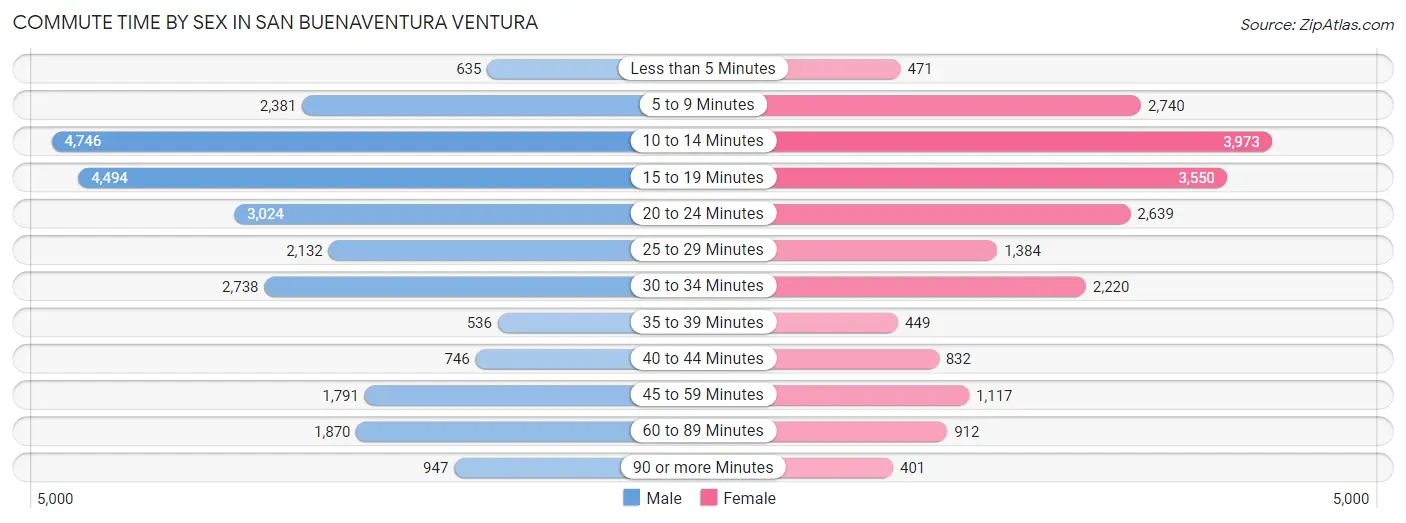
| Commute Time | Male | Female |
| Less than 5 Minutes | 635 (2.4%) | 471 (2.3%) |
| 5 to 9 Minutes | 2,381 (9.1%) | 2,740 (13.2%) |
| 10 to 14 Minutes | 4,746 (18.2%) | 3,973 (19.2%) |
| 15 to 19 Minutes | 4,494 (17.3%) | 3,550 (17.2%) |
| 20 to 24 Minutes | 3,024 (11.6%) | 2,639 (12.8%) |
| 25 to 29 Minutes | 2,132 (8.2%) | 1,384 (6.7%) |
| 30 to 34 Minutes | 2,738 (10.5%) | 2,220 (10.7%) |
| 35 to 39 Minutes | 536 (2.1%) | 449 (2.2%) |
| 40 to 44 Minutes | 746 (2.9%) | 832 (4.0%) |
| 45 to 59 Minutes | 1,791 (6.9%) | 1,117 (5.4%) |
| 60 to 89 Minutes | 1,870 (7.2%) | 912 (4.4%) |
| 90 or more Minutes | 947 (3.6%) | 401 (1.9%) |
Time of Departure to Work by Sex in San Buenaventura Ventura
The most frequent times of departure to work in San Buenaventura Ventura are 7:00 AM to 7:29 AM (3,760, 14.4%) for males and 7:30 AM to 7:59 AM (3,269, 15.8%) for females.
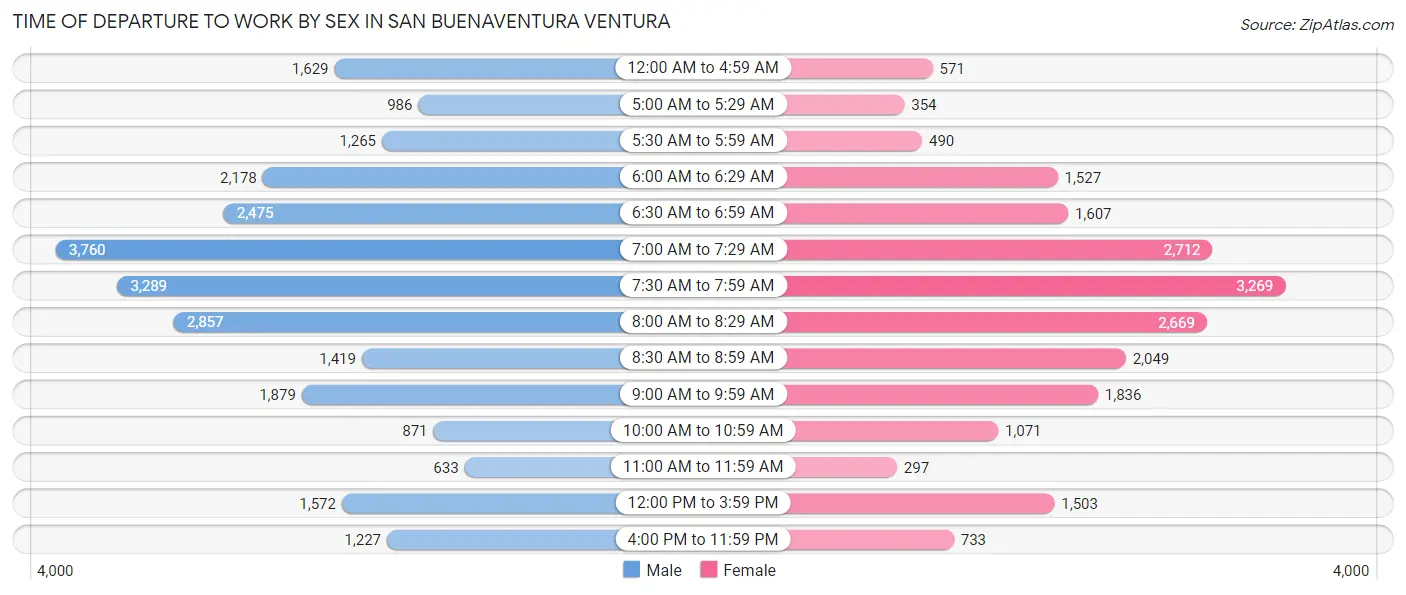
| Time of Departure | Male | Female |
| 12:00 AM to 4:59 AM | 1,629 (6.3%) | 571 (2.8%) |
| 5:00 AM to 5:29 AM | 986 (3.8%) | 354 (1.7%) |
| 5:30 AM to 5:59 AM | 1,265 (4.9%) | 490 (2.4%) |
| 6:00 AM to 6:29 AM | 2,178 (8.4%) | 1,527 (7.4%) |
| 6:30 AM to 6:59 AM | 2,475 (9.5%) | 1,607 (7.8%) |
| 7:00 AM to 7:29 AM | 3,760 (14.4%) | 2,712 (13.1%) |
| 7:30 AM to 7:59 AM | 3,289 (12.6%) | 3,269 (15.8%) |
| 8:00 AM to 8:29 AM | 2,857 (11.0%) | 2,669 (12.9%) |
| 8:30 AM to 8:59 AM | 1,419 (5.4%) | 2,049 (9.9%) |
| 9:00 AM to 9:59 AM | 1,879 (7.2%) | 1,836 (8.9%) |
| 10:00 AM to 10:59 AM | 871 (3.3%) | 1,071 (5.2%) |
| 11:00 AM to 11:59 AM | 633 (2.4%) | 297 (1.4%) |
| 12:00 PM to 3:59 PM | 1,572 (6.0%) | 1,503 (7.3%) |
| 4:00 PM to 11:59 PM | 1,227 (4.7%) | 733 (3.5%) |
| Total | 26,040 (100.0%) | 20,688 (100.0%) |
Housing Occupancy in San Buenaventura Ventura
Occupancy by Ownership in San Buenaventura Ventura
Of the total 41,954 dwellings in San Buenaventura Ventura, owner-occupied units account for 23,714 (56.5%), while renter-occupied units make up 18,240 (43.5%).
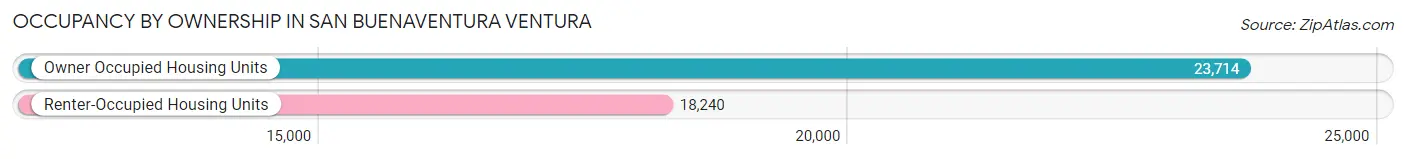
| Occupancy | # Housing Units | % Housing Units |
| Owner Occupied Housing Units | 23,714 | 56.5% |
| Renter-Occupied Housing Units | 18,240 | 43.5% |
| Total Occupied Housing Units | 41,954 | 100.0% |
Occupancy by Household Size in San Buenaventura Ventura
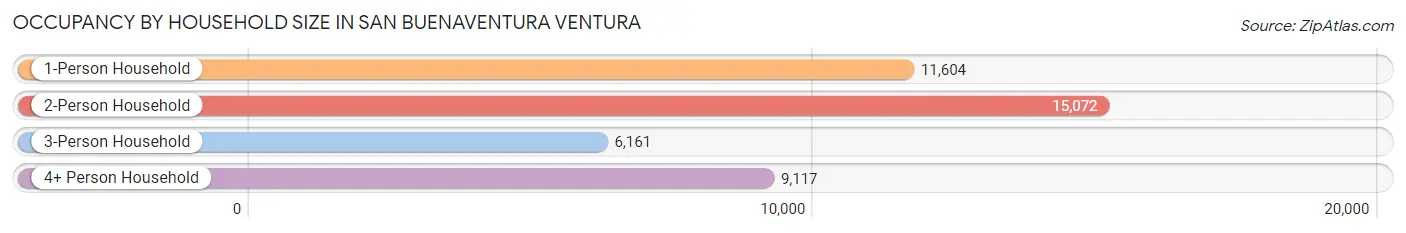
| Household Size | # Housing Units | % Housing Units |
| 1-Person Household | 11,604 | 27.7% |
| 2-Person Household | 15,072 | 35.9% |
| 3-Person Household | 6,161 | 14.7% |
| 4+ Person Household | 9,117 | 21.7% |
| Total Housing Units | 41,954 | 100.0% |
Occupancy by Ownership by Household Size in San Buenaventura Ventura
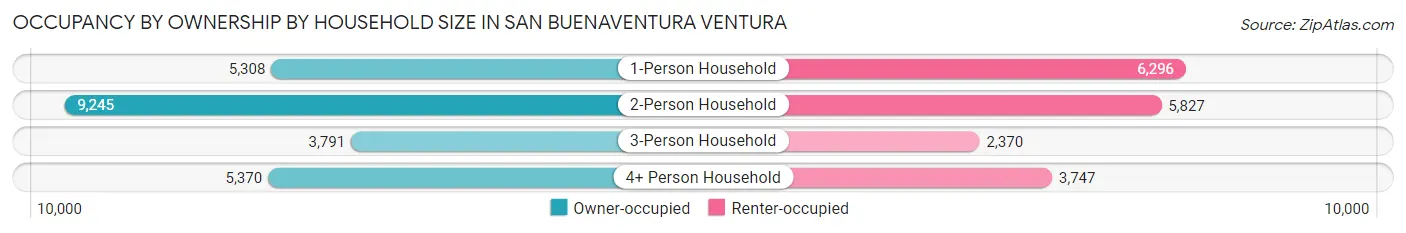
| Household Size | Owner-occupied | Renter-occupied |
| 1-Person Household | 5,308 (45.7%) | 6,296 (54.3%) |
| 2-Person Household | 9,245 (61.3%) | 5,827 (38.7%) |
| 3-Person Household | 3,791 (61.5%) | 2,370 (38.5%) |
| 4+ Person Household | 5,370 (58.9%) | 3,747 (41.1%) |
| Total Housing Units | 23,714 (56.5%) | 18,240 (43.5%) |
Occupancy by Educational Attainment in San Buenaventura Ventura
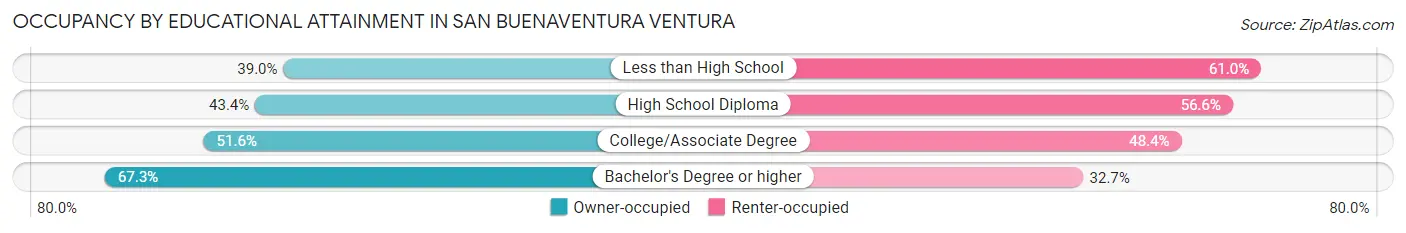
| Household Size | Owner-occupied | Renter-occupied |
| Less than High School | 1,144 (39.0%) | 1,792 (61.0%) |
| High School Diploma | 2,405 (43.4%) | 3,132 (56.6%) |
| College/Associate Degree | 7,749 (51.6%) | 7,272 (48.4%) |
| Bachelor's Degree or higher | 12,416 (67.3%) | 6,044 (32.7%) |
Occupancy by Age of Householder in San Buenaventura Ventura
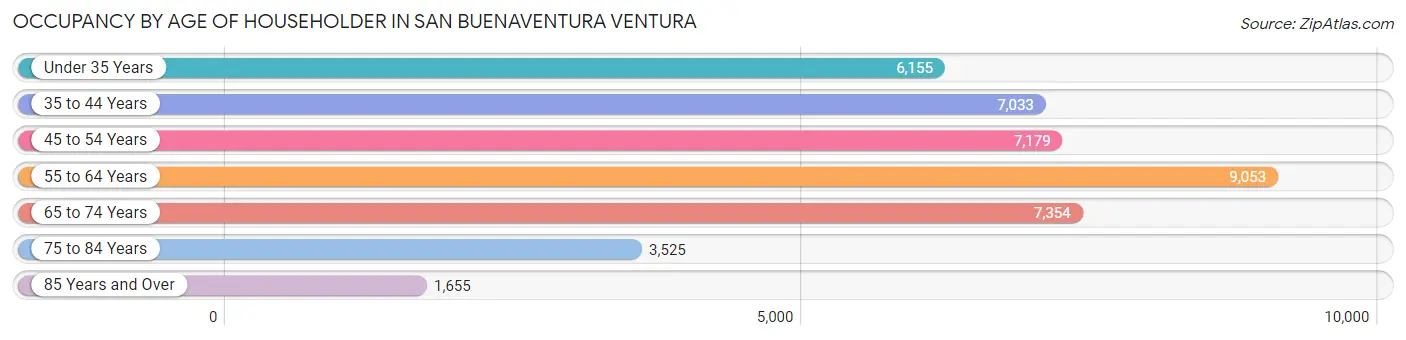
| Age Bracket | # Households | % Households |
| Under 35 Years | 6,155 | 14.7% |
| 35 to 44 Years | 7,033 | 16.8% |
| 45 to 54 Years | 7,179 | 17.1% |
| 55 to 64 Years | 9,053 | 21.6% |
| 65 to 74 Years | 7,354 | 17.5% |
| 75 to 84 Years | 3,525 | 8.4% |
| 85 Years and Over | 1,655 | 3.9% |
| Total | 41,954 | 100.0% |
Housing Finances in San Buenaventura Ventura
Median Income by Occupancy in San Buenaventura Ventura
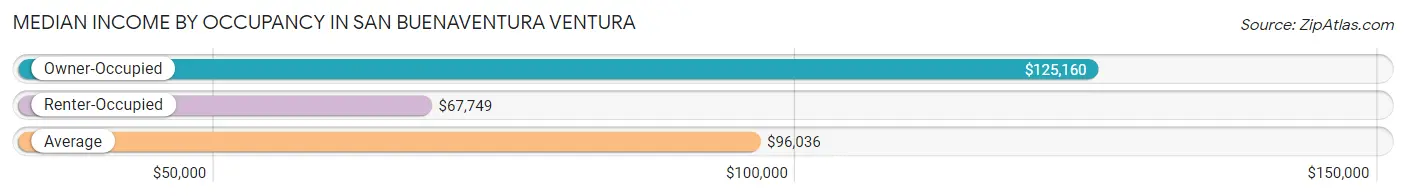
| Occupancy Type | # Households | Median Income |
| Owner-Occupied | 23,714 (56.5%) | $125,160 |
| Renter-Occupied | 18,240 (43.5%) | $67,749 |
| Average | 41,954 (100.0%) | $96,036 |
Occupancy by Householder Income Bracket in San Buenaventura Ventura
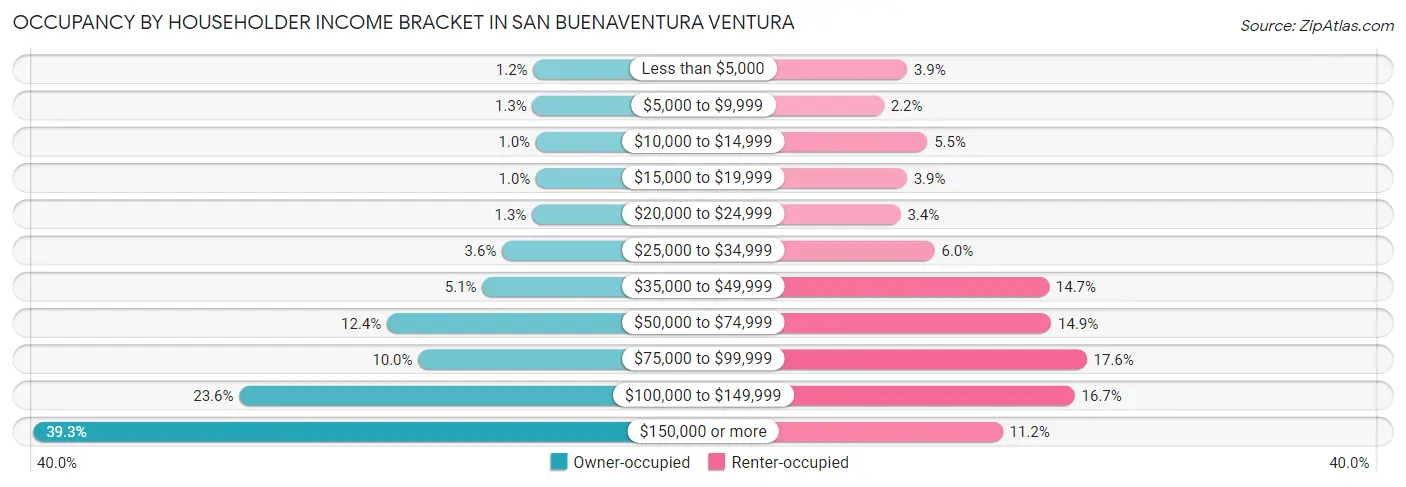
| Income Bracket | Owner-occupied | Renter-occupied |
| Less than $5,000 | 292 (1.2%) | 715 (3.9%) |
| $5,000 to $9,999 | 305 (1.3%) | 393 (2.1%) |
| $10,000 to $14,999 | 247 (1.0%) | 995 (5.5%) |
| $15,000 to $19,999 | 241 (1.0%) | 712 (3.9%) |
| $20,000 to $24,999 | 316 (1.3%) | 625 (3.4%) |
| $25,000 to $34,999 | 856 (3.6%) | 1,098 (6.0%) |
| $35,000 to $49,999 | 1,214 (5.1%) | 2,687 (14.7%) |
| $50,000 to $74,999 | 2,935 (12.4%) | 2,717 (14.9%) |
| $75,000 to $99,999 | 2,371 (10.0%) | 3,211 (17.6%) |
| $100,000 to $149,999 | 5,607 (23.6%) | 3,045 (16.7%) |
| $150,000 or more | 9,330 (39.3%) | 2,042 (11.2%) |
| Total | 23,714 (100.0%) | 18,240 (100.0%) |
Monthly Housing Cost Tiers in San Buenaventura Ventura
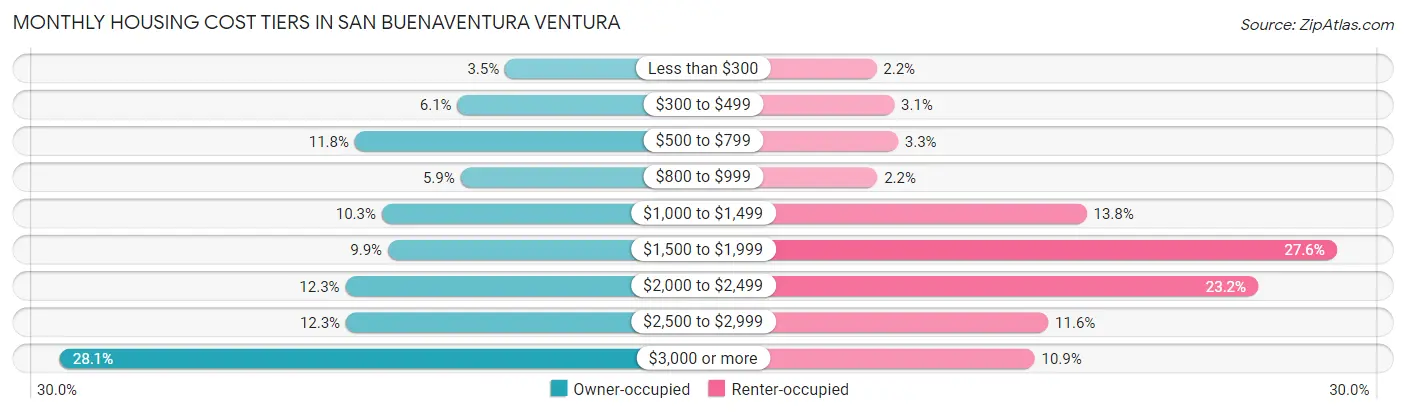
| Monthly Cost | Owner-occupied | Renter-occupied |
| Less than $300 | 821 (3.5%) | 392 (2.1%) |
| $300 to $499 | 1,443 (6.1%) | 571 (3.1%) |
| $500 to $799 | 2,788 (11.8%) | 610 (3.3%) |
| $800 to $999 | 1,403 (5.9%) | 401 (2.2%) |
| $1,000 to $1,499 | 2,436 (10.3%) | 2,510 (13.8%) |
| $1,500 to $1,999 | 2,354 (9.9%) | 5,029 (27.6%) |
| $2,000 to $2,499 | 2,912 (12.3%) | 4,236 (23.2%) |
| $2,500 to $2,999 | 2,905 (12.2%) | 2,124 (11.6%) |
| $3,000 or more | 6,652 (28.1%) | 1,987 (10.9%) |
| Total | 23,714 (100.0%) | 18,240 (100.0%) |
Physical Housing Characteristics in San Buenaventura Ventura
Housing Structures in San Buenaventura Ventura
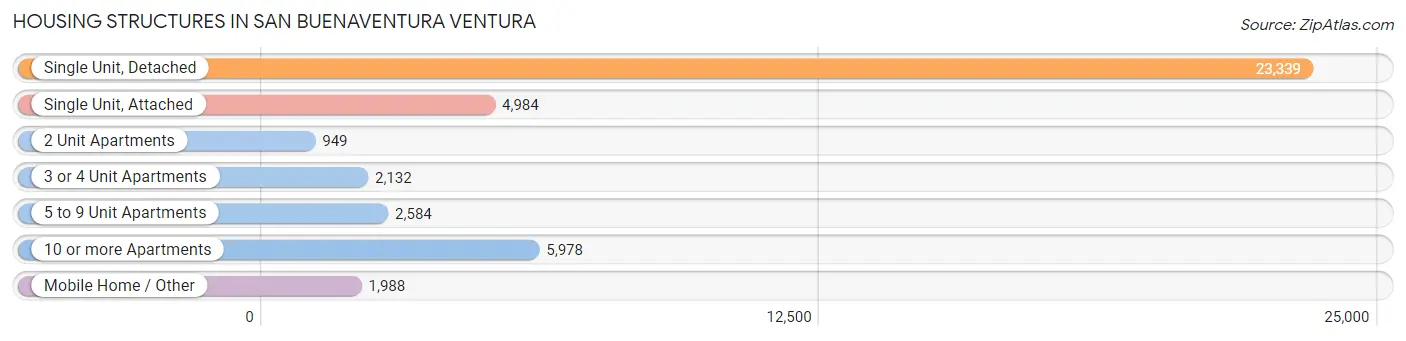
| Structure Type | # Housing Units | % Housing Units |
| Single Unit, Detached | 23,339 | 55.6% |
| Single Unit, Attached | 4,984 | 11.9% |
| 2 Unit Apartments | 949 | 2.3% |
| 3 or 4 Unit Apartments | 2,132 | 5.1% |
| 5 to 9 Unit Apartments | 2,584 | 6.2% |
| 10 or more Apartments | 5,978 | 14.2% |
| Mobile Home / Other | 1,988 | 4.7% |
| Total | 41,954 | 100.0% |
Housing Structures by Occupancy in San Buenaventura Ventura
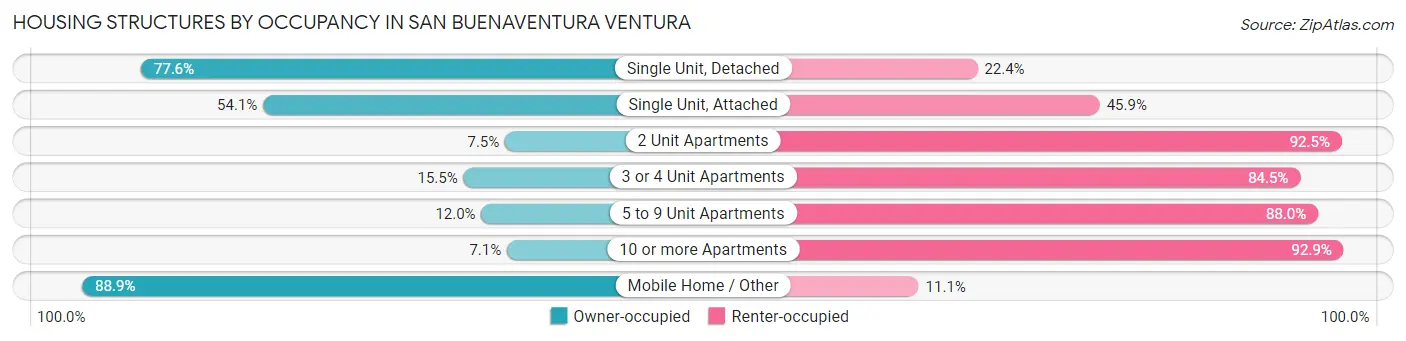
| Structure Type | Owner-occupied | Renter-occupied |
| Single Unit, Detached | 18,114 (77.6%) | 5,225 (22.4%) |
| Single Unit, Attached | 2,695 (54.1%) | 2,289 (45.9%) |
| 2 Unit Apartments | 71 (7.5%) | 878 (92.5%) |
| 3 or 4 Unit Apartments | 330 (15.5%) | 1,802 (84.5%) |
| 5 to 9 Unit Apartments | 311 (12.0%) | 2,273 (88.0%) |
| 10 or more Apartments | 425 (7.1%) | 5,553 (92.9%) |
| Mobile Home / Other | 1,768 (88.9%) | 220 (11.1%) |
| Total | 23,714 (56.5%) | 18,240 (43.5%) |
Housing Structures by Number of Rooms in San Buenaventura Ventura
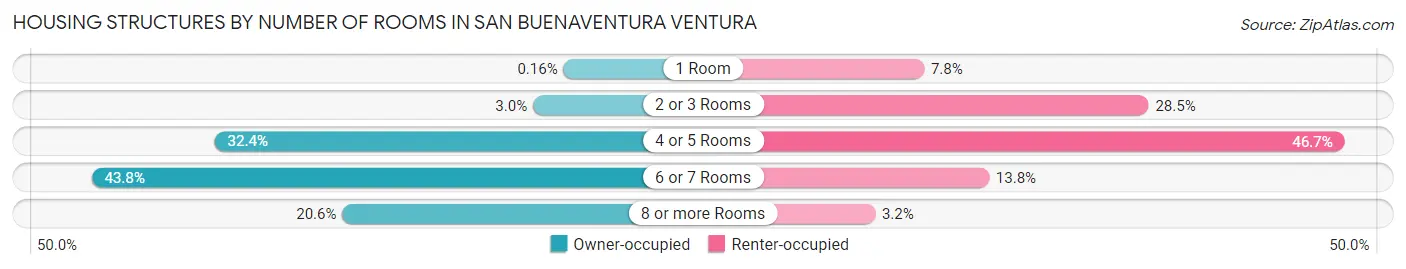
| Number of Rooms | Owner-occupied | Renter-occupied |
| 1 Room | 39 (0.2%) | 1,418 (7.8%) |
| 2 or 3 Rooms | 707 (3.0%) | 5,205 (28.5%) |
| 4 or 5 Rooms | 7,689 (32.4%) | 8,512 (46.7%) |
| 6 or 7 Rooms | 10,390 (43.8%) | 2,514 (13.8%) |
| 8 or more Rooms | 4,889 (20.6%) | 591 (3.2%) |
| Total | 23,714 (100.0%) | 18,240 (100.0%) |
Housing Structure by Heating Type in San Buenaventura Ventura
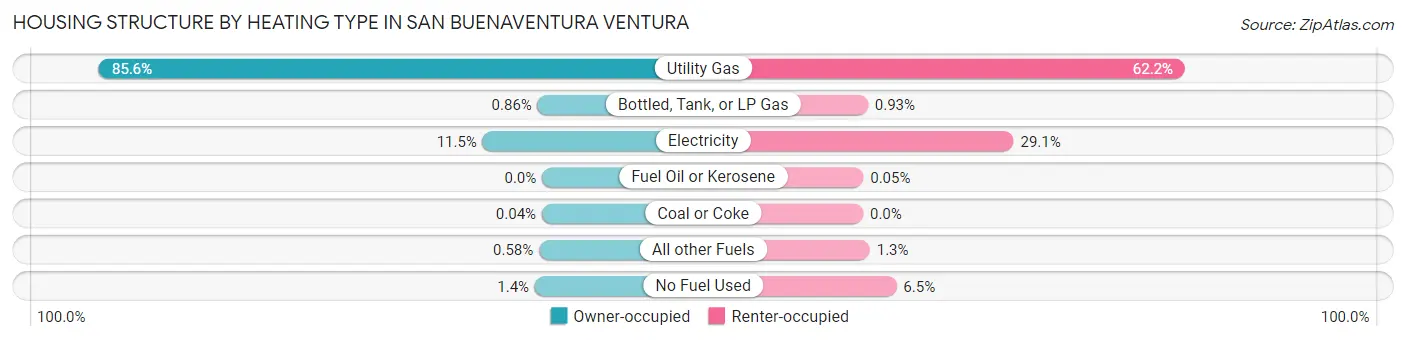
| Heating Type | Owner-occupied | Renter-occupied |
| Utility Gas | 20,309 (85.6%) | 11,343 (62.2%) |
| Bottled, Tank, or LP Gas | 205 (0.9%) | 169 (0.9%) |
| Electricity | 2,722 (11.5%) | 5,305 (29.1%) |
| Fuel Oil or Kerosene | 0 (0.0%) | 10 (0.1%) |
| Coal or Coke | 10 (0.0%) | 0 (0.0%) |
| All other Fuels | 138 (0.6%) | 237 (1.3%) |
| No Fuel Used | 330 (1.4%) | 1,176 (6.5%) |
| Total | 23,714 (100.0%) | 18,240 (100.0%) |
Household Vehicle Usage in San Buenaventura Ventura
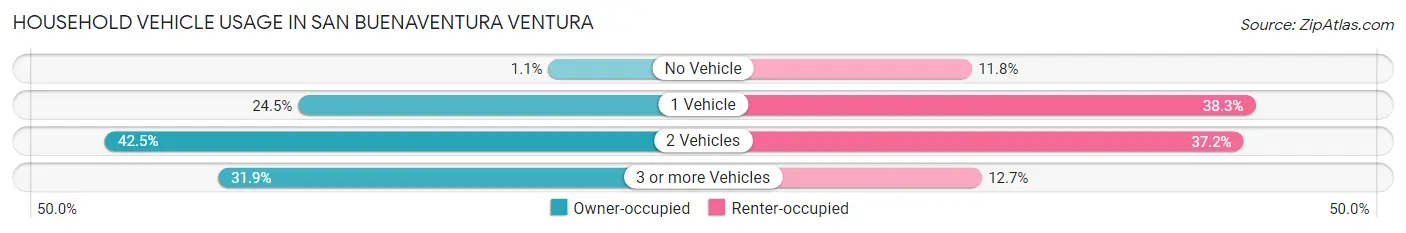
| Vehicles per Household | Owner-occupied | Renter-occupied |
| No Vehicle | 262 (1.1%) | 2,150 (11.8%) |
| 1 Vehicle | 5,801 (24.5%) | 6,984 (38.3%) |
| 2 Vehicles | 10,076 (42.5%) | 6,785 (37.2%) |
| 3 or more Vehicles | 7,575 (31.9%) | 2,321 (12.7%) |
| Total | 23,714 (100.0%) | 18,240 (100.0%) |
Real Estate & Mortgages in San Buenaventura Ventura
Real Estate and Mortgage Overview in San Buenaventura Ventura
| Characteristic | Without Mortgage | With Mortgage |
| Housing Units | 7,855 | 15,859 |
| Median Property Value | $662,200 | $736,800 |
| Median Household Income | $90,352 | $7,187 |
| Monthly Housing Costs | $712 | $6,610 |
| Real Estate Taxes | $3,031 | $293 |
Property Value by Mortgage Status in San Buenaventura Ventura
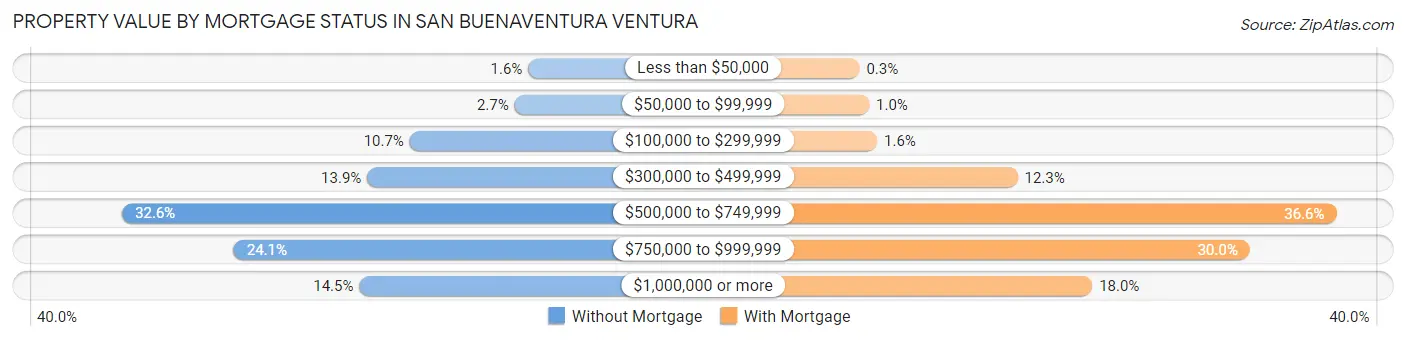
| Property Value | Without Mortgage | With Mortgage |
| Less than $50,000 | 128 (1.6%) | 48 (0.3%) |
| $50,000 to $99,999 | 210 (2.7%) | 163 (1.0%) |
| $100,000 to $299,999 | 837 (10.7%) | 260 (1.6%) |
| $300,000 to $499,999 | 1,092 (13.9%) | 1,957 (12.3%) |
| $500,000 to $749,999 | 2,559 (32.6%) | 5,809 (36.6%) |
| $750,000 to $999,999 | 1,890 (24.1%) | 4,762 (30.0%) |
| $1,000,000 or more | 1,139 (14.5%) | 2,860 (18.0%) |
| Total | 7,855 (100.0%) | 15,859 (100.0%) |
Household Income by Mortgage Status in San Buenaventura Ventura
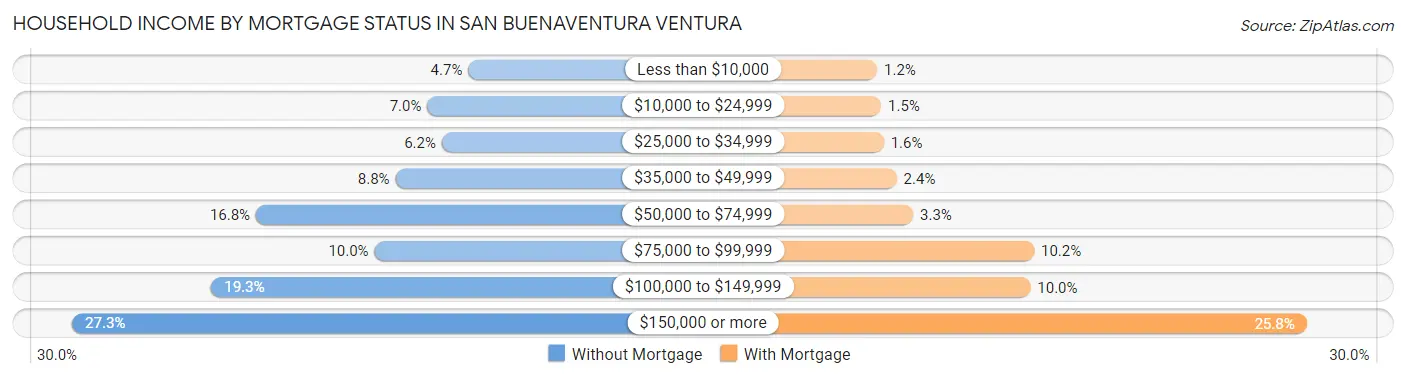
| Household Income | Without Mortgage | With Mortgage |
| Less than $10,000 | 365 (4.6%) | 195 (1.2%) |
| $10,000 to $24,999 | 549 (7.0%) | 232 (1.5%) |
| $25,000 to $34,999 | 484 (6.2%) | 255 (1.6%) |
| $35,000 to $49,999 | 692 (8.8%) | 372 (2.4%) |
| $50,000 to $74,999 | 1,318 (16.8%) | 522 (3.3%) |
| $75,000 to $99,999 | 786 (10.0%) | 1,617 (10.2%) |
| $100,000 to $149,999 | 1,518 (19.3%) | 1,585 (10.0%) |
| $150,000 or more | 2,143 (27.3%) | 4,089 (25.8%) |
| Total | 7,855 (100.0%) | 15,859 (100.0%) |
Property Value to Household Income Ratio in San Buenaventura Ventura
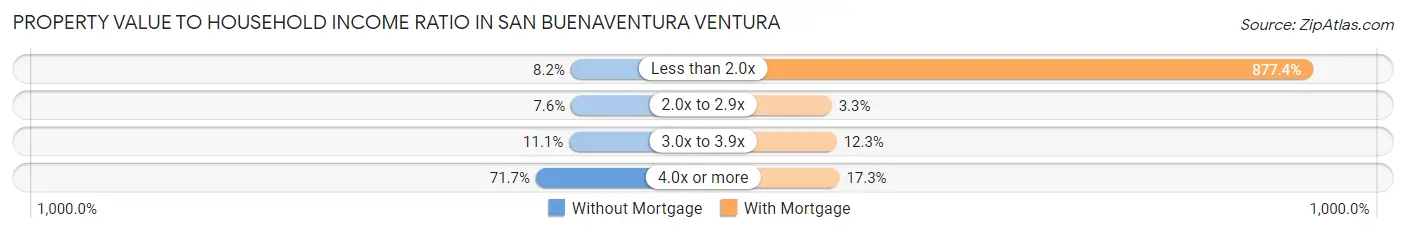
| Value-to-Income Ratio | Without Mortgage | With Mortgage |
| Less than 2.0x | 643 (8.2%) | 139,147 (877.4%) |
| 2.0x to 2.9x | 596 (7.6%) | 524 (3.3%) |
| 3.0x to 3.9x | 871 (11.1%) | 1,956 (12.3%) |
| 4.0x or more | 5,629 (71.7%) | 2,746 (17.3%) |
| Total | 7,855 (100.0%) | 15,859 (100.0%) |
Real Estate Taxes by Mortgage Status in San Buenaventura Ventura
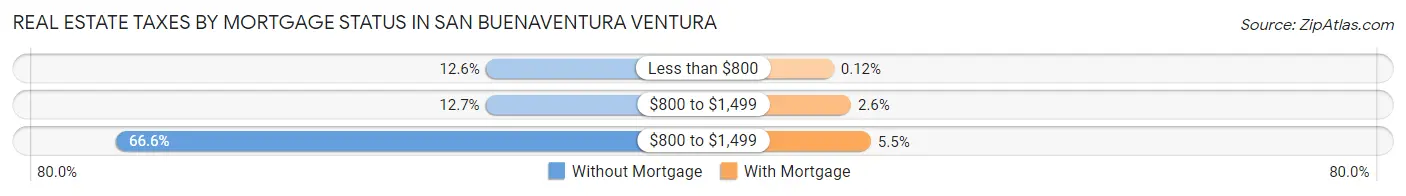
| Property Taxes | Without Mortgage | With Mortgage |
| Less than $800 | 993 (12.6%) | 19 (0.1%) |
| $800 to $1,499 | 995 (12.7%) | 417 (2.6%) |
| $800 to $1,499 | 5,233 (66.6%) | 877 (5.5%) |
| Total | 7,855 (100.0%) | 15,859 (100.0%) |
Health & Disability in San Buenaventura Ventura
Health Insurance Coverage by Age in San Buenaventura Ventura
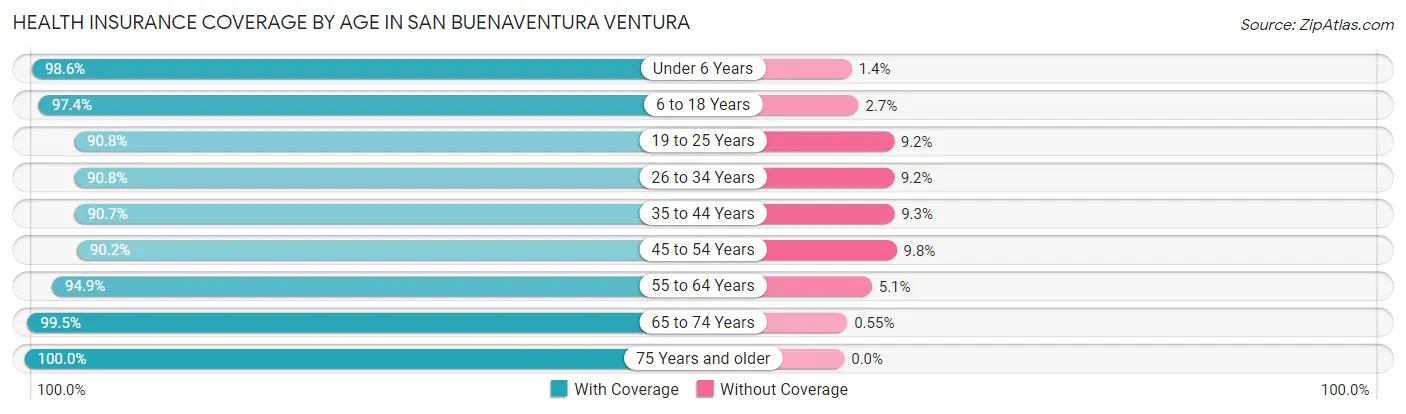
| Age Bracket | With Coverage | Without Coverage |
| Under 6 Years | 6,784 (98.6%) | 95 (1.4%) |
| 6 to 18 Years | 16,612 (97.4%) | 452 (2.6%) |
| 19 to 25 Years | 7,332 (90.8%) | 746 (9.2%) |
| 26 to 34 Years | 12,176 (90.8%) | 1,237 (9.2%) |
| 35 to 44 Years | 12,640 (90.7%) | 1,297 (9.3%) |
| 45 to 54 Years | 12,532 (90.2%) | 1,355 (9.8%) |
| 55 to 64 Years | 15,309 (94.9%) | 827 (5.1%) |
| 65 to 74 Years | 11,854 (99.5%) | 66 (0.5%) |
| 75 Years and older | 7,751 (100.0%) | 0 (0.0%) |
| Total | 102,990 (94.4%) | 6,075 (5.6%) |
Health Insurance Coverage by Citizenship Status in San Buenaventura Ventura
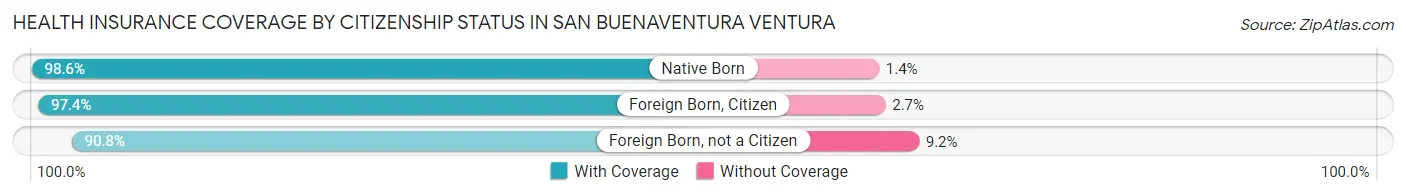
| Citizenship Status | With Coverage | Without Coverage |
| Native Born | 6,784 (98.6%) | 95 (1.4%) |
| Foreign Born, Citizen | 16,612 (97.4%) | 452 (2.6%) |
| Foreign Born, not a Citizen | 7,332 (90.8%) | 746 (9.2%) |
Health Insurance Coverage by Household Income in San Buenaventura Ventura
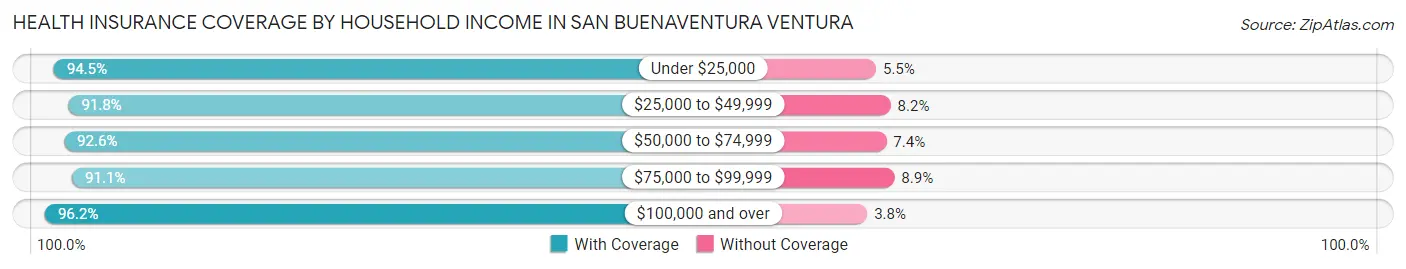
| Household Income | With Coverage | Without Coverage |
| Under $25,000 | 7,386 (94.5%) | 428 (5.5%) |
| $25,000 to $49,999 | 11,499 (91.8%) | 1,030 (8.2%) |
| $50,000 to $74,999 | 11,520 (92.6%) | 923 (7.4%) |
| $75,000 to $99,999 | 13,290 (91.1%) | 1,302 (8.9%) |
| $100,000 and over | 58,031 (96.2%) | 2,308 (3.8%) |
Public vs Private Health Insurance Coverage by Age in San Buenaventura Ventura
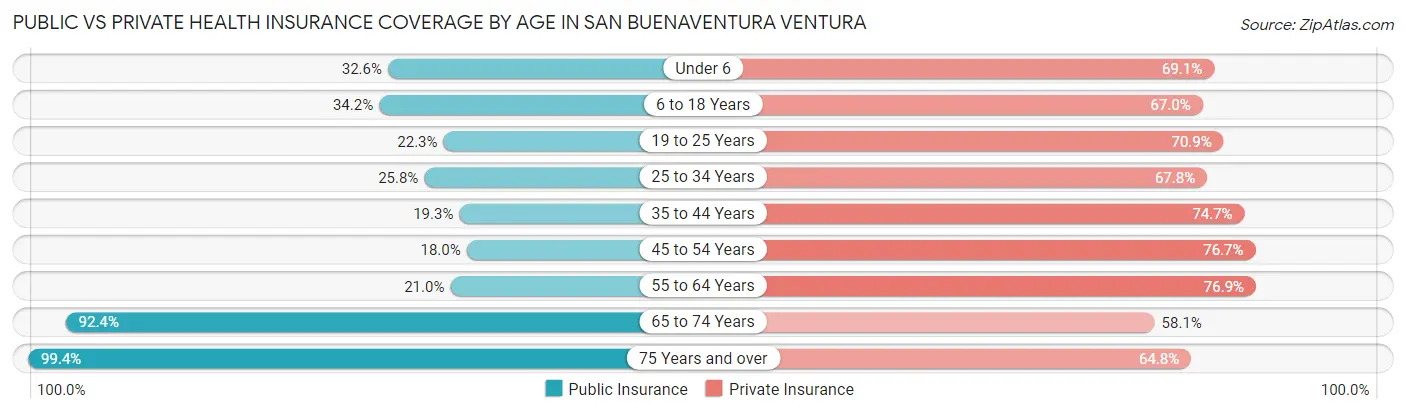
| Age Bracket | Public Insurance | Private Insurance |
| Under 6 | 2,241 (32.6%) | 4,752 (69.1%) |
| 6 to 18 Years | 5,839 (34.2%) | 11,427 (67.0%) |
| 19 to 25 Years | 1,799 (22.3%) | 5,723 (70.9%) |
| 25 to 34 Years | 3,464 (25.8%) | 9,092 (67.8%) |
| 35 to 44 Years | 2,694 (19.3%) | 10,415 (74.7%) |
| 45 to 54 Years | 2,494 (18.0%) | 10,657 (76.7%) |
| 55 to 64 Years | 3,388 (21.0%) | 12,402 (76.9%) |
| 65 to 74 Years | 11,012 (92.4%) | 6,922 (58.1%) |
| 75 Years and over | 7,703 (99.4%) | 5,024 (64.8%) |
| Total | 40,634 (37.3%) | 76,414 (70.1%) |
Disability Status by Sex by Age in San Buenaventura Ventura
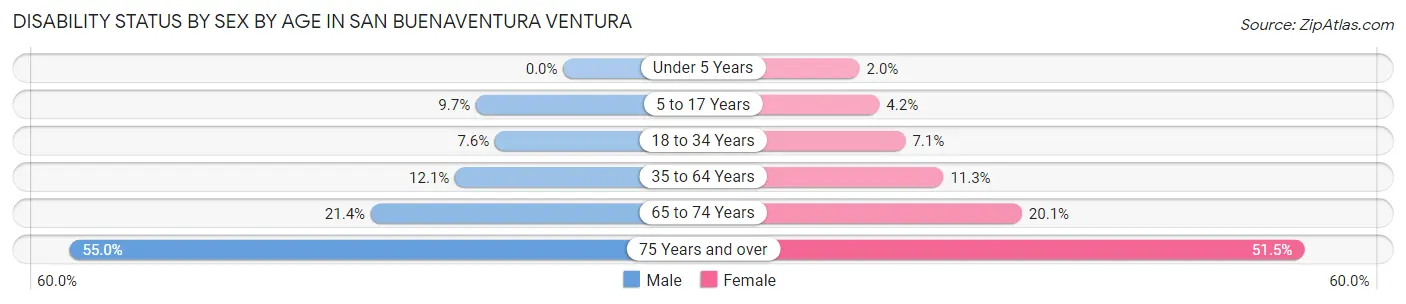
| Age Bracket | Male | Female |
| Under 5 Years | 0 (0.0%) | 56 (2.0%) |
| 5 to 17 Years | 819 (9.7%) | 356 (4.2%) |
| 18 to 34 Years | 907 (7.6%) | 792 (7.1%) |
| 35 to 64 Years | 2,721 (12.0%) | 2,420 (11.3%) |
| 65 to 74 Years | 1,197 (21.4%) | 1,271 (20.1%) |
| 75 Years and over | 1,727 (55.0%) | 2,374 (51.5%) |
Disability Class by Sex by Age in San Buenaventura Ventura
Disability Class: Hearing Difficulty
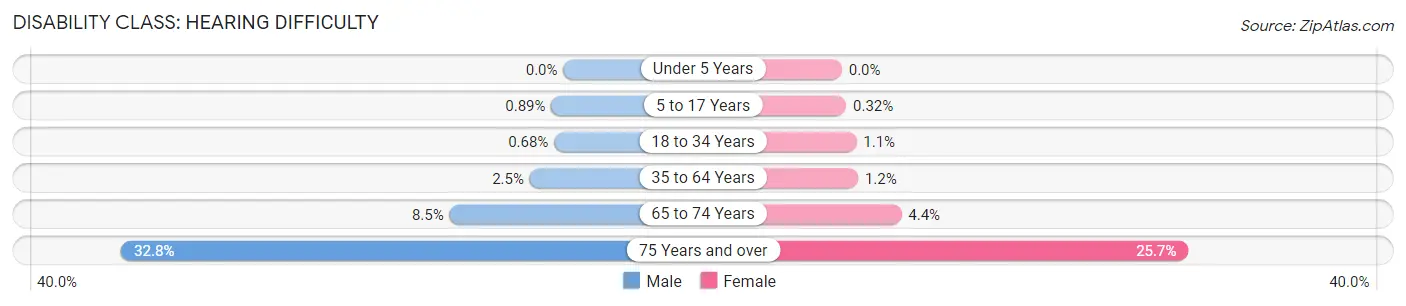
| Age Bracket | Male | Female |
| Under 5 Years | 0 (0.0%) | 0 (0.0%) |
| 5 to 17 Years | 75 (0.9%) | 27 (0.3%) |
| 18 to 34 Years | 81 (0.7%) | 121 (1.1%) |
| 35 to 64 Years | 563 (2.5%) | 257 (1.2%) |
| 65 to 74 Years | 472 (8.5%) | 280 (4.4%) |
| 75 Years and over | 1,031 (32.8%) | 1,186 (25.7%) |
Disability Class: Vision Difficulty
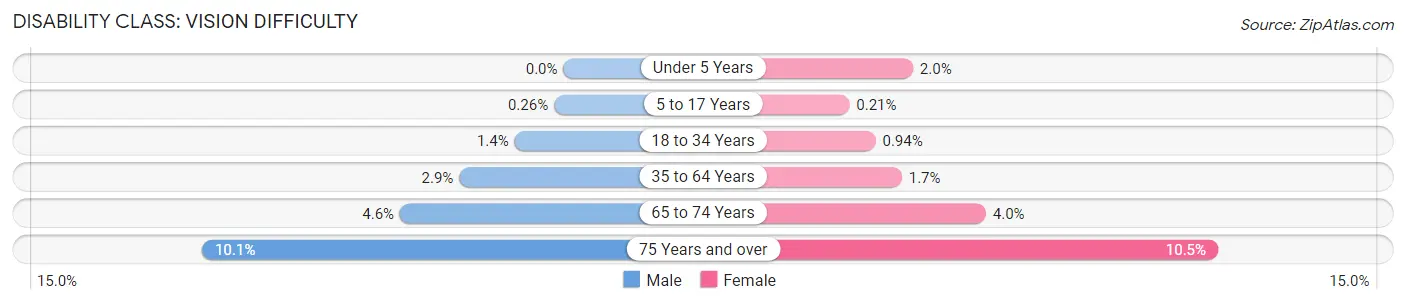
| Age Bracket | Male | Female |
| Under 5 Years | 0 (0.0%) | 56 (2.0%) |
| 5 to 17 Years | 22 (0.3%) | 18 (0.2%) |
| 18 to 34 Years | 162 (1.4%) | 105 (0.9%) |
| 35 to 64 Years | 655 (2.9%) | 358 (1.7%) |
| 65 to 74 Years | 254 (4.5%) | 254 (4.0%) |
| 75 Years and over | 316 (10.1%) | 483 (10.5%) |
Disability Class: Cognitive Difficulty
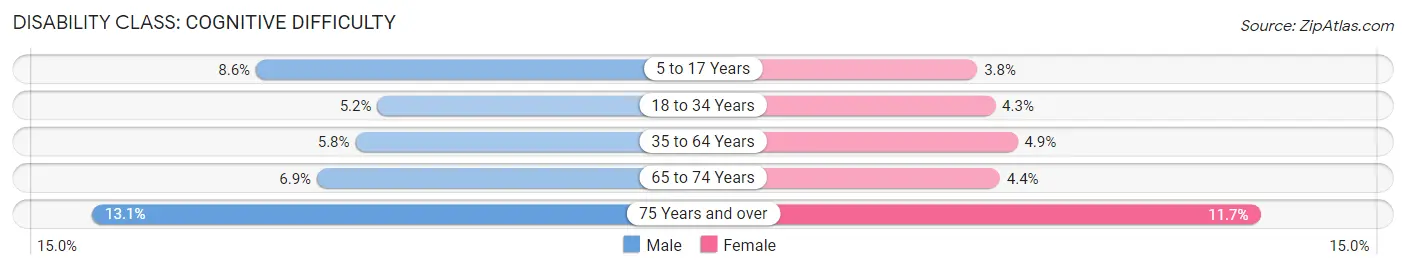
| Age Bracket | Male | Female |
| 5 to 17 Years | 721 (8.6%) | 321 (3.8%) |
| 18 to 34 Years | 618 (5.2%) | 477 (4.3%) |
| 35 to 64 Years | 1,308 (5.8%) | 1,046 (4.9%) |
| 65 to 74 Years | 383 (6.9%) | 279 (4.4%) |
| 75 Years and over | 412 (13.1%) | 537 (11.7%) |
Disability Class: Ambulatory Difficulty
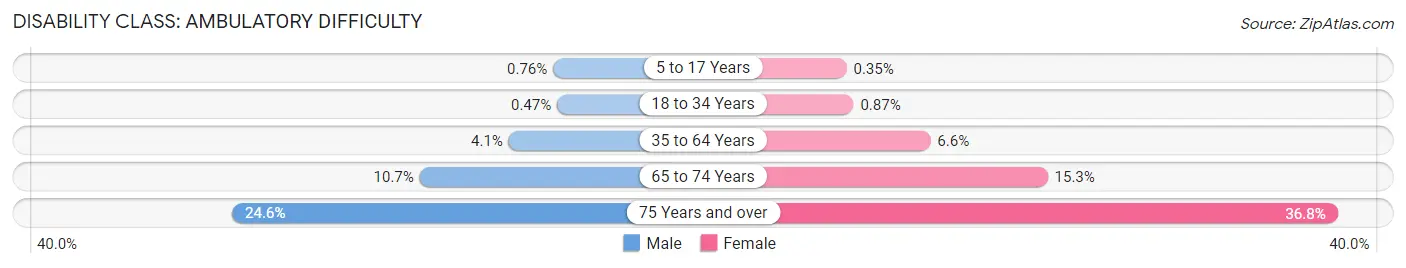
| Age Bracket | Male | Female |
| 5 to 17 Years | 64 (0.8%) | 30 (0.4%) |
| 18 to 34 Years | 56 (0.5%) | 97 (0.9%) |
| 35 to 64 Years | 917 (4.1%) | 1,406 (6.6%) |
| 65 to 74 Years | 596 (10.7%) | 968 (15.3%) |
| 75 Years and over | 772 (24.6%) | 1,697 (36.8%) |
Disability Class: Self-Care Difficulty
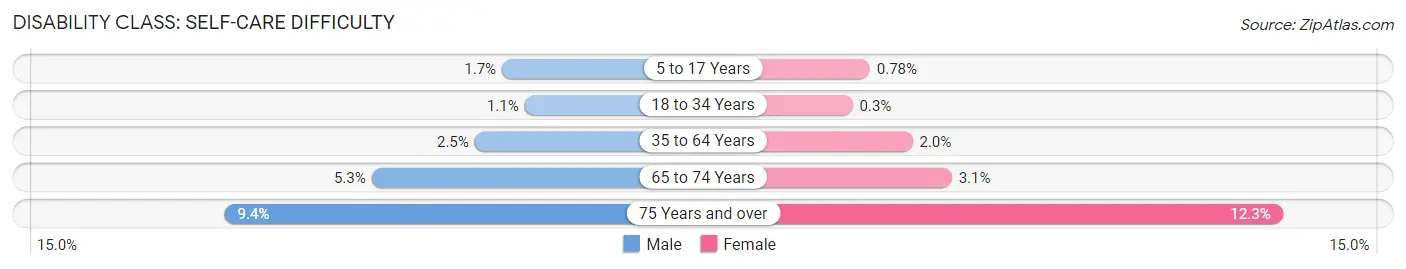
| Age Bracket | Male | Female |
| 5 to 17 Years | 144 (1.7%) | 66 (0.8%) |
| 18 to 34 Years | 129 (1.1%) | 33 (0.3%) |
| 35 to 64 Years | 558 (2.5%) | 421 (2.0%) |
| 65 to 74 Years | 298 (5.3%) | 194 (3.1%) |
| 75 Years and over | 296 (9.4%) | 566 (12.3%) |
Technology Access in San Buenaventura Ventura
Computing Device Access in San Buenaventura Ventura
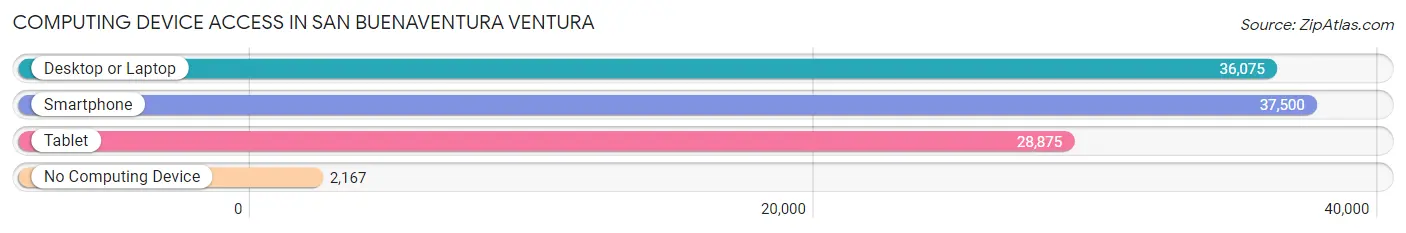
| Device Type | # Households | % Households |
| Desktop or Laptop | 36,075 | 86.0% |
| Smartphone | 37,500 | 89.4% |
| Tablet | 28,875 | 68.8% |
| No Computing Device | 2,167 | 5.2% |
| Total | 41,954 | 100.0% |
Internet Access in San Buenaventura Ventura
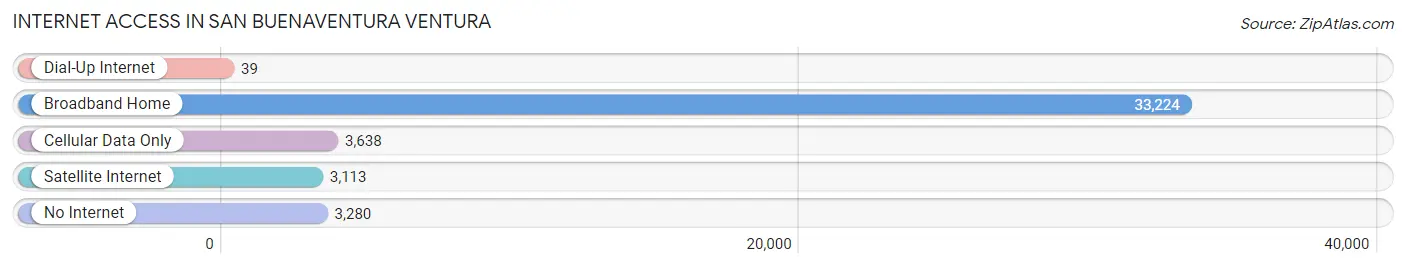
| Internet Type | # Households | % Households |
| Dial-Up Internet | 39 | 0.1% |
| Broadband Home | 33,224 | 79.2% |
| Cellular Data Only | 3,638 | 8.7% |
| Satellite Internet | 3,113 | 7.4% |
| No Internet | 3,280 | 7.8% |
| Total | 41,954 | 100.0% |
San Buenaventura Ventura Summary
History
San Buenaventura, commonly known as Ventura, is a city located in Ventura County, California. It is the county seat and the most populous city in the county. The city was founded in 1782 by Father Junipero Serra, a Spanish Franciscan priest, and was named after Saint Bonaventure, a 13th-century Italian Franciscan saint. The city was incorporated in 1866 and has since grown to become a major coastal city in California.
Geography
Ventura is located on the Pacific Coast of California, approximately 60 miles northwest of Los Angeles. It is situated on the Ventura River, which flows into the Pacific Ocean. The city is surrounded by the Santa Monica Mountains to the north and the Santa Susana Mountains to the south. The city has a total area of 40.3 square miles, of which 39.8 square miles is land and 0.5 square miles is water.
Economy
Ventura’s economy is largely based on tourism, agriculture, and manufacturing. The city is home to several major employers, including the Ventura County Medical Center, the Ventura County Government Center, and the Naval Base Ventura County. The city is also home to several major industries, including aerospace, biotechnology, and electronics.
Demographics
As of the 2010 census, Ventura had a population of 106,433. The racial makeup of the city was 68.2% White, 2.2% African American, 0.7% Native American, 8.3% Asian, 0.2% Pacific Islander, 15.2% from other races, and 5.2% from two or more races. The median household income was $54,845 and the median family income was $63,945. The per capita income was $27,845.
Conclusion
San Buenaventura, commonly known as Ventura, is a city located in Ventura County, California. It was founded in 1782 and has since grown to become a major coastal city in California. The city is situated on the Pacific Coast of California and is surrounded by the Santa Monica Mountains to the north and the Santa Susana Mountains to the south. Ventura’s economy is largely based on tourism, agriculture, and manufacturing. As of the 2010 census, Ventura had a population of 106,433. The median household income was $54,845 and the median family income was $63,945.
Common Questions
What is the Total Population of San Buenaventura Ventura?
Total Population of San Buenaventura Ventura is 110,358.
What is the Total Male Population of San Buenaventura Ventura?
Total Male Population of San Buenaventura Ventura is 55,277.
What is the Total Female Population of San Buenaventura Ventura?
Total Female Population of San Buenaventura Ventura is 55,081.
What is the Ratio of Males per 100 Females in San Buenaventura Ventura?
There are 100.36 Males per 100 Females in San Buenaventura Ventura.
What is the Ratio of Females per 100 Males in San Buenaventura Ventura?
There are 99.65 Females per 100 Males in San Buenaventura Ventura.
What is the Median Population Age in San Buenaventura Ventura?
Median Population Age in San Buenaventura Ventura is 41.3 Years.
What is the Average Family Size in San Buenaventura Ventura
Average Family Size in San Buenaventura Ventura is 3.1 People.
What is the Average Household Size in San Buenaventura Ventura
Average Household Size in San Buenaventura Ventura is 2.6 People.
What is Per Capita Income in San Buenaventura Ventura?
Per Capita income in San Buenaventura Ventura is $46,562.
What is the Median Family Income in San Buenaventura Ventura?
Median Family Income in San Buenaventura Ventura is $112,232.
What is the Median Household income in San Buenaventura Ventura?
Median Household Income in San Buenaventura Ventura is $96,036.
What is Income or Wage Gap in San Buenaventura Ventura?
Income or Wage Gap in San Buenaventura Ventura is 22.5%.
Women in San Buenaventura Ventura earn 77.5 cents for every dollar earned by a man.
What is Family Income Deficit in San Buenaventura Ventura?
Family Income Deficit in San Buenaventura Ventura is $10,504.
Families that are below poverty line in San Buenaventura Ventura earn $10,504 less on average than the poverty threshold level.
What is Inequality or Gini Index in San Buenaventura Ventura?
Inequality or Gini Index in San Buenaventura Ventura is 0.43.
How Large is the Labor Force in San Buenaventura Ventura?
There are 58,144 People in the Labor Forcein in San Buenaventura Ventura.
What is the Percentage of People in the Labor Force in San Buenaventura Ventura?
63.9% of People are in the Labor Force in San Buenaventura Ventura.
What is the Unemployment Rate in San Buenaventura Ventura?
Unemployment Rate in San Buenaventura Ventura is 4.9%.