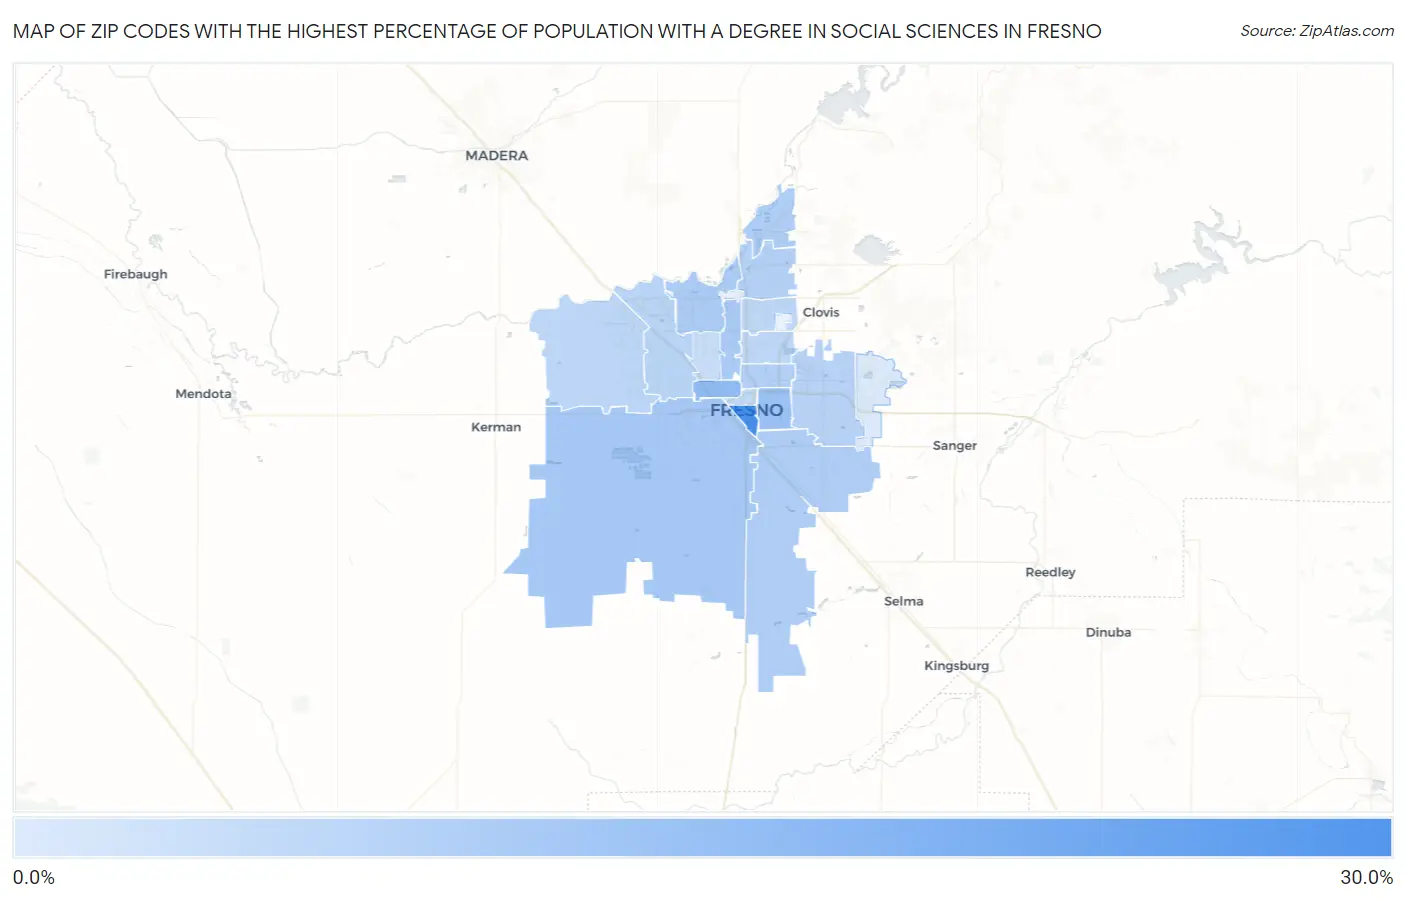
Zip Codes with the Highest Percentage of Population with a Degree in Social Sciences in Fresno, CA
RELATED REPORTS & OPTIONS
Social Sciences
Fresno
Compare Zip Codes
Map of Zip Codes with the Highest Percentage of Population with a Degree in Social Sciences in Fresno
0.0%
30.0%
Zip Codes with the Highest Percentage of Population with a Degree in Social Sciences in Fresno, CA
| Zip Code | % Graduates | vs State | vs National | |
| 1. | 93721 | 25.1% | 10.4%(+14.7)#53 | 8.1%(+17.0)#626 |
| 2. | 93728 | 14.3% | 10.4%(+3.96)#275 | 8.1%(+6.26)#2,191 |
| 3. | 93702 | 12.8% | 10.4%(+2.39)#367 | 8.1%(+4.68)#2,974 |
| 4. | 93706 | 11.7% | 10.4%(+1.32)#478 | 8.1%(+3.62)#3,750 |
| 5. | 93704 | 10.8% | 10.4%(+0.427)#598 | 8.1%(+2.72)#4,589 |
| 6. | 93711 | 10.5% | 10.4%(+0.142)#655 | 8.1%(+2.44)#4,929 |
| 7. | 93725 | 10.2% | 10.4%(-0.132)#705 | 8.1%(+2.16)#5,265 |
| 8. | 93730 | 9.9% | 10.4%(-0.443)#766 | 8.1%(+1.85)#5,650 |
| 9. | 93703 | 9.7% | 10.4%(-0.664)#799 | 8.1%(+1.63)#5,936 |
| 10. | 93720 | 9.5% | 10.4%(-0.896)#834 | 8.1%(+1.40)#6,242 |
| 11. | 93727 | 9.2% | 10.4%(-1.17)#882 | 8.1%(+1.13)#6,625 |
| 12. | 93722 | 8.7% | 10.4%(-1.63)#960 | 8.1%(+0.670)#7,360 |
| 13. | 93723 | 8.6% | 10.4%(-1.77)#988 | 8.1%(+0.527)#7,620 |
| 14. | 93726 | 8.3% | 10.4%(-2.07)#1,046 | 8.1%(+0.226)#8,178 |
| 15. | 93710 | 8.2% | 10.4%(-2.19)#1,066 | 8.1%(+0.102)#8,409 |
| 16. | 93701 | 7.5% | 10.4%(-2.90)#1,166 | 8.1%(-0.608)#9,861 |
| 17. | 93705 | 6.9% | 10.4%(-3.45)#1,232 | 8.1%(-1.16)#11,125 |
| 18. | 93737 | 4.3% | 10.4%(-6.05)#1,416 | 8.1%(-3.75)#17,469 |
1
Common Questions
What are the Top 10 Zip Codes with the Highest Percentage of Population with a Degree in Social Sciences in Fresno, CA?
Top 10 Zip Codes with the Highest Percentage of Population with a Degree in Social Sciences in Fresno, CA are:
What zip code has the Highest Percentage of Population with a Degree in Social Sciences in Fresno, CA?
93721 has the Highest Percentage of Population with a Degree in Social Sciences in Fresno, CA with 25.1%.
What is the Percentage of Population with a Degree in Social Sciences in Fresno, CA?
Percentage of Population with a Degree in Social Sciences in Fresno is 9.6%.
What is the Percentage of Population with a Degree in Social Sciences in California?
Percentage of Population with a Degree in Social Sciences in California is 10.4%.
What is the Percentage of Population with a Degree in Social Sciences in the United States?
Percentage of Population with a Degree in Social Sciences in the United States is 8.1%.