Zip Codes with the Highest Percentage of Population with a Degree in Psychology in San Jose, CA
RELATED REPORTS & OPTIONS
Psychology
San Jose
Compare Zip Codes
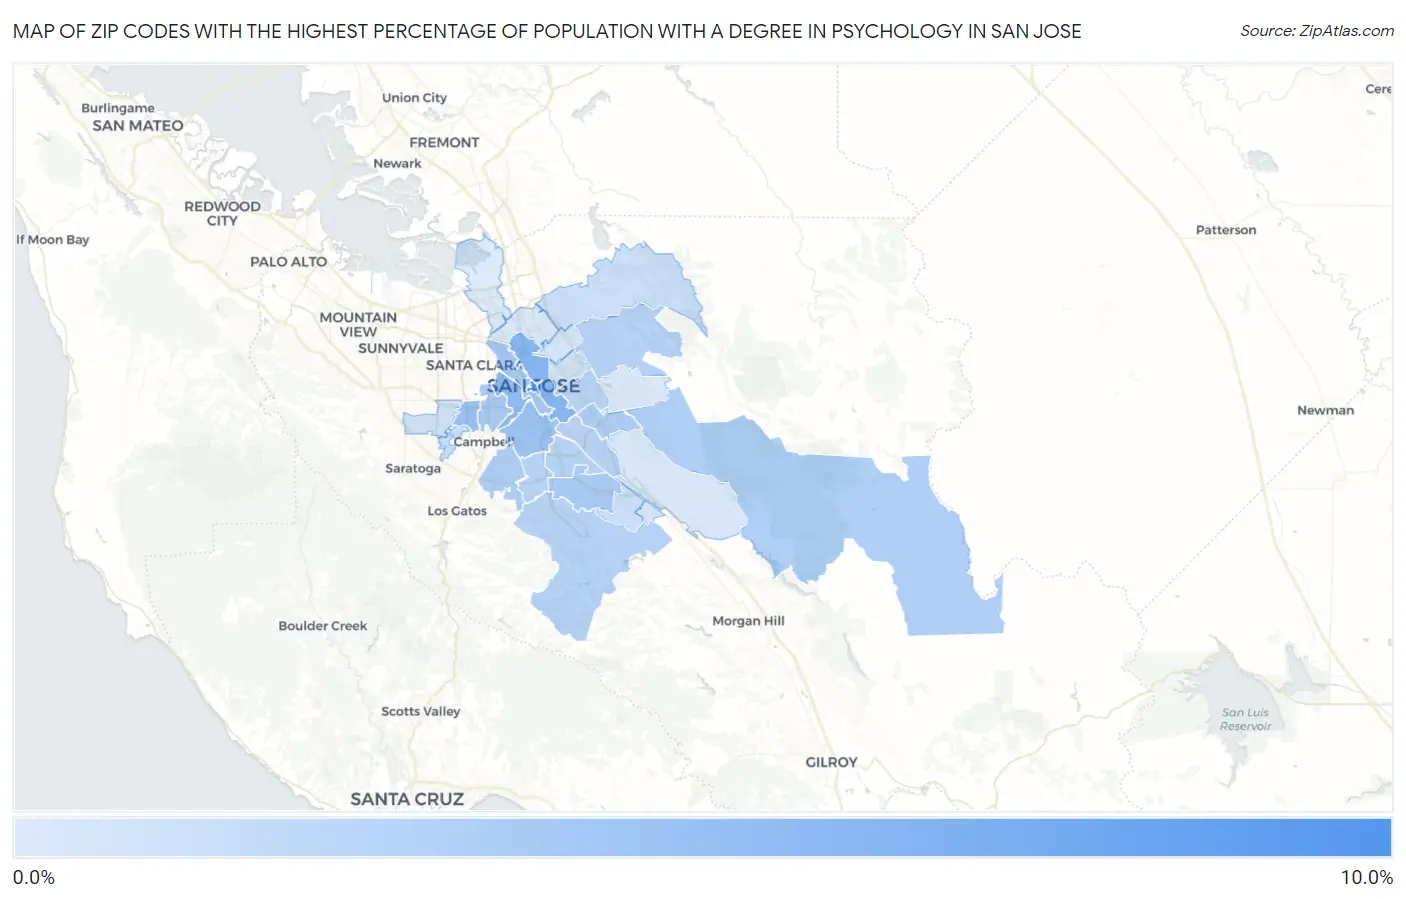
Map of Zip Codes with the Highest Percentage of Population with a Degree in Psychology in San Jose
0.0%
10.0%
Zip Codes with the Highest Percentage of Population with a Degree in Psychology in San Jose, CA
| Zip Code | % Graduates | vs State | vs National | |
| 1. | 95113 | 8.7% | 5.3%(+3.36)#197 | 5.1%(+3.64)#3,424 |
| 2. | 95112 | 5.7% | 5.3%(+0.345)#674 | 5.1%(+0.629)#8,947 |
| 3. | 95126 | 5.3% | 5.3%(+0.004)#781 | 5.1%(+0.288)#10,032 |
| 4. | 95117 | 4.8% | 5.3%(-0.523)#906 | 5.1%(-0.239)#11,920 |
| 5. | 95125 | 4.6% | 5.3%(-0.701)#962 | 5.1%(-0.417)#12,577 |
| 6. | 95128 | 4.2% | 5.3%(-1.12)#1,068 | 5.1%(-0.836)#14,166 |
| 7. | 95123 | 4.2% | 5.3%(-1.15)#1,076 | 5.1%(-0.870)#14,293 |
| 8. | 95110 | 4.2% | 5.3%(-1.17)#1,079 | 5.1%(-0.890)#14,370 |
| 9. | 95124 | 3.9% | 5.3%(-1.47)#1,149 | 5.1%(-1.18)#15,398 |
| 10. | 95121 | 3.8% | 5.3%(-1.50)#1,153 | 5.1%(-1.22)#15,502 |
| 11. | 95135 | 3.8% | 5.3%(-1.51)#1,154 | 5.1%(-1.22)#15,525 |
| 12. | 95122 | 3.6% | 5.3%(-1.74)#1,197 | 5.1%(-1.46)#16,354 |
| 13. | 95111 | 3.6% | 5.3%(-1.74)#1,199 | 5.1%(-1.46)#16,364 |
| 14. | 95127 | 3.6% | 5.3%(-1.78)#1,208 | 5.1%(-1.50)#16,525 |
| 15. | 95120 | 3.6% | 5.3%(-1.78)#1,209 | 5.1%(-1.50)#16,532 |
| 16. | 95136 | 3.5% | 5.3%(-1.84)#1,216 | 5.1%(-1.56)#16,717 |
| 17. | 95118 | 3.5% | 5.3%(-1.87)#1,222 | 5.1%(-1.59)#16,808 |
| 18. | 95119 | 2.7% | 5.3%(-2.62)#1,315 | 5.1%(-2.33)#19,026 |
| 19. | 95130 | 2.7% | 5.3%(-2.68)#1,324 | 5.1%(-2.39)#19,190 |
| 20. | 95132 | 2.7% | 5.3%(-2.68)#1,326 | 5.1%(-2.40)#19,210 |
| 21. | 95129 | 2.5% | 5.3%(-2.87)#1,341 | 5.1%(-2.59)#19,691 |
| 22. | 95116 | 2.4% | 5.3%(-2.91)#1,346 | 5.1%(-2.63)#19,811 |
| 23. | 95133 | 2.3% | 5.3%(-3.08)#1,360 | 5.1%(-2.80)#20,254 |
| 24. | 95138 | 2.1% | 5.3%(-3.21)#1,372 | 5.1%(-2.92)#20,549 |
| 25. | 95131 | 2.1% | 5.3%(-3.27)#1,374 | 5.1%(-2.99)#20,663 |
| 26. | 95139 | 2.0% | 5.3%(-3.35)#1,379 | 5.1%(-3.07)#20,847 |
| 27. | 95148 | 2.0% | 5.3%(-3.36)#1,380 | 5.1%(-3.07)#20,856 |
| 28. | 95134 | 1.9% | 5.3%(-3.41)#1,383 | 5.1%(-3.12)#20,965 |
1
Common Questions
What are the Top 10 Zip Codes with the Highest Percentage of Population with a Degree in Psychology in San Jose, CA?
Top 10 Zip Codes with the Highest Percentage of Population with a Degree in Psychology in San Jose, CA are:
What zip code has the Highest Percentage of Population with a Degree in Psychology in San Jose, CA?
95113 has the Highest Percentage of Population with a Degree in Psychology in San Jose, CA with 8.7%.
What is the Percentage of Population with a Degree in Psychology in San Jose, CA?
Percentage of Population with a Degree in Psychology in San Jose is 3.5%.
What is the Percentage of Population with a Degree in Psychology in California?
Percentage of Population with a Degree in Psychology in California is 5.3%.
What is the Percentage of Population with a Degree in Psychology in the United States?
Percentage of Population with a Degree in Psychology in the United States is 5.1%.