Zip Codes with the Highest Percentage of Population Employed in Finance & Insurance in San Jose, CA
RELATED REPORTS & OPTIONS
Finance & Insurance
San Jose
Compare Zip Codes
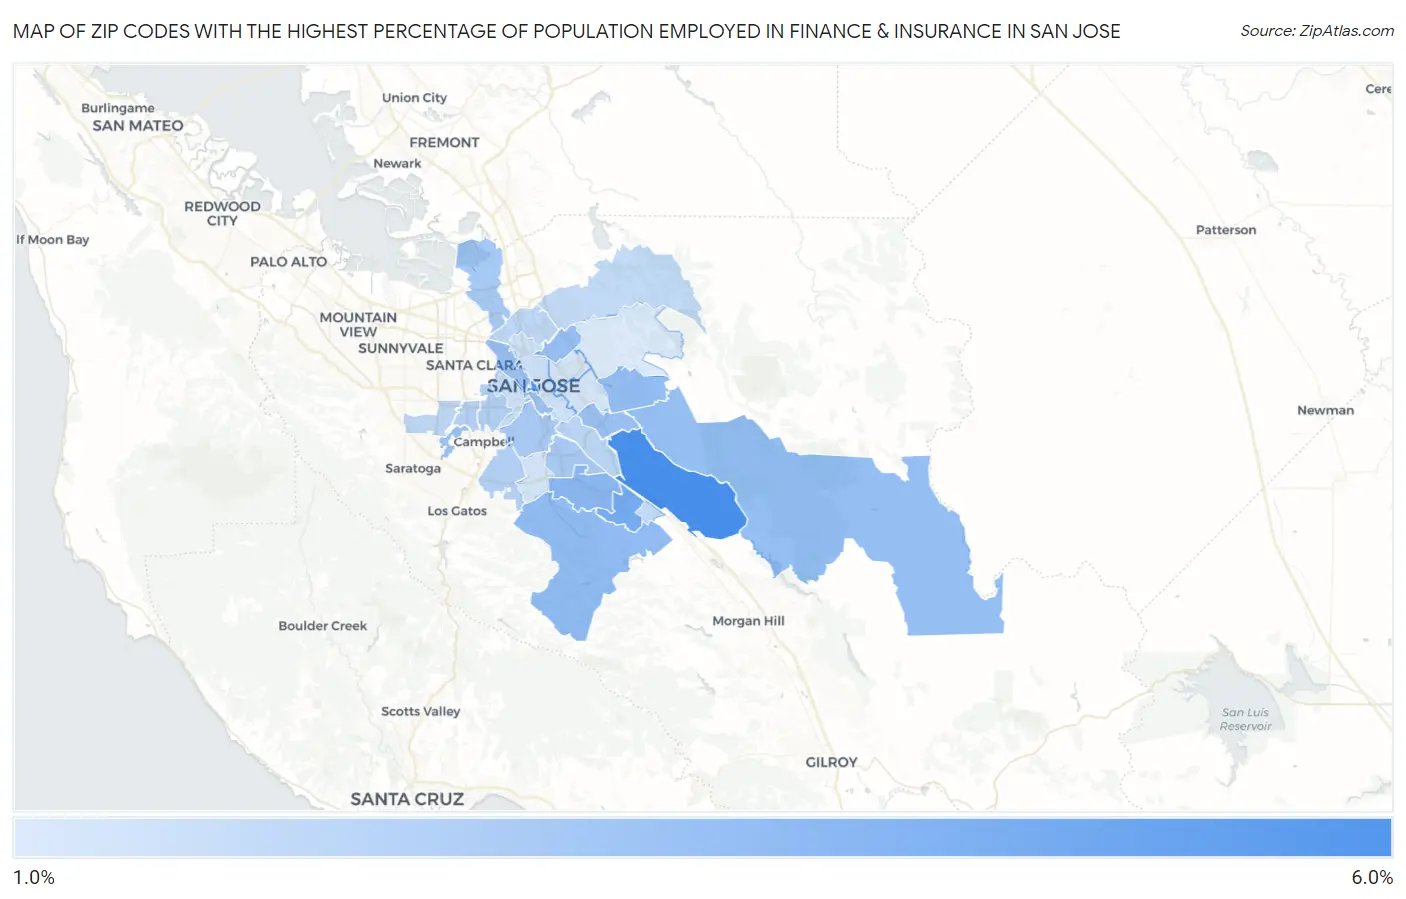
Map of Zip Codes with the Highest Percentage of Population Employed in Finance & Insurance in San Jose
0.0%
6.0%
Zip Codes with the Highest Percentage of Population Employed in Finance & Insurance in San Jose, CA
| Zip Code | % Employed | vs State | vs National | |
| 1. | 95138 | 5.0% | 3.7%(+1.33)#331 | 4.8%(+0.260)#8,202 |
| 2. | 95113 | 4.7% | 3.7%(+1.02)#380 | 4.8%(-0.046)#9,155 |
| 3. | 95119 | 4.0% | 3.7%(+0.346)#502 | 4.8%(-0.722)#11,394 |
| 4. | 95123 | 3.6% | 3.7%(-0.121)#604 | 4.8%(-1.19)#13,240 |
| 5. | 95120 | 3.4% | 3.7%(-0.262)#642 | 4.8%(-1.33)#13,881 |
| 6. | 95148 | 3.4% | 3.7%(-0.306)#657 | 4.8%(-1.37)#14,058 |
| 7. | 95135 | 3.3% | 3.7%(-0.378)#673 | 4.8%(-1.45)#14,377 |
| 8. | 95133 | 3.3% | 3.7%(-0.450)#692 | 4.8%(-1.52)#14,688 |
| 9. | 95130 | 3.2% | 3.7%(-0.464)#694 | 4.8%(-1.53)#14,748 |
| 10. | 95121 | 3.2% | 3.7%(-0.467)#696 | 4.8%(-1.54)#14,764 |
| 11. | 95110 | 3.2% | 3.7%(-0.523)#713 | 4.8%(-1.59)#15,030 |
| 12. | 95134 | 2.9% | 3.7%(-0.772)#791 | 4.8%(-1.84)#16,154 |
| 13. | 95136 | 2.9% | 3.7%(-0.801)#799 | 4.8%(-1.87)#16,296 |
| 14. | 95125 | 2.9% | 3.7%(-0.804)#800 | 4.8%(-1.87)#16,314 |
| 15. | 95128 | 2.7% | 3.7%(-1.00)#854 | 4.8%(-2.07)#17,244 |
| 16. | 95124 | 2.6% | 3.7%(-1.08)#874 | 4.8%(-2.15)#17,590 |
| 17. | 95117 | 2.6% | 3.7%(-1.10)#879 | 4.8%(-2.16)#17,664 |
| 18. | 95111 | 2.5% | 3.7%(-1.22)#922 | 4.8%(-2.29)#18,297 |
| 19. | 95131 | 2.4% | 3.7%(-1.25)#932 | 4.8%(-2.32)#18,437 |
| 20. | 95129 | 2.4% | 3.7%(-1.28)#942 | 4.8%(-2.35)#18,563 |
| 21. | 95132 | 2.3% | 3.7%(-1.38)#967 | 4.8%(-2.45)#19,021 |
| 22. | 95139 | 2.3% | 3.7%(-1.39)#972 | 4.8%(-2.46)#19,073 |
| 23. | 95126 | 2.1% | 3.7%(-1.60)#1,031 | 4.8%(-2.67)#20,048 |
| 24. | 95112 | 2.1% | 3.7%(-1.62)#1,036 | 4.8%(-2.69)#20,134 |
| 25. | 95116 | 2.0% | 3.7%(-1.74)#1,067 | 4.8%(-2.81)#20,647 |
| 26. | 95118 | 2.0% | 3.7%(-1.74)#1,069 | 4.8%(-2.81)#20,652 |
| 27. | 95122 | 1.9% | 3.7%(-1.75)#1,071 | 4.8%(-2.82)#20,704 |
| 28. | 95127 | 1.8% | 3.7%(-1.90)#1,107 | 4.8%(-2.97)#21,346 |
1
Common Questions
What are the Top 10 Zip Codes with the Highest Percentage of Population Employed in Finance & Insurance in San Jose, CA?
Top 10 Zip Codes with the Highest Percentage of Population Employed in Finance & Insurance in San Jose, CA are:
What zip code has the Highest Percentage of Population Employed in Finance & Insurance in San Jose, CA?
95138 has the Highest Percentage of Population Employed in Finance & Insurance in San Jose, CA with 5.0%.
What is the Percentage of Population Employed in Finance & Insurance in San Jose, CA?
Percentage of Population Employed in Finance & Insurance in San Jose is 2.7%.
What is the Percentage of Population Employed in Finance & Insurance in California?
Percentage of Population Employed in Finance & Insurance in California is 3.7%.
What is the Percentage of Population Employed in Finance & Insurance in the United States?
Percentage of Population Employed in Finance & Insurance in the United States is 4.8%.