Richfield, WI
Richfield Map
Richfield Overview
11,757
TOTAL POPULATION
5,983
MALE POPULATION
5,774
FEMALE POPULATION
103.62
MALES / 100 FEMALES
96.51
FEMALES / 100 MALES
47.5
MEDIAN AGE
2.8
AVG FAMILY SIZE
2.6
AVG HOUSEHOLD SIZE
$60,912
PER CAPITA INCOME
$148,580
AVG FAMILY INCOME
$128,165
AVG HOUSEHOLD INCOME
38.2%
WAGE / INCOME GAP [ % ]
61.8¢/ $1
WAGE / INCOME GAP [ $ ]
0.39
INEQUALITY / GINI INDEX
6,761
LABOR FORCE [ PEOPLE ]
70.6%
PERCENT IN LABOR FORCE
1.0%
UNEMPLOYMENT RATE
Richfield Zip Codes
Richfield Area Codes
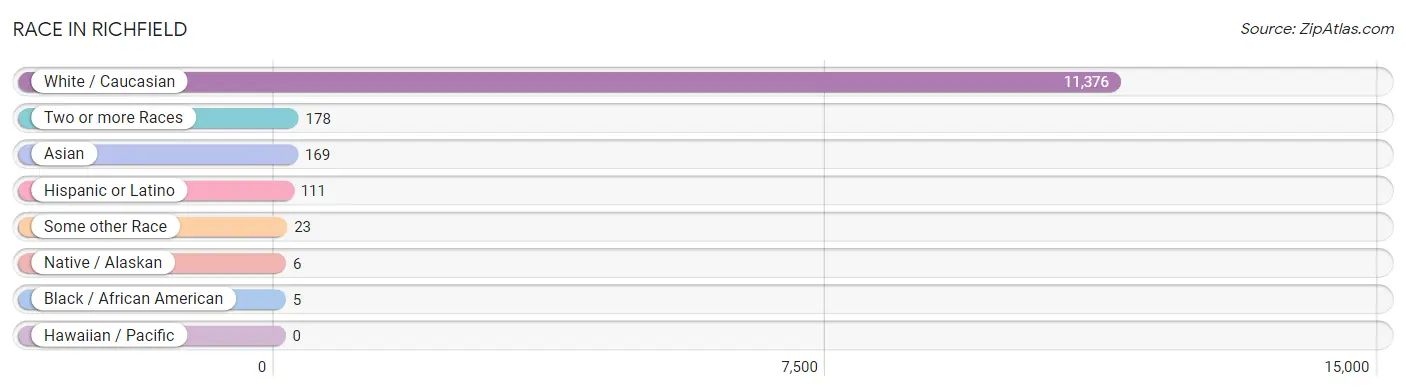
Race in Richfield
The most populous races in Richfield are White / Caucasian (11,376 | 96.8%), Two or more Races (178 | 1.5%), and Asian (169 | 1.4%).
| Race | # Population | % Population |
| Asian | 169 | 1.4% |
| Black / African American | 5 | 0.0% |
| Hawaiian / Pacific | 0 | 0.0% |
| Hispanic or Latino | 111 | 0.9% |
| Native / Alaskan | 6 | 0.1% |
| White / Caucasian | 11,376 | 96.8% |
| Two or more Races | 178 | 1.5% |
| Some other Race | 23 | 0.2% |
| Total | 11,757 | 100.0% |
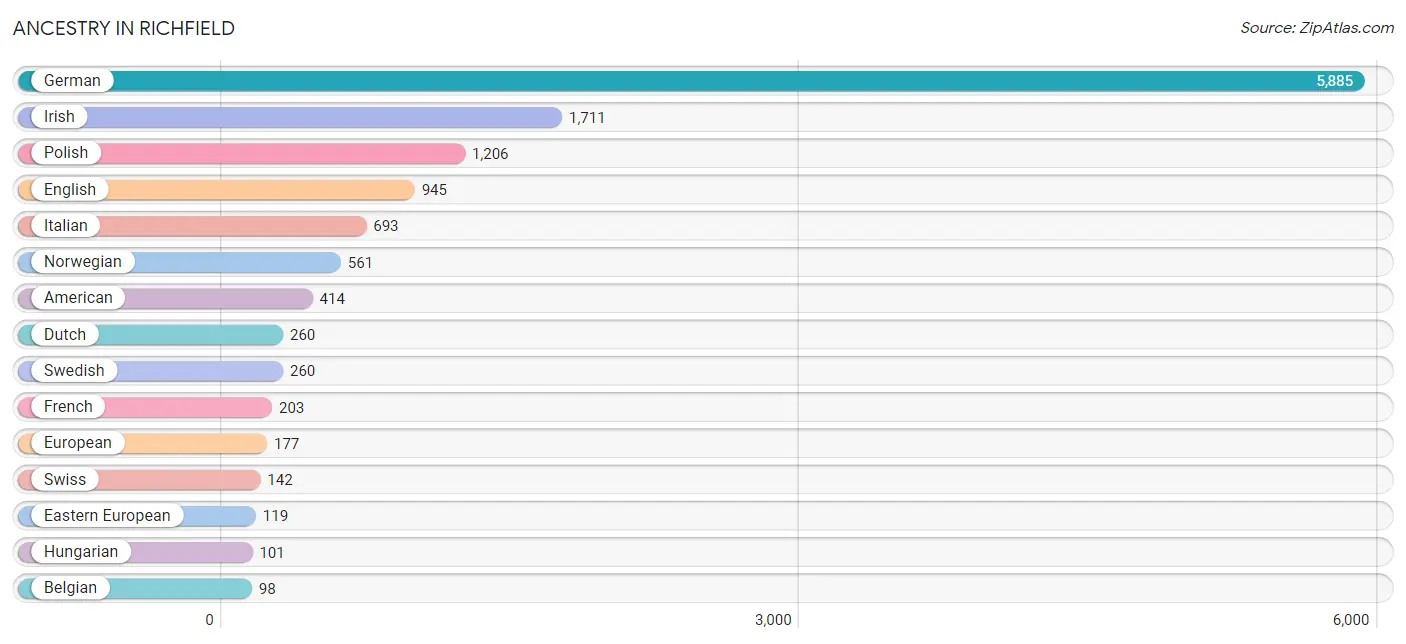
Ancestry in Richfield
The most populous ancestries reported in Richfield are German (5,885 | 50.1%), Irish (1,711 | 14.5%), Polish (1,206 | 10.3%), English (945 | 8.0%), and Italian (693 | 5.9%), together accounting for 88.8% of all Richfield residents.
| Ancestry | # Population | % Population |
| American | 414 | 3.5% |
| Arab | 16 | 0.1% |
| Austrian | 61 | 0.5% |
| Bangladeshi | 32 | 0.3% |
| Belgian | 98 | 0.8% |
| British | 34 | 0.3% |
| Burmese | 13 | 0.1% |
| Cajun | 13 | 0.1% |
| Canadian | 5 | 0.0% |
| Central American | 55 | 0.5% |
| Chippewa | 6 | 0.1% |
| Costa Rican | 32 | 0.3% |
| Croatian | 14 | 0.1% |
| Cuban | 36 | 0.3% |
| Czech | 84 | 0.7% |
| Czechoslovakian | 22 | 0.2% |
| Danish | 21 | 0.2% |
| Dutch | 260 | 2.2% |
| Eastern European | 119 | 1.0% |
| English | 945 | 8.0% |
| European | 177 | 1.5% |
| Finnish | 20 | 0.2% |
| French | 203 | 1.7% |
| French Canadian | 16 | 0.1% |
| German | 5,885 | 50.1% |
| Greek | 53 | 0.4% |
| Guatemalan | 23 | 0.2% |
| Haitian | 12 | 0.1% |
| Hungarian | 101 | 0.9% |
| Indian (Asian) | 51 | 0.4% |
| Irish | 1,711 | 14.5% |
| Italian | 693 | 5.9% |
| Korean | 31 | 0.3% |
| Lebanese | 16 | 0.1% |
| Lithuanian | 19 | 0.2% |
| Luxembourger | 19 | 0.2% |
| Mexican | 10 | 0.1% |
| Northern European | 14 | 0.1% |
| Norwegian | 561 | 4.8% |
| Polish | 1,206 | 10.3% |
| Puerto Rican | 10 | 0.1% |
| Russian | 80 | 0.7% |
| Scotch-Irish | 16 | 0.1% |
| Scottish | 88 | 0.7% |
| Slavic | 18 | 0.2% |
| Slovak | 63 | 0.5% |
| Slovene | 38 | 0.3% |
| Sri Lankan | 11 | 0.1% |
| Swedish | 260 | 2.2% |
| Swiss | 142 | 1.2% |
| Thai | 65 | 0.5% |
| Ukrainian | 17 | 0.1% |
| Welsh | 84 | 0.7% | View All 53 Rows |
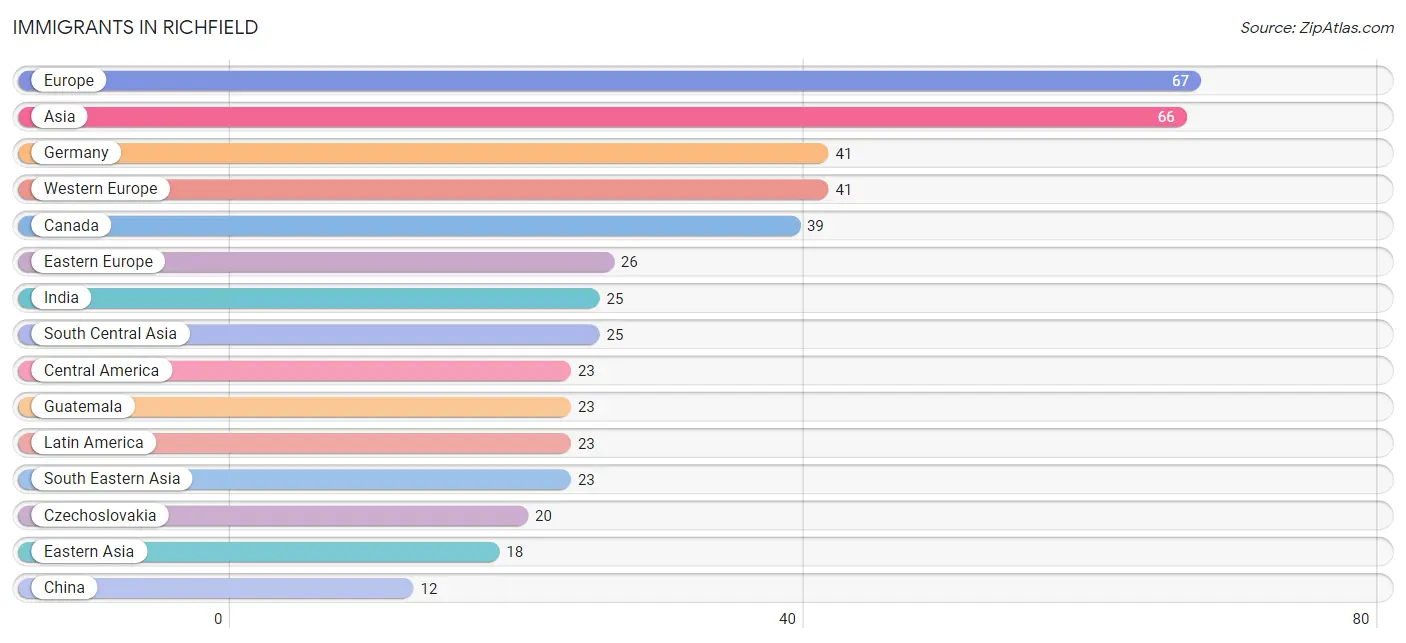
Immigrants in Richfield
The most numerous immigrant groups reported in Richfield came from Europe (67 | 0.6%), Asia (66 | 0.6%), Germany (41 | 0.4%), Western Europe (41 | 0.4%), and Canada (39 | 0.3%), together accounting for 2.2% of all Richfield residents.
| Immigration Origin | # Population | % Population |
| Asia | 66 | 0.6% |
| Canada | 39 | 0.3% |
| Central America | 23 | 0.2% |
| China | 12 | 0.1% |
| Croatia | 3 | 0.0% |
| Czechoslovakia | 20 | 0.2% |
| Eastern Asia | 18 | 0.2% |
| Eastern Europe | 26 | 0.2% |
| Europe | 67 | 0.6% |
| Germany | 41 | 0.4% |
| Guatemala | 23 | 0.2% |
| India | 25 | 0.2% |
| Korea | 6 | 0.1% |
| Laos | 5 | 0.0% |
| Latin America | 23 | 0.2% |
| Philippines | 6 | 0.1% |
| Poland | 3 | 0.0% |
| South Central Asia | 25 | 0.2% |
| South Eastern Asia | 23 | 0.2% |
| Vietnam | 12 | 0.1% |
| Western Europe | 41 | 0.4% | View All 21 Rows |
Sex and Age in Richfield
Sex and Age in Richfield
The most populous age groups in Richfield are 55 to 59 Years (714 | 11.9%) for men and 50 to 54 Years (749 | 13.0%) for women.
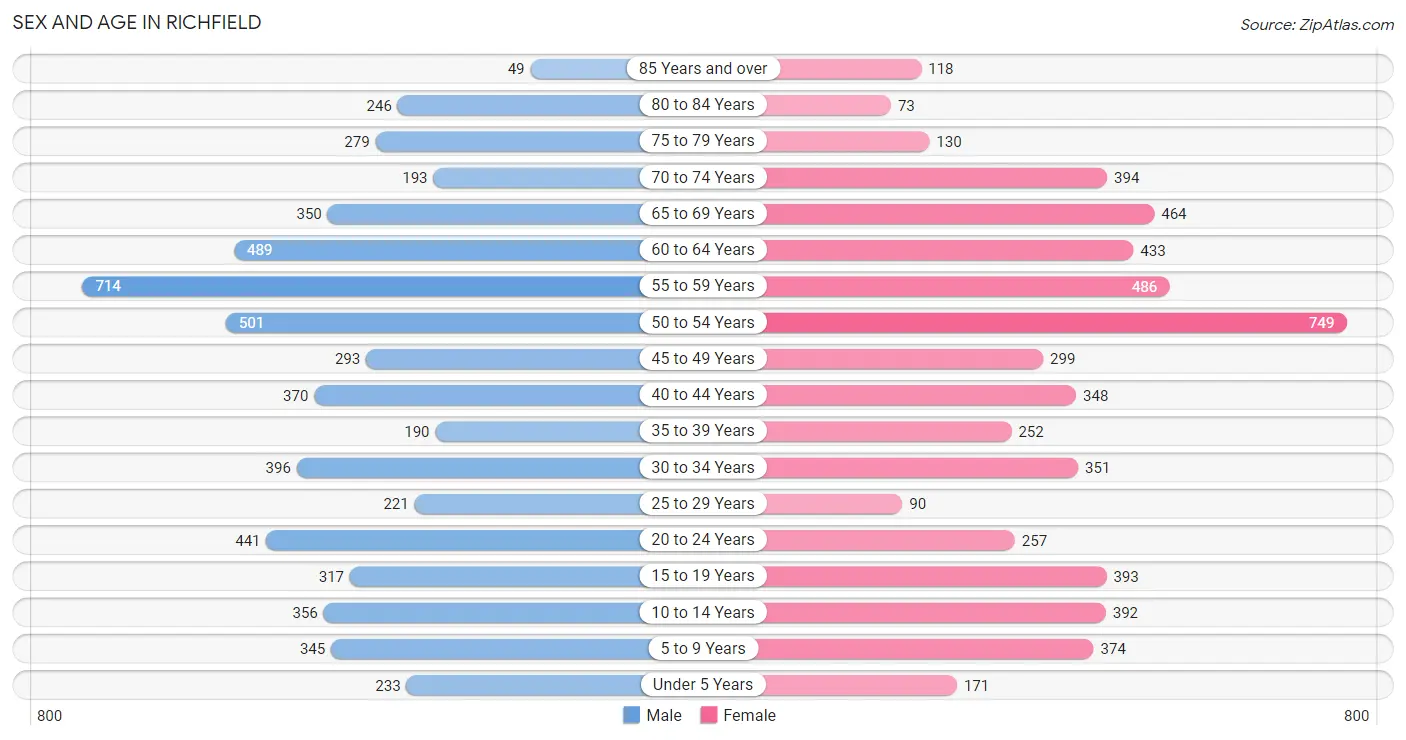
| Age Bracket | Male | Female |
| Under 5 Years | 233 (3.9%) | 171 (3.0%) |
| 5 to 9 Years | 345 (5.8%) | 374 (6.5%) |
| 10 to 14 Years | 356 (5.9%) | 392 (6.8%) |
| 15 to 19 Years | 317 (5.3%) | 393 (6.8%) |
| 20 to 24 Years | 441 (7.4%) | 257 (4.4%) |
| 25 to 29 Years | 221 (3.7%) | 90 (1.6%) |
| 30 to 34 Years | 396 (6.6%) | 351 (6.1%) |
| 35 to 39 Years | 190 (3.2%) | 252 (4.4%) |
| 40 to 44 Years | 370 (6.2%) | 348 (6.0%) |
| 45 to 49 Years | 293 (4.9%) | 299 (5.2%) |
| 50 to 54 Years | 501 (8.4%) | 749 (13.0%) |
| 55 to 59 Years | 714 (11.9%) | 486 (8.4%) |
| 60 to 64 Years | 489 (8.2%) | 433 (7.5%) |
| 65 to 69 Years | 350 (5.9%) | 464 (8.0%) |
| 70 to 74 Years | 193 (3.2%) | 394 (6.8%) |
| 75 to 79 Years | 279 (4.7%) | 130 (2.2%) |
| 80 to 84 Years | 246 (4.1%) | 73 (1.3%) |
| 85 Years and over | 49 (0.8%) | 118 (2.0%) |
| Total | 5,983 (100.0%) | 5,774 (100.0%) |
Families and Households in Richfield
Median Family Size in Richfield
The median family size in Richfield is 2.82 persons per family, with married-couple families (3,551 | 91.7%) accounting for the largest median family size of 2.84 persons per family. On the other hand, single male/father families (163 | 4.2%) represent the smallest median family size with 2.42 persons per family.
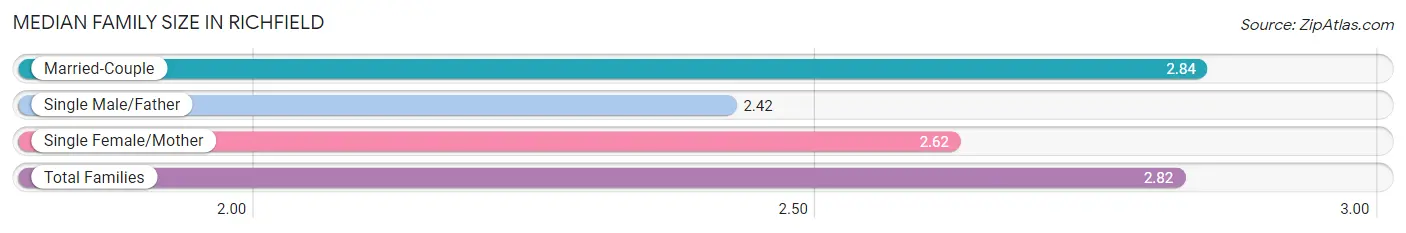
| Family Type | # Families | Family Size |
| Married-Couple | 3,551 (91.7%) | 2.84 |
| Single Male/Father | 163 (4.2%) | 2.42 |
| Single Female/Mother | 157 (4.1%) | 2.62 |
| Total Families | 3,871 (100.0%) | 2.82 |
Median Household Size in Richfield
The median household size in Richfield is 2.62 persons per household, with single female/mother households (157 | 3.5%) accounting for the largest median household size of 2.99 persons per household. non-family households (608 | 13.6%) represent the smallest median household size with 1.23 persons per household.
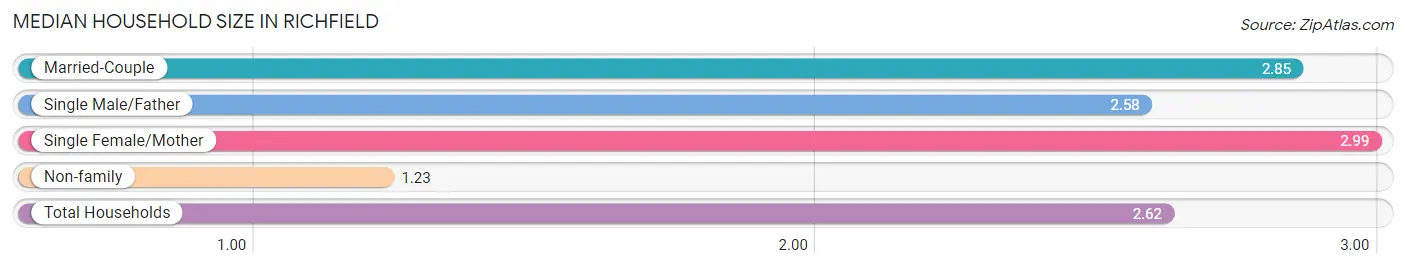
| Household Type | # Households | Household Size |
| Married-Couple | 3,551 (79.3%) | 2.85 |
| Single Male/Father | 163 (3.6%) | 2.58 |
| Single Female/Mother | 157 (3.5%) | 2.99 |
| Non-family | 608 (13.6%) | 1.23 |
| Total Households | 4,479 (100.0%) | 2.62 |
Household Size by Marriage Status in Richfield
Out of a total of 4,479 households in Richfield, 3,871 (86.4%) are family households, while 608 (13.6%) are nonfamily households. The most numerous type of family households are 2-person households, comprising 2,256, and the most common type of nonfamily households are 1-person households, comprising 517.
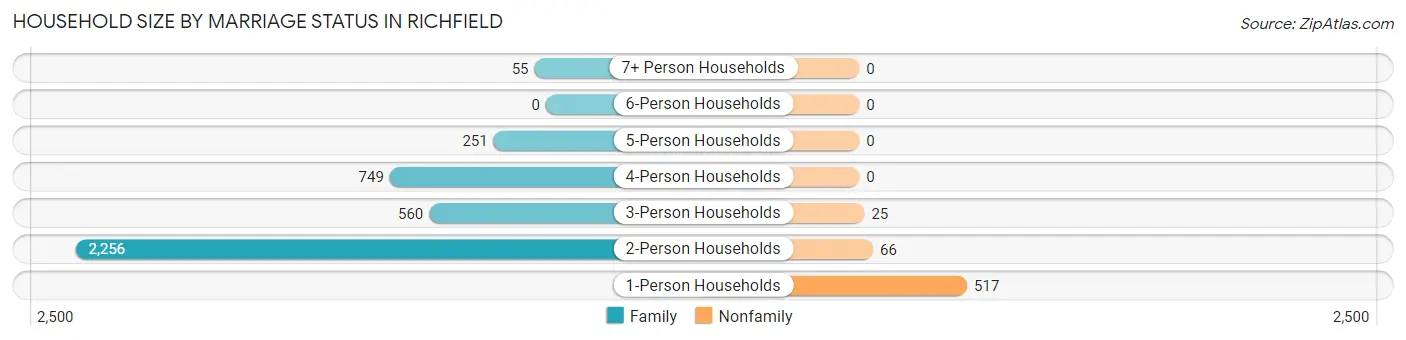
| Household Size | Family Households | Nonfamily Households |
| 1-Person Households | - | 517 (11.5%) |
| 2-Person Households | 2,256 (50.4%) | 66 (1.5%) |
| 3-Person Households | 560 (12.5%) | 25 (0.6%) |
| 4-Person Households | 749 (16.7%) | 0 (0.0%) |
| 5-Person Households | 251 (5.6%) | 0 (0.0%) |
| 6-Person Households | 0 (0.0%) | 0 (0.0%) |
| 7+ Person Households | 55 (1.2%) | 0 (0.0%) |
| Total | 3,871 (86.4%) | 608 (13.6%) |
Female Fertility in Richfield
Fertility by Age in Richfield
Average fertility rate in Richfield is 31.0 births per 1,000 women. Women in the age bracket of 20 to 34 years have the highest fertility rate with 60.0 births per 1,000 women. Women in the age bracket of 20 to 34 years acount for 66.7% of all women with births.
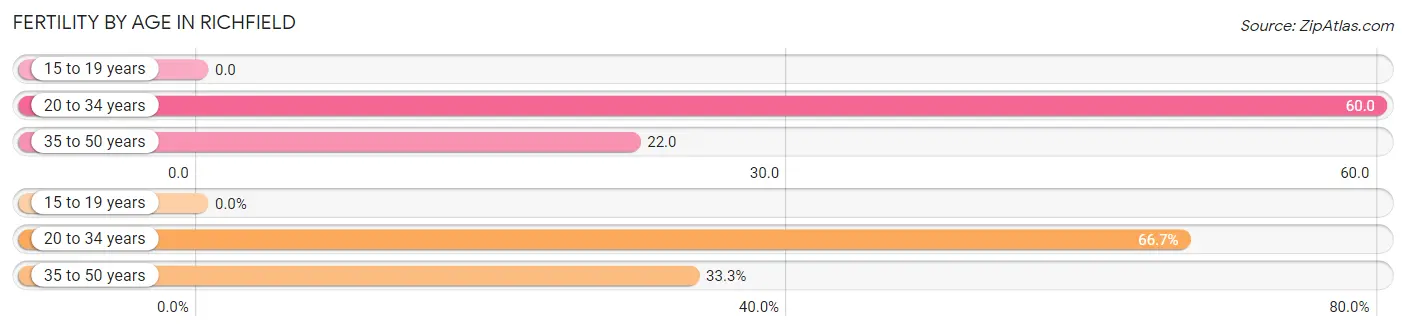
| Age Bracket | Women with Births | Births / 1,000 Women |
| 15 to 19 years | 0 (0.0%) | 0.0 |
| 20 to 34 years | 42 (66.7%) | 60.0 |
| 35 to 50 years | 21 (33.3%) | 22.0 |
| Total | 63 (100.0%) | 31.0 |
Fertility by Age by Marriage Status in Richfield
61.9% of women with births (63) in Richfield are married. The highest percentage of unmarried women with births falls into 35 to 50 years age bracket with 42.9% of them unmarried at the time of birth, while the lowest percentage of unmarried women with births belong to 20 to 34 years age bracket with 35.7% of them unmarried.
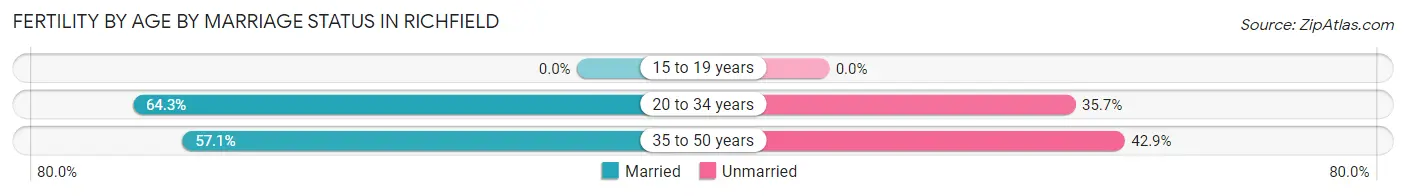
| Age Bracket | Married | Unmarried |
| 15 to 19 years | 0 (0.0%) | 0 (0.0%) |
| 20 to 34 years | 27 (64.3%) | 15 (35.7%) |
| 35 to 50 years | 12 (57.1%) | 9 (42.9%) |
| Total | 39 (61.9%) | 24 (38.1%) |
Fertility by Education in Richfield
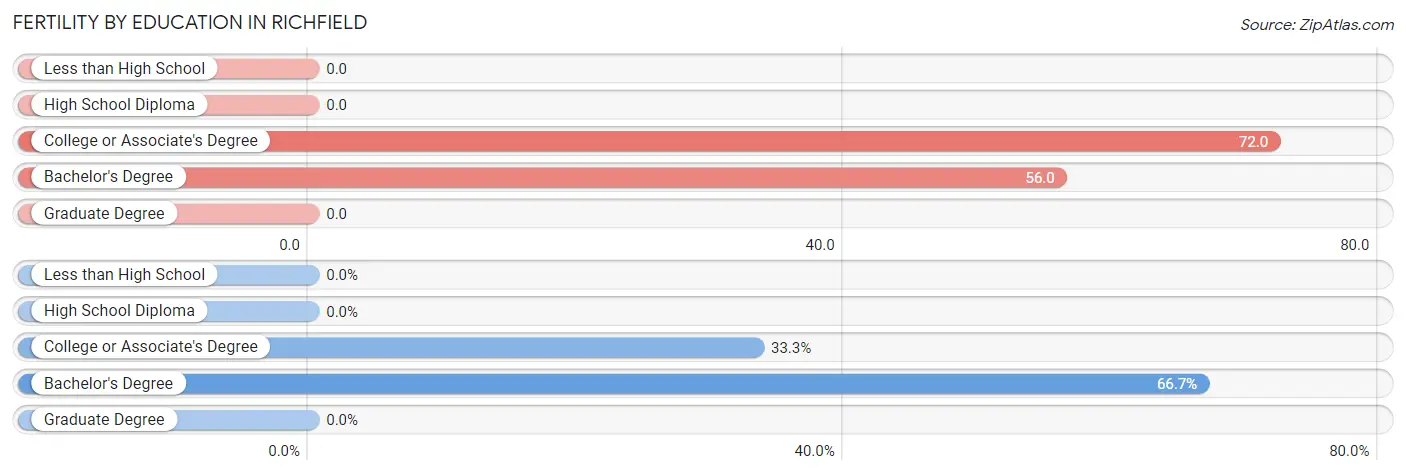
| Educational Attainment | Women with Births | Births / 1,000 Women |
| Less than High School | 0 (0.0%) | 0.0 |
| High School Diploma | 0 (0.0%) | 0.0 |
| College or Associate's Degree | 21 (33.3%) | 72.0 |
| Bachelor's Degree | 42 (66.7%) | 56.0 |
| Graduate Degree | 0 (0.0%) | 0.0 |
| Total | 63 (100.0%) | 31.0 |
Fertility by Education by Marriage Status in Richfield
38.1% of women with births in Richfield are unmarried. Women with the educational attainment of bachelor's degree are most likely to be married with 64.3% of them married at childbirth, while women with the educational attainment of college or associate's degree are least likely to be married with 42.9% of them unmarried at childbirth.
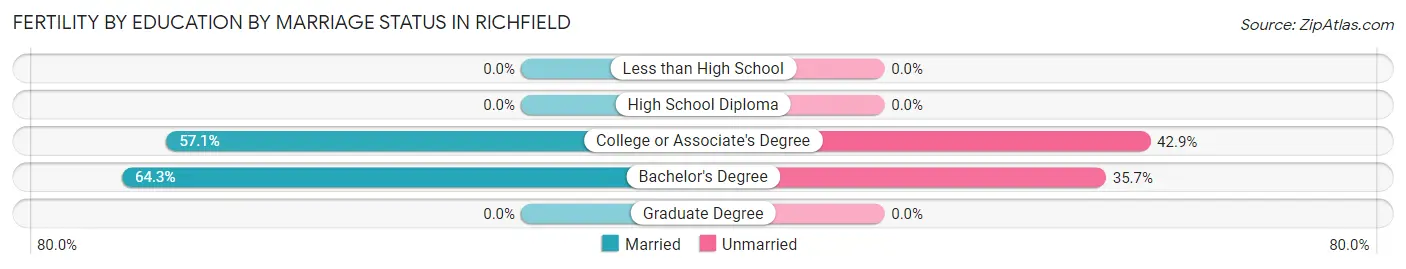
| Educational Attainment | Married | Unmarried |
| Less than High School | 0 (0.0%) | 0 (0.0%) |
| High School Diploma | 0 (0.0%) | 0 (0.0%) |
| College or Associate's Degree | 12 (57.1%) | 9 (42.9%) |
| Bachelor's Degree | 27 (64.3%) | 15 (35.7%) |
| Graduate Degree | 0 (0.0%) | 0 (0.0%) |
| Total | 39 (61.9%) | 24 (38.1%) |
Income in Richfield
Income Overview in Richfield
Per Capita Income in Richfield is $60,912, while median incomes of families and households are $148,580 and $128,165 respectively.
| Characteristic | Number | Measure |
| Per Capita Income | 11,757 | $60,912 |
| Median Family Income | 3,871 | $148,580 |
| Mean Family Income | 3,871 | $169,607 |
| Median Household Income | 4,479 | $128,165 |
| Mean Household Income | 4,479 | $156,123 |
| Income Deficit | 3,871 | $0 |
| Wage / Income Gap (%) | 11,757 | 38.18% |
| Wage / Income Gap ($) | 11,757 | 61.82¢ per $1 |
| Gini / Inequality Index | 11,757 | 0.39 |
Earnings by Sex in Richfield
Average Earnings in Richfield are $66,568, $79,841 for men and $49,357 for women, a difference of 38.2%.
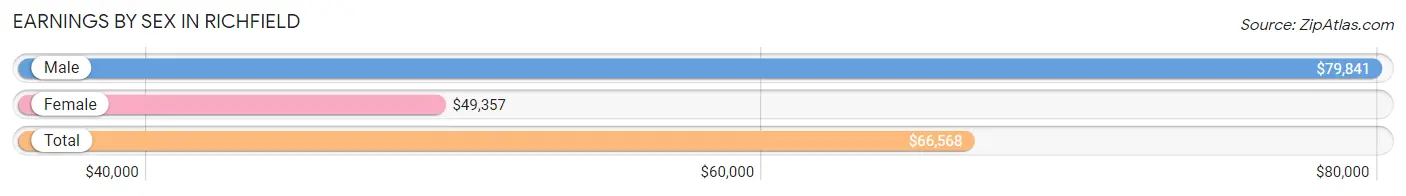
| Sex | Number | Average Earnings |
| Male | 3,851 (54.0%) | $79,841 |
| Female | 3,283 (46.0%) | $49,357 |
| Total | 7,134 (100.0%) | $66,568 |
Earnings by Sex by Income Bracket in Richfield
The most common earnings brackets in Richfield are $100,000+ for men (1,281 | 33.3%) and $100,000+ for women (606 | 18.5%).
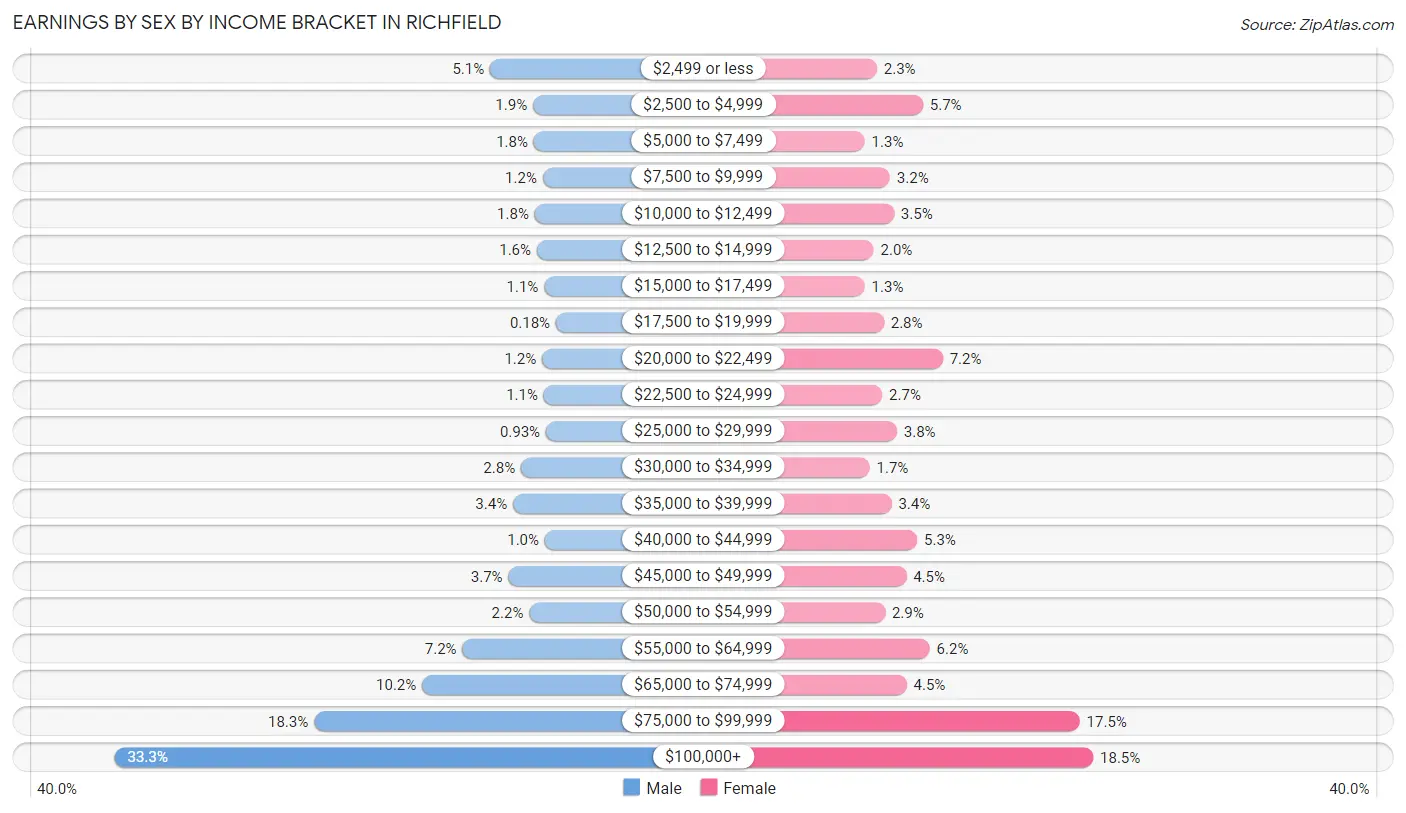
| Income | Male | Female |
| $2,499 or less | 197 (5.1%) | 74 (2.2%) |
| $2,500 to $4,999 | 73 (1.9%) | 187 (5.7%) |
| $5,000 to $7,499 | 71 (1.8%) | 44 (1.3%) |
| $7,500 to $9,999 | 45 (1.2%) | 106 (3.2%) |
| $10,000 to $12,499 | 68 (1.8%) | 116 (3.5%) |
| $12,500 to $14,999 | 62 (1.6%) | 66 (2.0%) |
| $15,000 to $17,499 | 41 (1.1%) | 44 (1.3%) |
| $17,500 to $19,999 | 7 (0.2%) | 91 (2.8%) |
| $20,000 to $22,499 | 47 (1.2%) | 236 (7.2%) |
| $22,500 to $24,999 | 42 (1.1%) | 87 (2.6%) |
| $25,000 to $29,999 | 36 (0.9%) | 123 (3.7%) |
| $30,000 to $34,999 | 108 (2.8%) | 56 (1.7%) |
| $35,000 to $39,999 | 131 (3.4%) | 110 (3.4%) |
| $40,000 to $44,999 | 39 (1.0%) | 173 (5.3%) |
| $45,000 to $49,999 | 144 (3.7%) | 146 (4.4%) |
| $50,000 to $54,999 | 84 (2.2%) | 94 (2.9%) |
| $55,000 to $64,999 | 277 (7.2%) | 204 (6.2%) |
| $65,000 to $74,999 | 393 (10.2%) | 147 (4.5%) |
| $75,000 to $99,999 | 705 (18.3%) | 573 (17.4%) |
| $100,000+ | 1,281 (33.3%) | 606 (18.5%) |
| Total | 3,851 (100.0%) | 3,283 (100.0%) |
Earnings by Sex by Educational Attainment in Richfield
Average earnings in Richfield are $90,231 for men and $58,185 for women, a difference of 35.5%. Men with an educational attainment of graduate degree enjoy the highest average annual earnings of $160,117, while those with high school diploma education earn the least with $70,027. Women with an educational attainment of graduate degree earn the most with the average annual earnings of $93,148, while those with high school diploma education have the smallest earnings of $42,241.
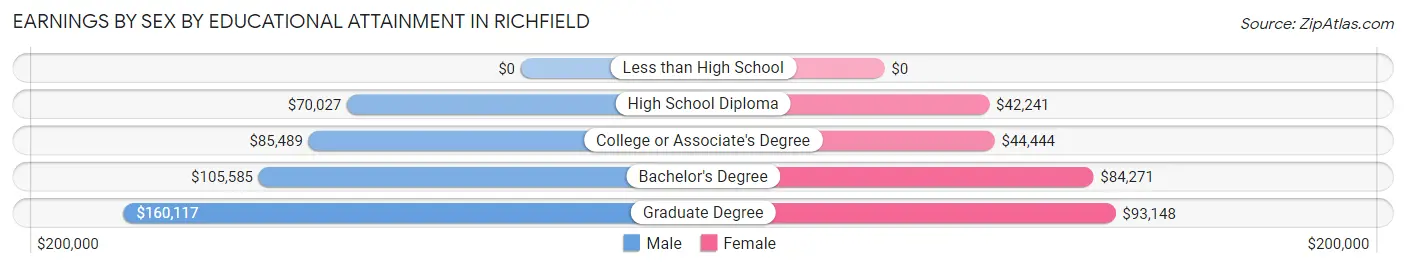
| Educational Attainment | Male Income | Female Income |
| Less than High School | - | - |
| High School Diploma | $70,027 | $42,241 |
| College or Associate's Degree | $85,489 | $44,444 |
| Bachelor's Degree | $105,585 | $84,271 |
| Graduate Degree | $160,117 | $93,148 |
| Total | $90,231 | $58,185 |
Family Income in Richfield
Family Income Brackets in Richfield
According to the Richfield family income data, there are 1,254 families falling into the $200,000+ income range, which is the most common income bracket and makes up 32.4% of all families. Conversely, the $10,000 to $14,999 income bracket is the least frequent group with only 23 families (0.6%) belonging to this category.
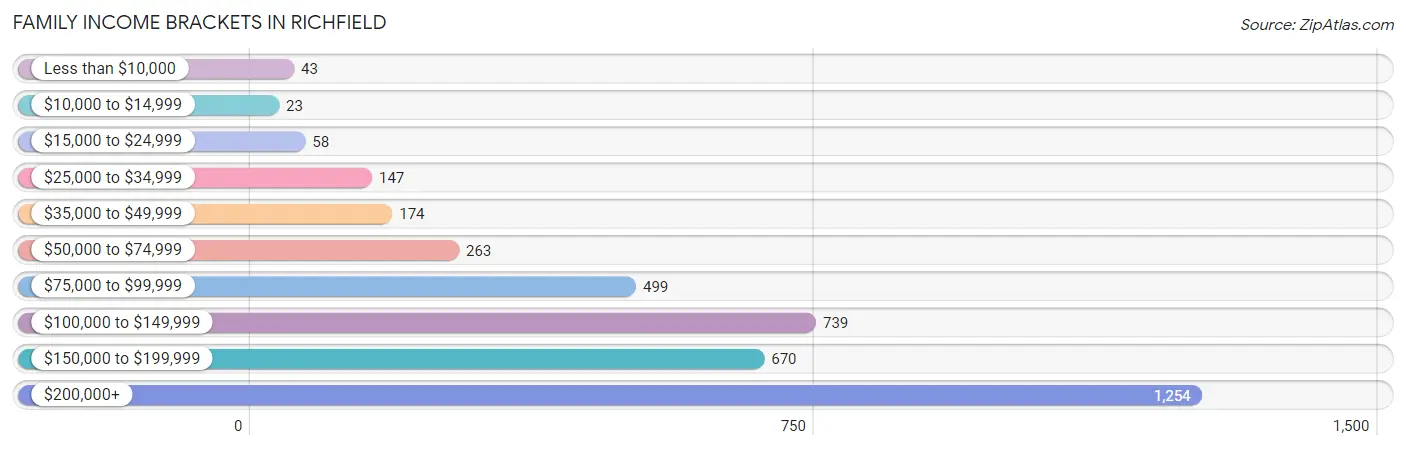
| Income Bracket | # Families | % Families |
| Less than $10,000 | 43 | 1.1% |
| $10,000 to $14,999 | 23 | 0.6% |
| $15,000 to $24,999 | 58 | 1.5% |
| $25,000 to $34,999 | 147 | 3.8% |
| $35,000 to $49,999 | 174 | 4.5% |
| $50,000 to $74,999 | 263 | 6.8% |
| $75,000 to $99,999 | 499 | 12.9% |
| $100,000 to $149,999 | 739 | 19.1% |
| $150,000 to $199,999 | 670 | 17.3% |
| $200,000+ | 1,254 | 32.4% |
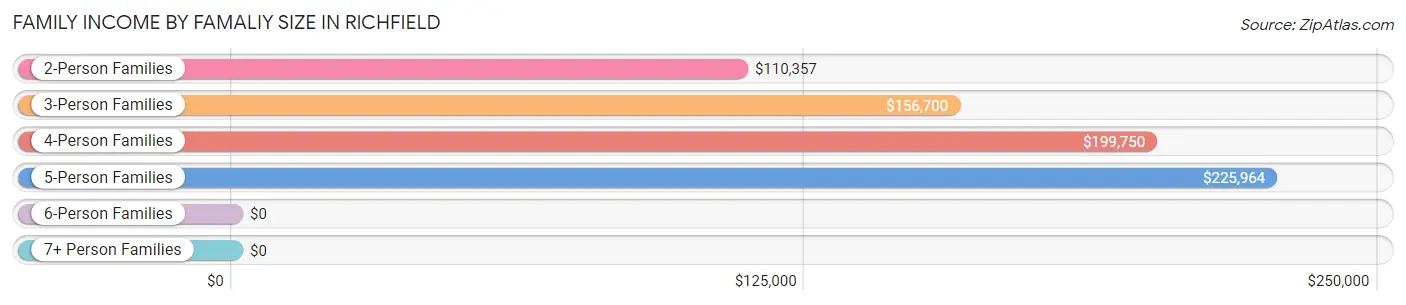
Family Income by Famaliy Size in Richfield
5-person families (235 | 6.1%) account for the highest median family income in Richfield with $225,964 per family, while 2-person families (2,292 | 59.2%) have the highest median income of $55,178 per family member.
| Income Bracket | # Families | Median Income |
| 2-Person Families | 2,292 (59.2%) | $110,357 |
| 3-Person Families | 548 (14.2%) | $156,700 |
| 4-Person Families | 741 (19.1%) | $199,750 |
| 5-Person Families | 235 (6.1%) | $225,964 |
| 6-Person Families | 0 (0.0%) | $0 |
| 7+ Person Families | 55 (1.4%) | $0 |
| Total | 3,871 (100.0%) | $148,580 |
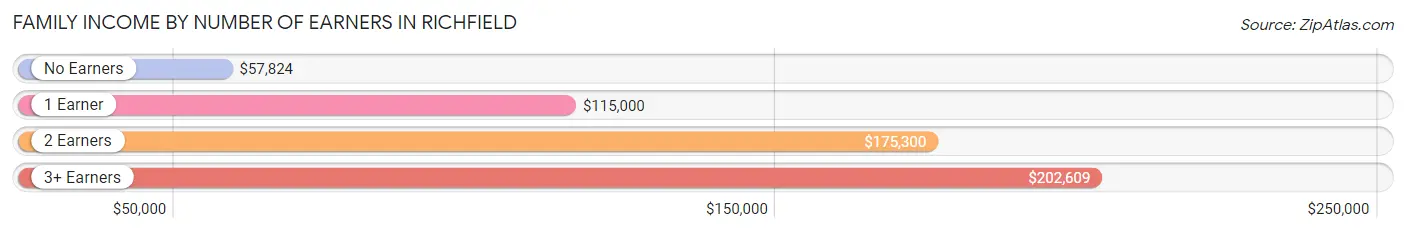
Family Income by Number of Earners in Richfield
The median family income in Richfield is $148,580, with families comprising 3+ earners (468) having the highest median family income of $202,609, while families with no earners (749) have the lowest median family income of $57,824, accounting for 12.1% and 19.4% of families, respectively.
| Number of Earners | # Families | Median Income |
| No Earners | 749 (19.4%) | $57,824 |
| 1 Earner | 636 (16.4%) | $115,000 |
| 2 Earners | 2,018 (52.1%) | $175,300 |
| 3+ Earners | 468 (12.1%) | $202,609 |
| Total | 3,871 (100.0%) | $148,580 |
Household Income in Richfield
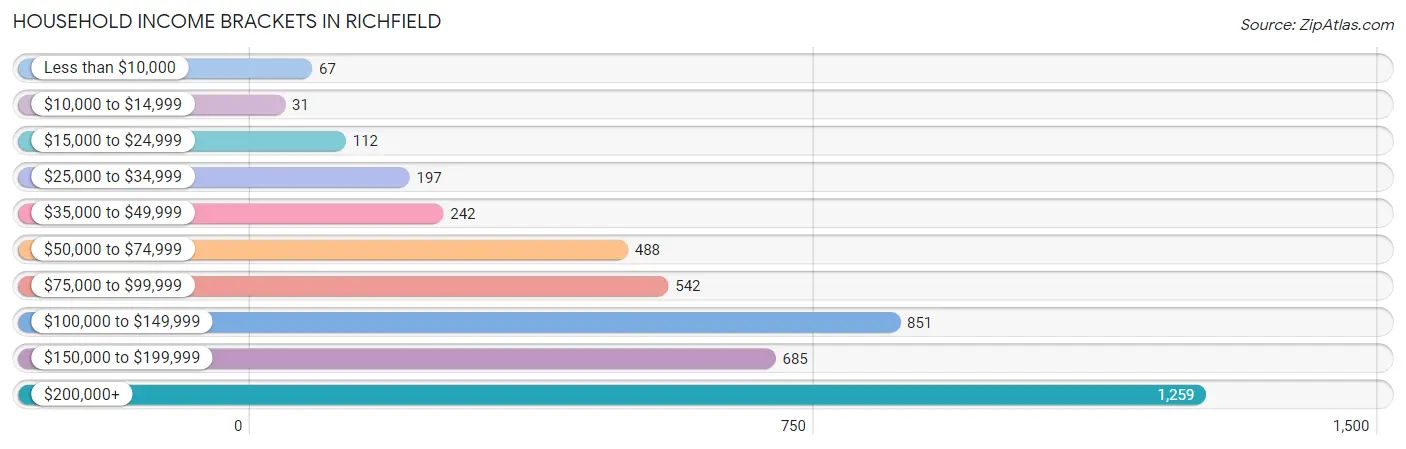
Household Income Brackets in Richfield
With 1,259 households falling in the category, the $200,000+ income range is the most frequent in Richfield, accounting for 28.1% of all households. In contrast, only 31 households (0.7%) fall into the $10,000 to $14,999 income bracket, making it the least populous group.
| Income Bracket | # Households | % Households |
| Less than $10,000 | 67 | 1.5% |
| $10,000 to $14,999 | 31 | 0.7% |
| $15,000 to $24,999 | 112 | 2.5% |
| $25,000 to $34,999 | 197 | 4.4% |
| $35,000 to $49,999 | 242 | 5.4% |
| $50,000 to $74,999 | 488 | 10.9% |
| $75,000 to $99,999 | 542 | 12.1% |
| $100,000 to $149,999 | 851 | 19.0% |
| $150,000 to $199,999 | 685 | 15.3% |
| $200,000+ | 1,259 | 28.1% |
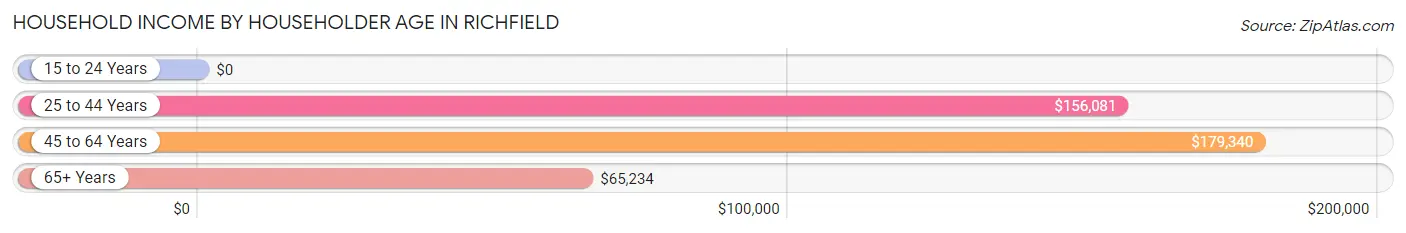
Household Income by Householder Age in Richfield
The median household income in Richfield is $128,165, with the highest median household income of $179,340 found in the 45 to 64 years age bracket for the primary householder. A total of 2,095 households (46.8%) fall into this category. Meanwhile, the 15 to 24 years age bracket for the primary householder has the lowest median household income of $0, with 33 households (0.7%) in this group.
| Income Bracket | # Households | Median Income |
| 15 to 24 Years | 33 (0.7%) | $0 |
| 25 to 44 Years | 1,039 (23.2%) | $156,081 |
| 45 to 64 Years | 2,095 (46.8%) | $179,340 |
| 65+ Years | 1,312 (29.3%) | $65,234 |
| Total | 4,479 (100.0%) | $128,165 |
Poverty in Richfield
Income Below Poverty by Sex and Age in Richfield
With 2.1% poverty level for males and 2.0% for females among the residents of Richfield, 12 to 14 year old males and 16 and 17 year old females are the most vulnerable to poverty, with 41 males (15.5%) and 32 females (22.2%) in their respective age groups living below the poverty level.
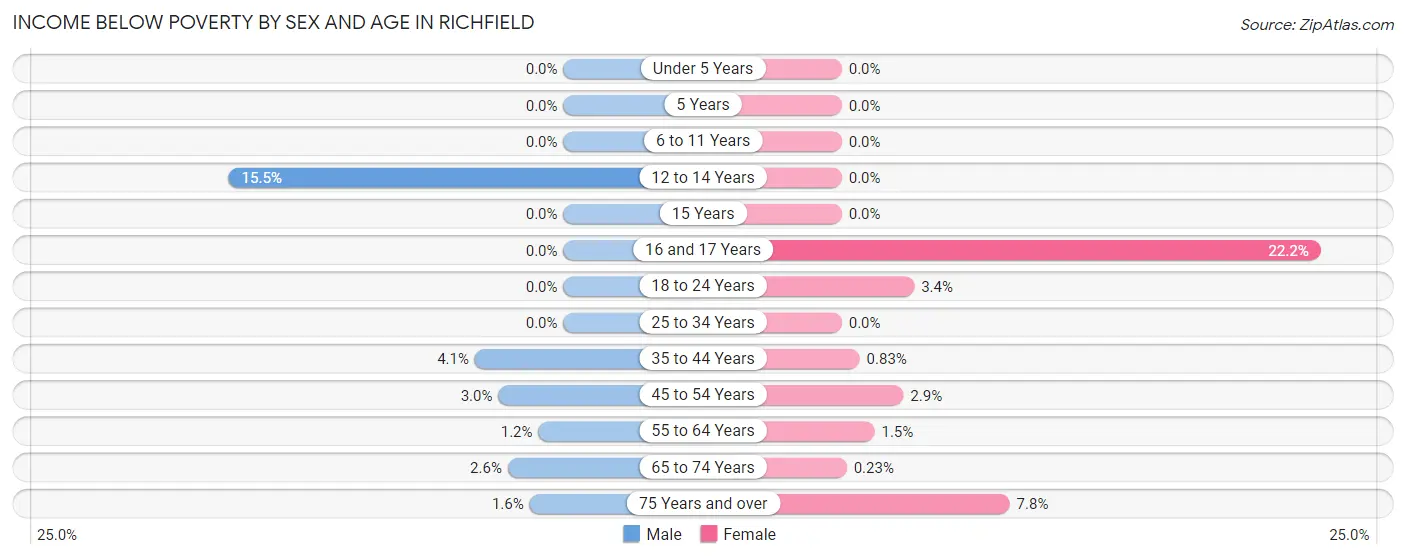
| Age Bracket | Male | Female |
| Under 5 Years | 0 (0.0%) | 0 (0.0%) |
| 5 Years | 0 (0.0%) | 0 (0.0%) |
| 6 to 11 Years | 0 (0.0%) | 0 (0.0%) |
| 12 to 14 Years | 41 (15.5%) | 0 (0.0%) |
| 15 Years | 0 (0.0%) | 0 (0.0%) |
| 16 and 17 Years | 0 (0.0%) | 32 (22.2%) |
| 18 to 24 Years | 0 (0.0%) | 10 (3.4%) |
| 25 to 34 Years | 0 (0.0%) | 0 (0.0%) |
| 35 to 44 Years | 23 (4.1%) | 5 (0.8%) |
| 45 to 54 Years | 24 (3.0%) | 30 (2.9%) |
| 55 to 64 Years | 14 (1.2%) | 14 (1.5%) |
| 65 to 74 Years | 14 (2.6%) | 2 (0.2%) |
| 75 Years and over | 9 (1.6%) | 25 (7.8%) |
| Total | 125 (2.1%) | 118 (2.0%) |
Income Above Poverty by Sex and Age in Richfield
According to the poverty statistics in Richfield, males aged under 5 years and females aged under 5 years are the age groups that are most secure financially, with 100.0% of males and 100.0% of females in these age groups living above the poverty line.
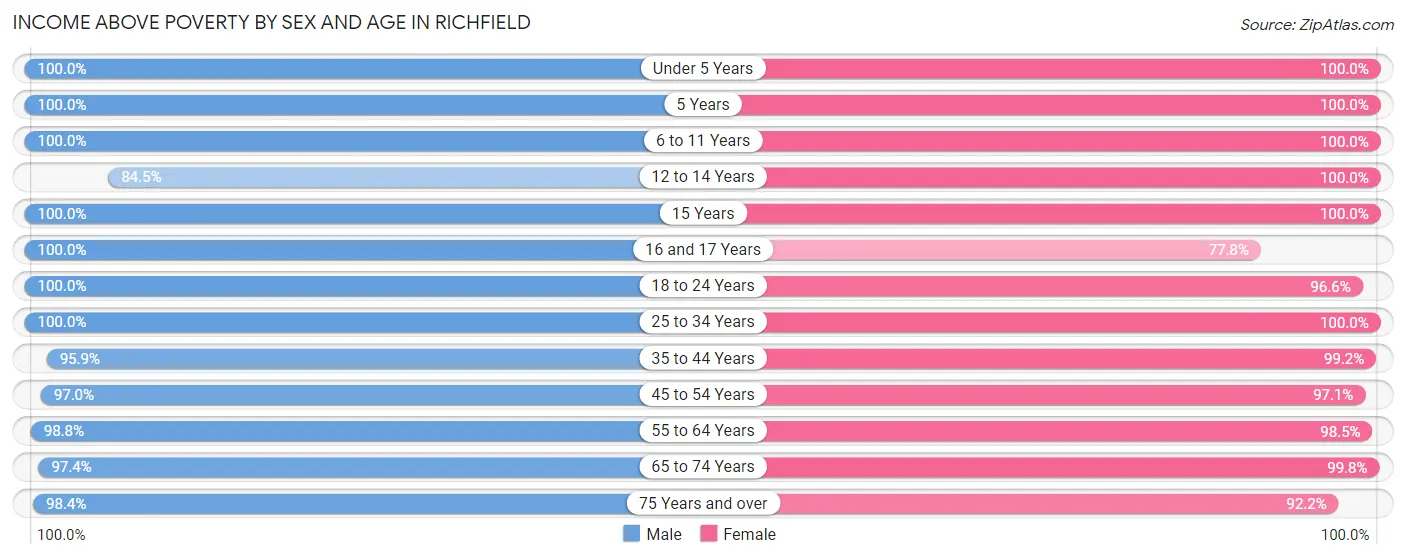
| Age Bracket | Male | Female |
| Under 5 Years | 233 (100.0%) | 171 (100.0%) |
| 5 Years | 94 (100.0%) | 217 (100.0%) |
| 6 to 11 Years | 343 (100.0%) | 295 (100.0%) |
| 12 to 14 Years | 223 (84.5%) | 254 (100.0%) |
| 15 Years | 102 (100.0%) | 208 (100.0%) |
| 16 and 17 Years | 129 (100.0%) | 112 (77.8%) |
| 18 to 24 Years | 527 (100.0%) | 288 (96.6%) |
| 25 to 34 Years | 617 (100.0%) | 441 (100.0%) |
| 35 to 44 Years | 537 (95.9%) | 595 (99.2%) |
| 45 to 54 Years | 770 (97.0%) | 1,018 (97.1%) |
| 55 to 64 Years | 1,189 (98.8%) | 905 (98.5%) |
| 65 to 74 Years | 529 (97.4%) | 856 (99.8%) |
| 75 Years and over | 565 (98.4%) | 296 (92.2%) |
| Total | 5,858 (97.9%) | 5,656 (98.0%) |
Income Below Poverty Among Married-Couple Families in Richfield
The poverty statistics for married-couple families in Richfield show that 0.6% or 22 of the total 3,551 families live below the poverty line. Families with no children have the highest poverty rate of 0.9%, comprising of 22 families. On the other hand, families with 1 or 2 children have the lowest poverty rate of 0.0%, which includes 0 families.
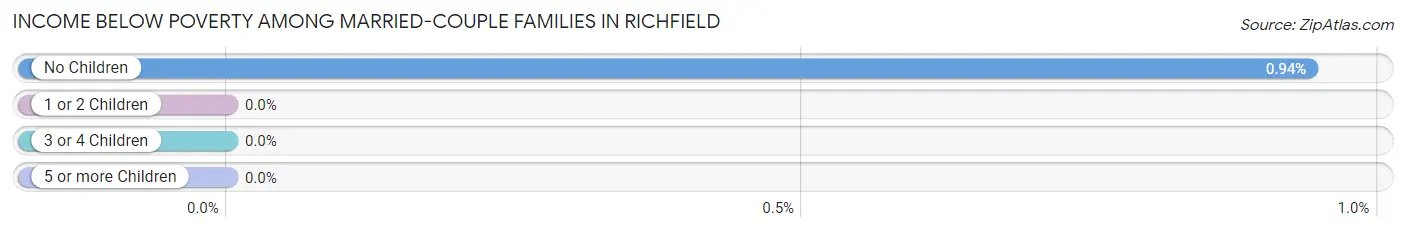
| Children | Above Poverty | Below Poverty |
| No Children | 2,329 (99.1%) | 22 (0.9%) |
| 1 or 2 Children | 957 (100.0%) | 0 (0.0%) |
| 3 or 4 Children | 210 (100.0%) | 0 (0.0%) |
| 5 or more Children | 33 (100.0%) | 0 (0.0%) |
| Total | 3,529 (99.4%) | 22 (0.6%) |
Income Below Poverty Among Single-Parent Households in Richfield
According to the poverty data in Richfield, 8.6% or 14 single-father households and 19.1% or 30 single-mother households are living below the poverty line. Among single-father households, those with 1 or 2 children have the highest poverty rate, with 14 households (27.5%) experiencing poverty. Likewise, among single-mother households, those with 1 or 2 children have the highest poverty rate, with 30 households (50.8%) falling below the poverty line.
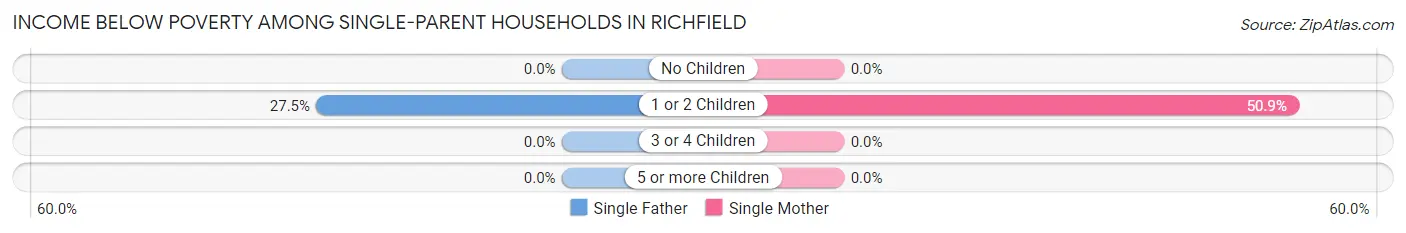
| Children | Single Father | Single Mother |
| No Children | 0 (0.0%) | 0 (0.0%) |
| 1 or 2 Children | 14 (27.5%) | 30 (50.8%) |
| 3 or 4 Children | 0 (0.0%) | 0 (0.0%) |
| 5 or more Children | 0 (0.0%) | 0 (0.0%) |
| Total | 14 (8.6%) | 30 (19.1%) |
Income Below Poverty Among Married-Couple vs Single-Parent Households in Richfield
The poverty data for Richfield shows that 22 of the married-couple family households (0.6%) and 44 of the single-parent households (13.8%) are living below the poverty level. Within the married-couple family households, those with no children have the highest poverty rate, with 22 households (0.9%) falling below the poverty line. Among the single-parent households, those with 1 or 2 children have the highest poverty rate, with 44 household (40.0%) living below poverty.
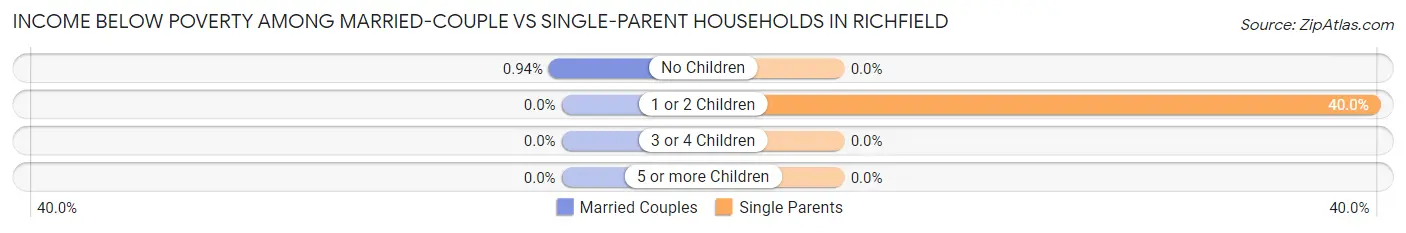
| Children | Married-Couple Families | Single-Parent Households |
| No Children | 22 (0.9%) | 0 (0.0%) |
| 1 or 2 Children | 0 (0.0%) | 44 (40.0%) |
| 3 or 4 Children | 0 (0.0%) | 0 (0.0%) |
| 5 or more Children | 0 (0.0%) | 0 (0.0%) |
| Total | 22 (0.6%) | 44 (13.8%) |
Employment Characteristics in Richfield
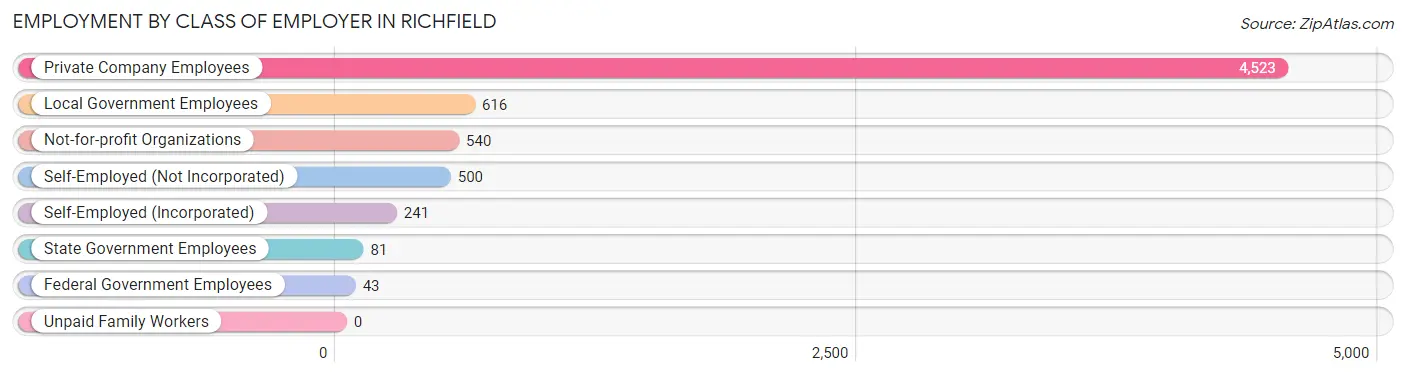
Employment by Class of Employer in Richfield
Among the 6,544 employed individuals in Richfield, private company employees (4,523 | 69.1%), local government employees (616 | 9.4%), and not-for-profit organizations (540 | 8.3%) make up the most common classes of employment.
| Employer Class | # Employees | % Employees |
| Private Company Employees | 4,523 | 69.1% |
| Self-Employed (Incorporated) | 241 | 3.7% |
| Self-Employed (Not Incorporated) | 500 | 7.6% |
| Not-for-profit Organizations | 540 | 8.3% |
| Local Government Employees | 616 | 9.4% |
| State Government Employees | 81 | 1.2% |
| Federal Government Employees | 43 | 0.7% |
| Unpaid Family Workers | 0 | 0.0% |
| Total | 6,544 | 100.0% |
Employment Status by Age in Richfield
According to the labor force statistics for Richfield, out of the total population over 16 years of age (9,576), 70.6% or 6,761 individuals are in the labor force, with 1.0% or 68 of them unemployed. The age group with the highest labor force participation rate is 25 to 29 years, with 100.0% or 311 individuals in the labor force. Within the labor force, the 25 to 29 years age range has the highest percentage of unemployed individuals, with 6.4% or 20 of them being unemployed.
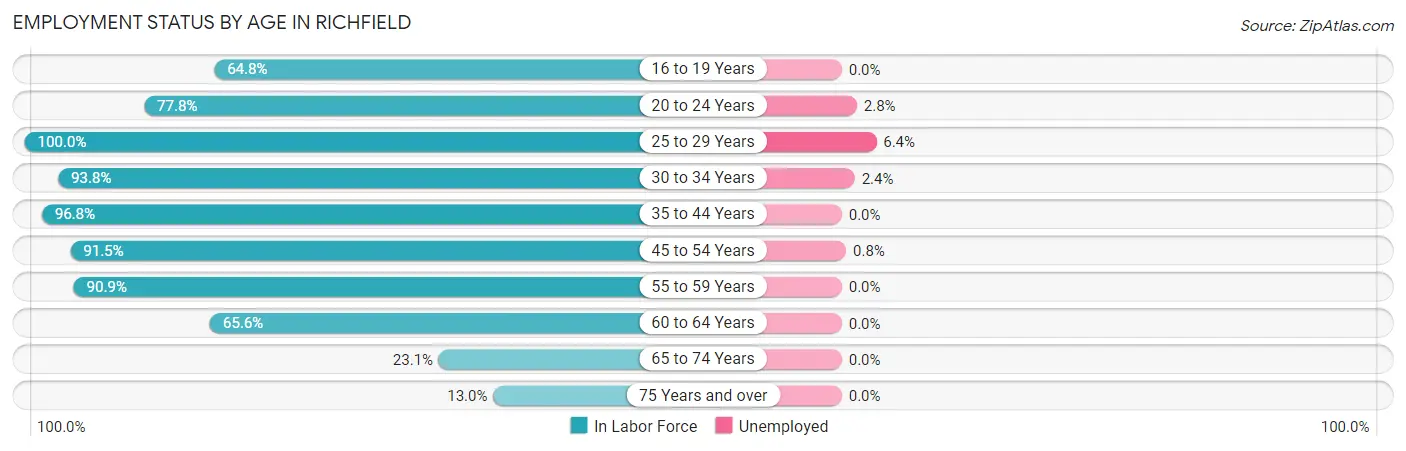
| Age Bracket | In Labor Force | Unemployed |
| 16 to 19 Years | 259 (64.8%) | 0 (0.0%) |
| 20 to 24 Years | 543 (77.8%) | 15 (2.8%) |
| 25 to 29 Years | 311 (100.0%) | 20 (6.4%) |
| 30 to 34 Years | 701 (93.8%) | 17 (2.4%) |
| 35 to 44 Years | 1,123 (96.8%) | 0 (0.0%) |
| 45 to 54 Years | 1,685 (91.5%) | 13 (0.8%) |
| 55 to 59 Years | 1,091 (90.9%) | 0 (0.0%) |
| 60 to 64 Years | 605 (65.6%) | 0 (0.0%) |
| 65 to 74 Years | 324 (23.1%) | 0 (0.0%) |
| 75 Years and over | 116 (13.0%) | 0 (0.0%) |
| Total | 6,761 (70.6%) | 68 (1.0%) |
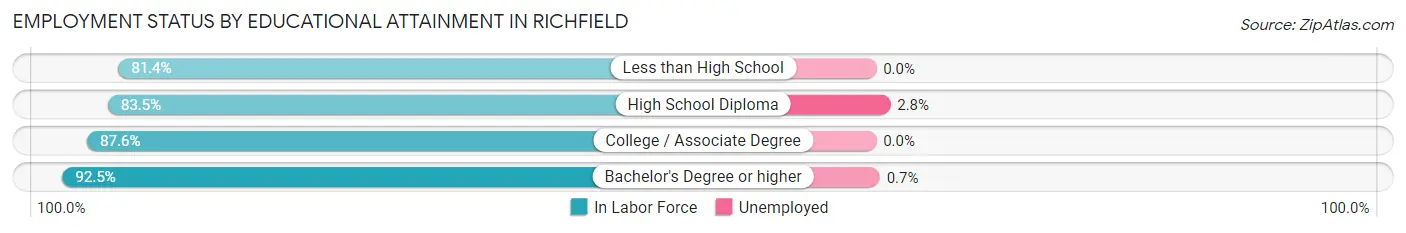
Employment Status by Educational Attainment in Richfield
According to labor force statistics for Richfield, 89.2% of individuals (5,514) out of the total population between 25 and 64 years of age (6,182) are in the labor force, with 0.9% or 50 of them being unemployed. The group with the highest labor force participation rate are those with the educational attainment of bachelor's degree or higher, with 92.5% or 3,054 individuals in the labor force. Within the labor force, individuals with high school diploma education have the highest percentage of unemployment, with 2.8% or 30 of them being unemployed.
| Educational Attainment | In Labor Force | Unemployed |
| Less than High School | 92 (81.4%) | 0 (0.0%) |
| High School Diploma | 1,060 (83.5%) | 36 (2.8%) |
| College / Associate Degree | 1,311 (87.6%) | 0 (0.0%) |
| Bachelor's Degree or higher | 3,054 (92.5%) | 23 (0.7%) |
| Total | 5,514 (89.2%) | 56 (0.9%) |
Employment Occupations by Sex in Richfield
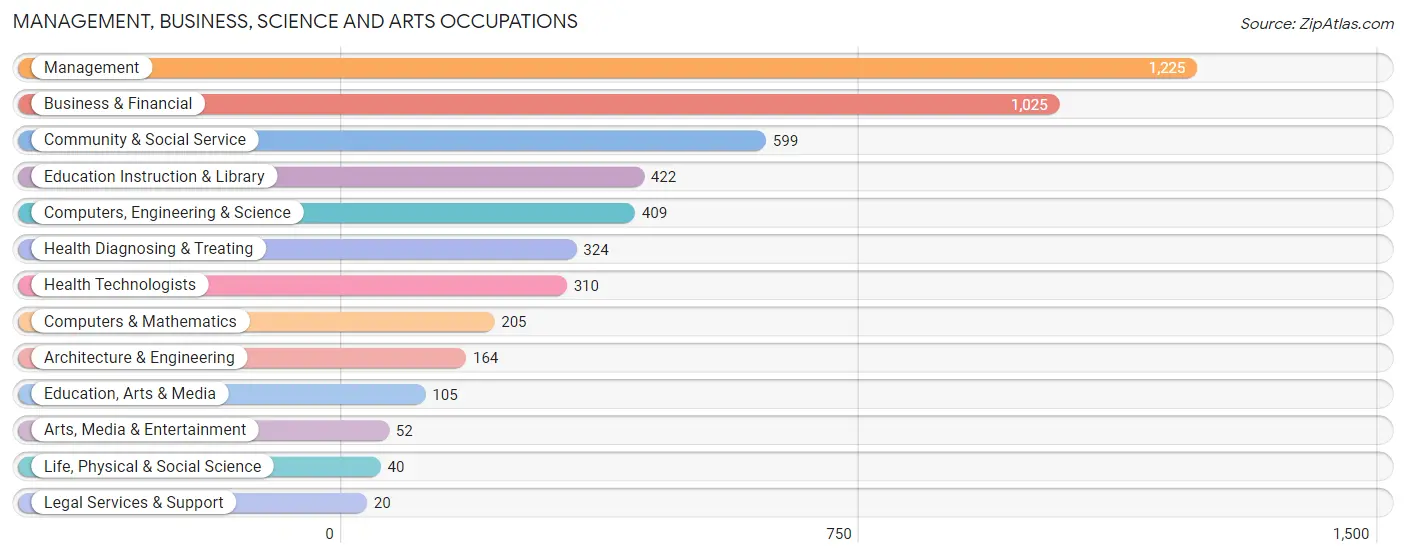
Management, Business, Science and Arts Occupations
The most common Management, Business, Science and Arts occupations in Richfield are Management (1,225 | 18.3%), Business & Financial (1,025 | 15.3%), Community & Social Service (599 | 8.9%), Education Instruction & Library (422 | 6.3%), and Computers, Engineering & Science (409 | 6.1%).
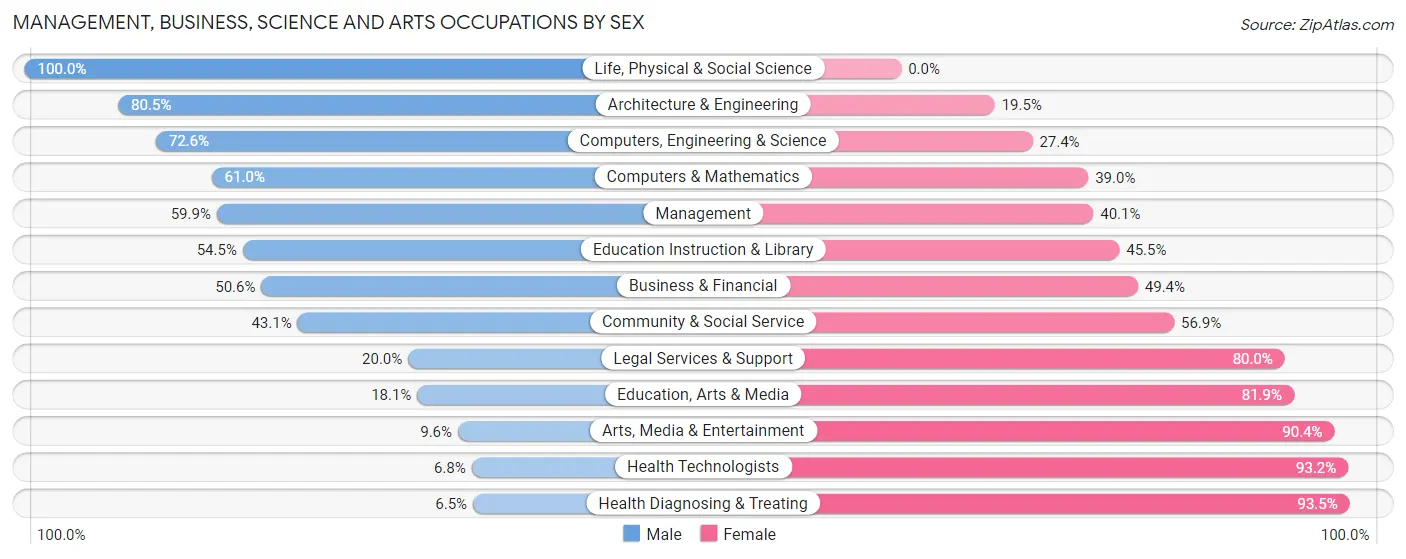
Management, Business, Science and Arts Occupations by Sex
Within the Management, Business, Science and Arts occupations in Richfield, the most male-oriented occupations are Life, Physical & Social Science (100.0%), Architecture & Engineering (80.5%), and Computers, Engineering & Science (72.6%), while the most female-oriented occupations are Health Diagnosing & Treating (93.5%), Health Technologists (93.2%), and Arts, Media & Entertainment (90.4%).
| Occupation | Male | Female |
| Management | 734 (59.9%) | 491 (40.1%) |
| Business & Financial | 519 (50.6%) | 506 (49.4%) |
| Computers, Engineering & Science | 297 (72.6%) | 112 (27.4%) |
| Computers & Mathematics | 125 (61.0%) | 80 (39.0%) |
| Architecture & Engineering | 132 (80.5%) | 32 (19.5%) |
| Life, Physical & Social Science | 40 (100.0%) | 0 (0.0%) |
| Community & Social Service | 258 (43.1%) | 341 (56.9%) |
| Education, Arts & Media | 19 (18.1%) | 86 (81.9%) |
| Legal Services & Support | 4 (20.0%) | 16 (80.0%) |
| Education Instruction & Library | 230 (54.5%) | 192 (45.5%) |
| Arts, Media & Entertainment | 5 (9.6%) | 47 (90.4%) |
| Health Diagnosing & Treating | 21 (6.5%) | 303 (93.5%) |
| Health Technologists | 21 (6.8%) | 289 (93.2%) |
| Total (Category) | 1,829 (51.1%) | 1,753 (48.9%) |
| Total (Overall) | 3,661 (54.7%) | 3,031 (45.3%) |
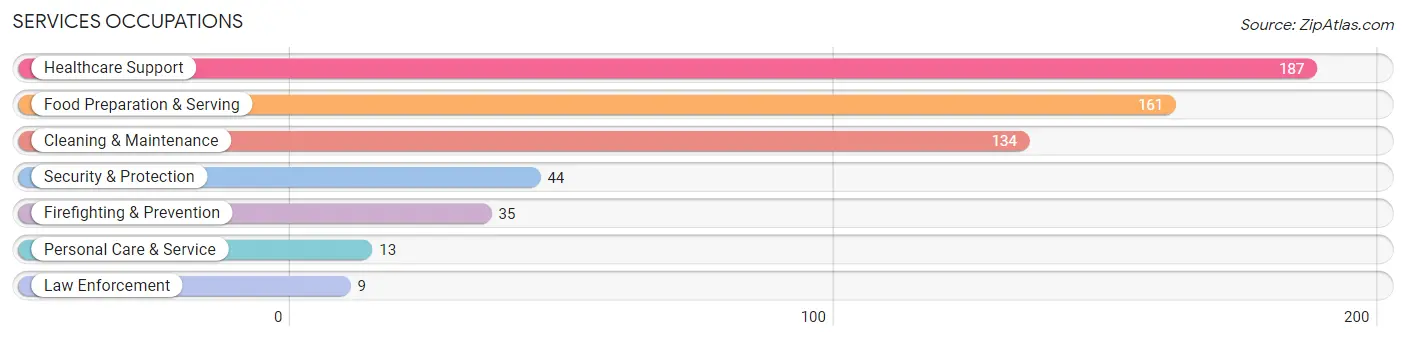
Services Occupations
The most common Services occupations in Richfield are Healthcare Support (187 | 2.8%), Food Preparation & Serving (161 | 2.4%), Cleaning & Maintenance (134 | 2.0%), Security & Protection (44 | 0.7%), and Firefighting & Prevention (35 | 0.5%).
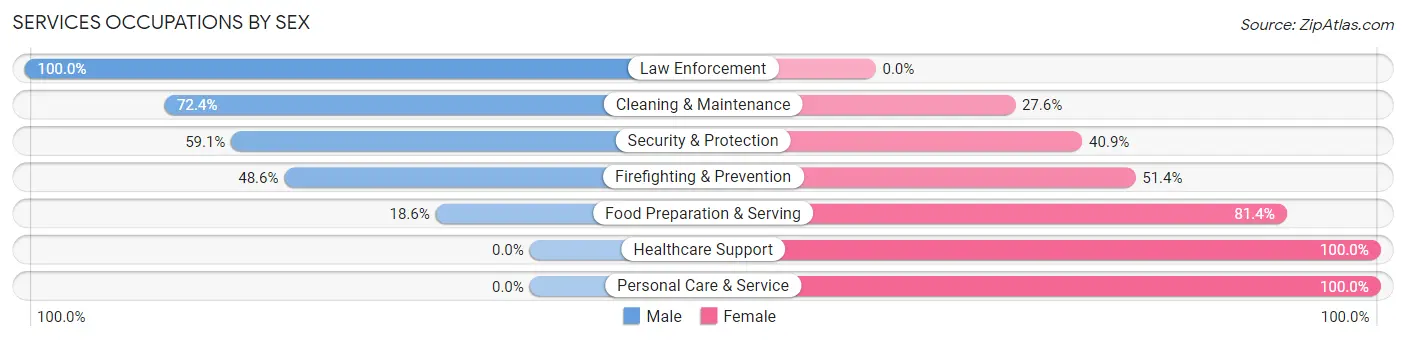
Services Occupations by Sex
Within the Services occupations in Richfield, the most male-oriented occupations are Law Enforcement (100.0%), Cleaning & Maintenance (72.4%), and Security & Protection (59.1%), while the most female-oriented occupations are Healthcare Support (100.0%), Personal Care & Service (100.0%), and Food Preparation & Serving (81.4%).
| Occupation | Male | Female |
| Healthcare Support | 0 (0.0%) | 187 (100.0%) |
| Security & Protection | 26 (59.1%) | 18 (40.9%) |
| Firefighting & Prevention | 17 (48.6%) | 18 (51.4%) |
| Law Enforcement | 9 (100.0%) | 0 (0.0%) |
| Food Preparation & Serving | 30 (18.6%) | 131 (81.4%) |
| Cleaning & Maintenance | 97 (72.4%) | 37 (27.6%) |
| Personal Care & Service | 0 (0.0%) | 13 (100.0%) |
| Total (Category) | 153 (28.4%) | 386 (71.6%) |
| Total (Overall) | 3,661 (54.7%) | 3,031 (45.3%) |
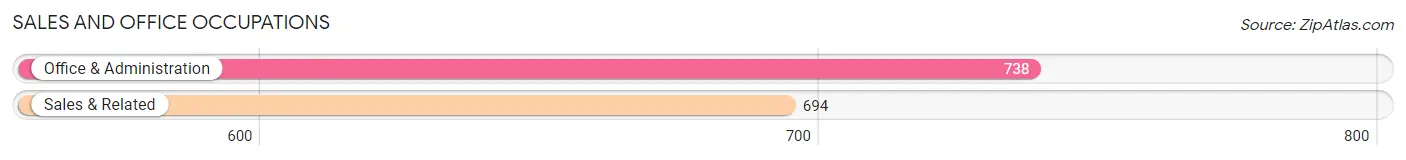
Sales and Office Occupations
The most common Sales and Office occupations in Richfield are Office & Administration (738 | 11.0%), and Sales & Related (694 | 10.4%).
Sales and Office Occupations by Sex
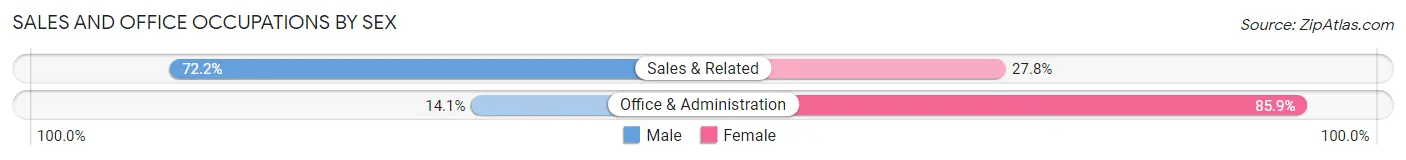
| Occupation | Male | Female |
| Sales & Related | 501 (72.2%) | 193 (27.8%) |
| Office & Administration | 104 (14.1%) | 634 (85.9%) |
| Total (Category) | 605 (42.2%) | 827 (57.8%) |
| Total (Overall) | 3,661 (54.7%) | 3,031 (45.3%) |
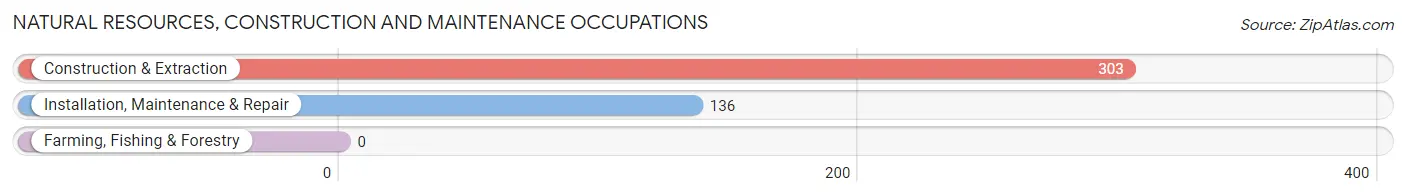
Natural Resources, Construction and Maintenance Occupations
The most common Natural Resources, Construction and Maintenance occupations in Richfield are Construction & Extraction (303 | 4.5%), and Installation, Maintenance & Repair (136 | 2.0%).
Natural Resources, Construction and Maintenance Occupations by Sex
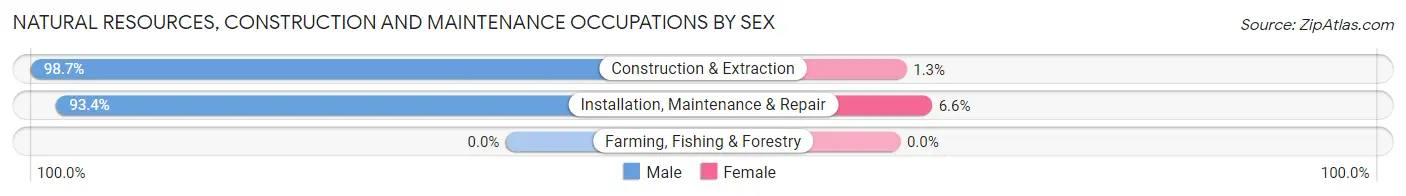
| Occupation | Male | Female |
| Farming, Fishing & Forestry | 0 (0.0%) | 0 (0.0%) |
| Construction & Extraction | 299 (98.7%) | 4 (1.3%) |
| Installation, Maintenance & Repair | 127 (93.4%) | 9 (6.6%) |
| Total (Category) | 426 (97.0%) | 13 (3.0%) |
| Total (Overall) | 3,661 (54.7%) | 3,031 (45.3%) |
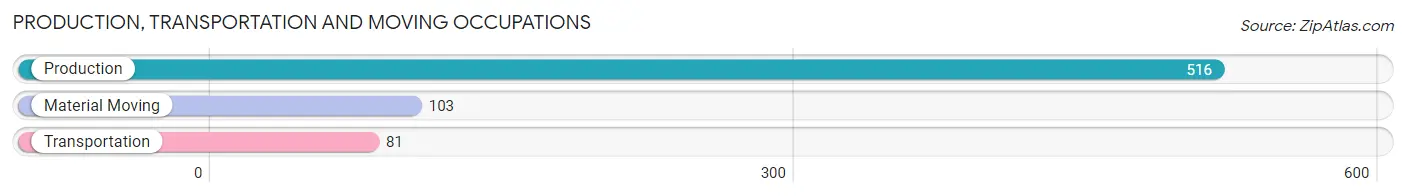
Production, Transportation and Moving Occupations
The most common Production, Transportation and Moving occupations in Richfield are Production (516 | 7.7%), Material Moving (103 | 1.5%), and Transportation (81 | 1.2%).
Production, Transportation and Moving Occupations by Sex
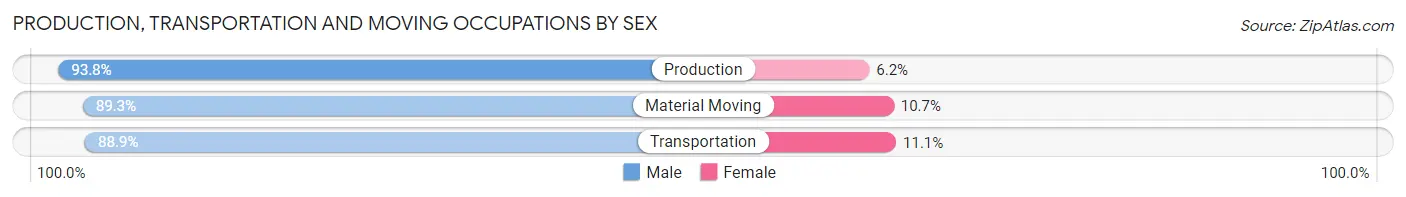
| Occupation | Male | Female |
| Production | 484 (93.8%) | 32 (6.2%) |
| Transportation | 72 (88.9%) | 9 (11.1%) |
| Material Moving | 92 (89.3%) | 11 (10.7%) |
| Total (Category) | 648 (92.6%) | 52 (7.4%) |
| Total (Overall) | 3,661 (54.7%) | 3,031 (45.3%) |
Employment Industries by Sex in Richfield
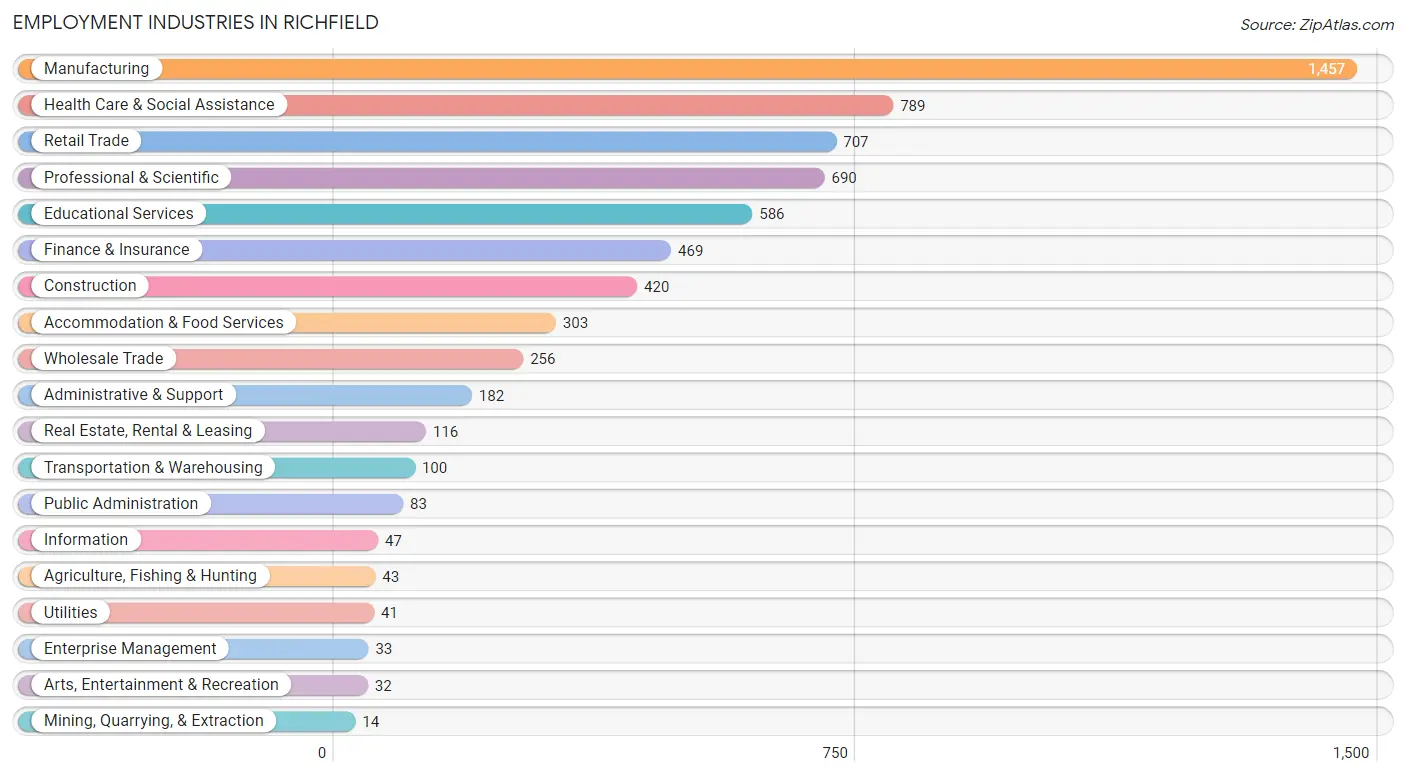
Employment Industries in Richfield
The major employment industries in Richfield include Manufacturing (1,457 | 21.8%), Health Care & Social Assistance (789 | 11.8%), Retail Trade (707 | 10.6%), Professional & Scientific (690 | 10.3%), and Educational Services (586 | 8.8%).
Employment Industries by Sex in Richfield
The Richfield industries that see more men than women are Agriculture, Fishing & Hunting (100.0%), Mining, Quarrying, & Extraction (100.0%), and Utilities (100.0%), whereas the industries that tend to have a higher number of women are Information (100.0%), Accommodation & Food Services (94.1%), and Health Care & Social Assistance (87.2%).
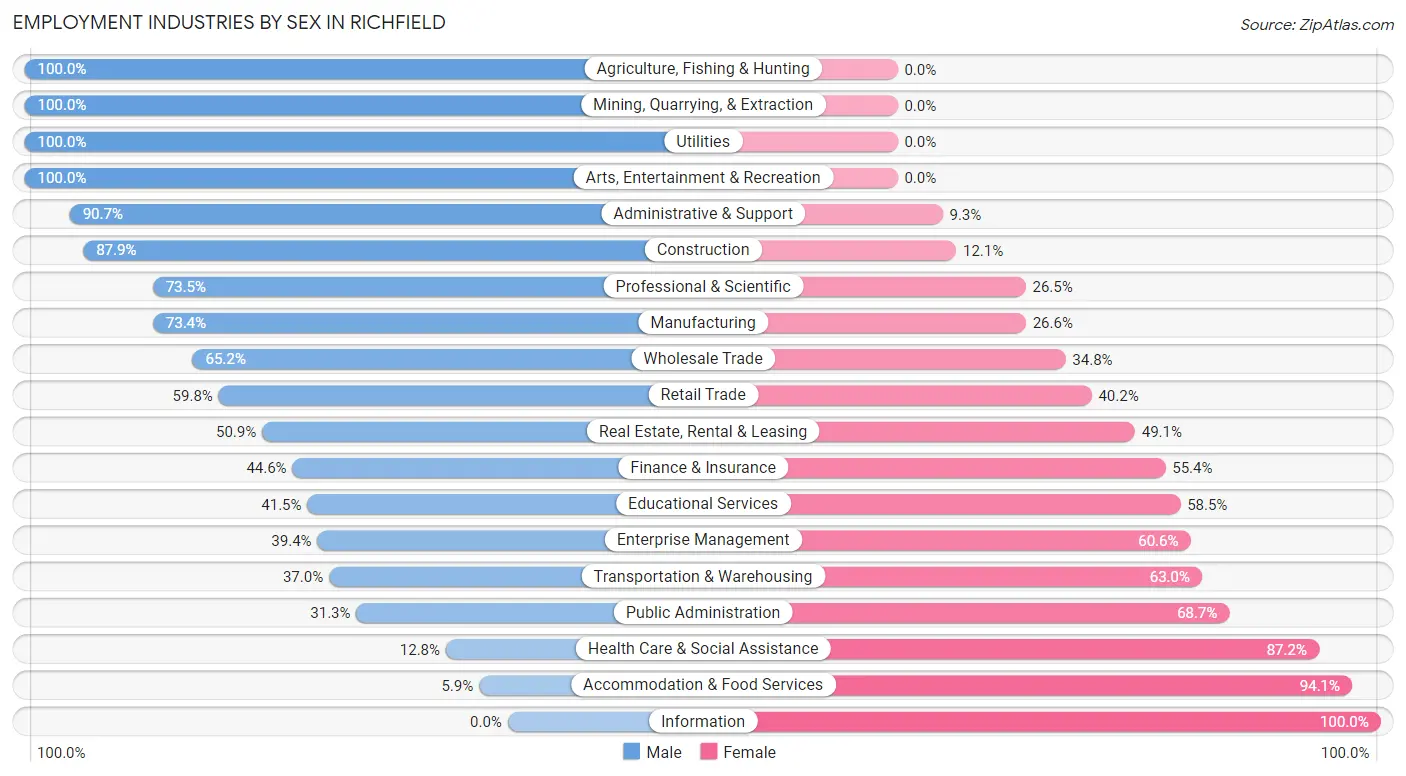
| Industry | Male | Female |
| Agriculture, Fishing & Hunting | 43 (100.0%) | 0 (0.0%) |
| Mining, Quarrying, & Extraction | 14 (100.0%) | 0 (0.0%) |
| Construction | 369 (87.9%) | 51 (12.1%) |
| Manufacturing | 1,070 (73.4%) | 387 (26.6%) |
| Wholesale Trade | 167 (65.2%) | 89 (34.8%) |
| Retail Trade | 423 (59.8%) | 284 (40.2%) |
| Transportation & Warehousing | 37 (37.0%) | 63 (63.0%) |
| Utilities | 41 (100.0%) | 0 (0.0%) |
| Information | 0 (0.0%) | 47 (100.0%) |
| Finance & Insurance | 209 (44.6%) | 260 (55.4%) |
| Real Estate, Rental & Leasing | 59 (50.9%) | 57 (49.1%) |
| Professional & Scientific | 507 (73.5%) | 183 (26.5%) |
| Enterprise Management | 13 (39.4%) | 20 (60.6%) |
| Administrative & Support | 165 (90.7%) | 17 (9.3%) |
| Educational Services | 243 (41.5%) | 343 (58.5%) |
| Health Care & Social Assistance | 101 (12.8%) | 688 (87.2%) |
| Arts, Entertainment & Recreation | 32 (100.0%) | 0 (0.0%) |
| Accommodation & Food Services | 18 (5.9%) | 285 (94.1%) |
| Public Administration | 26 (31.3%) | 57 (68.7%) |
| Total | 3,661 (54.7%) | 3,031 (45.3%) |
Education in Richfield
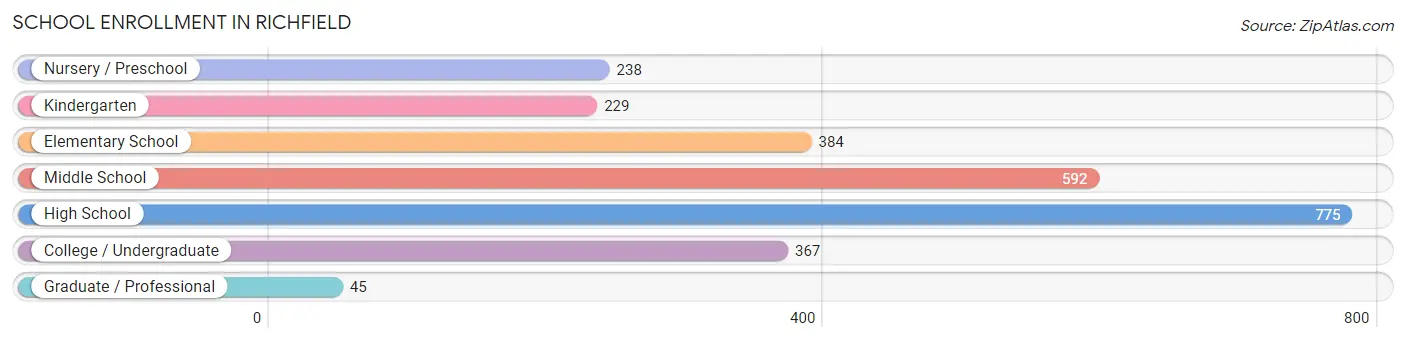
School Enrollment in Richfield
The most common levels of schooling among the 2,630 students in Richfield are high school (775 | 29.5%), middle school (592 | 22.5%), and elementary school (384 | 14.6%).
| School Level | # Students | % Students |
| Nursery / Preschool | 238 | 9.0% |
| Kindergarten | 229 | 8.7% |
| Elementary School | 384 | 14.6% |
| Middle School | 592 | 22.5% |
| High School | 775 | 29.5% |
| College / Undergraduate | 367 | 14.0% |
| Graduate / Professional | 45 | 1.7% |
| Total | 2,630 | 100.0% |
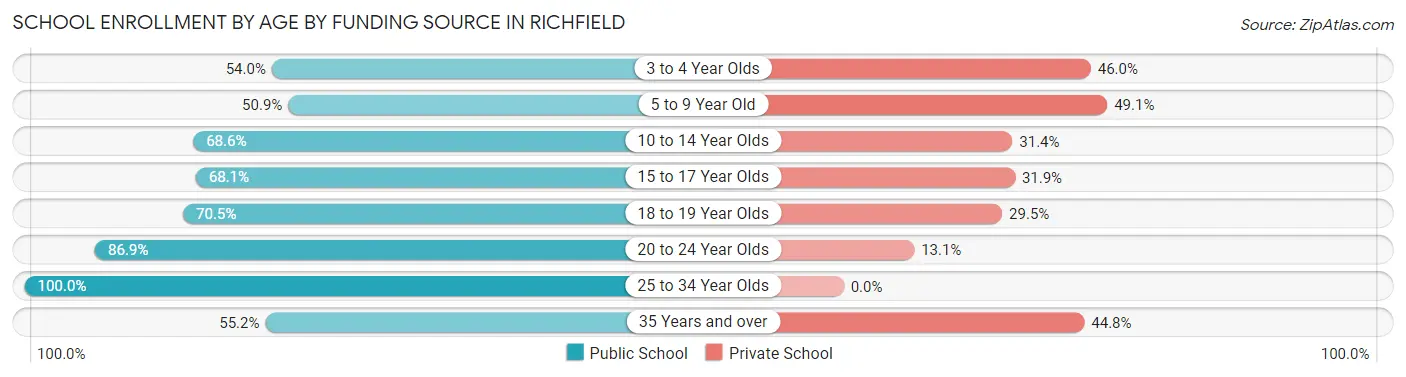
School Enrollment by Age by Funding Source in Richfield
Out of a total of 2,630 students who are enrolled in schools in Richfield, 897 (34.1%) attend a private institution, while the remaining 1,733 (65.9%) are enrolled in public schools. The age group of 5 to 9 year old has the highest likelihood of being enrolled in private schools, with 349 (49.1% in the age bracket) enrolled. Conversely, the age group of 25 to 34 year olds has the lowest likelihood of being enrolled in a private school, with 50 (100.0% in the age bracket) attending a public institution.
| Age Bracket | Public School | Private School |
| 3 to 4 Year Olds | 34 (54.0%) | 29 (46.0%) |
| 5 to 9 Year Old | 362 (50.9%) | 349 (49.1%) |
| 10 to 14 Year Olds | 513 (68.6%) | 235 (31.4%) |
| 15 to 17 Year Olds | 397 (68.1%) | 186 (31.9%) |
| 18 to 19 Year Olds | 74 (70.5%) | 31 (29.5%) |
| 20 to 24 Year Olds | 271 (86.9%) | 41 (13.1%) |
| 25 to 34 Year Olds | 50 (100.0%) | 0 (0.0%) |
| 35 Years and over | 32 (55.2%) | 26 (44.8%) |
| Total | 1,733 (65.9%) | 897 (34.1%) |
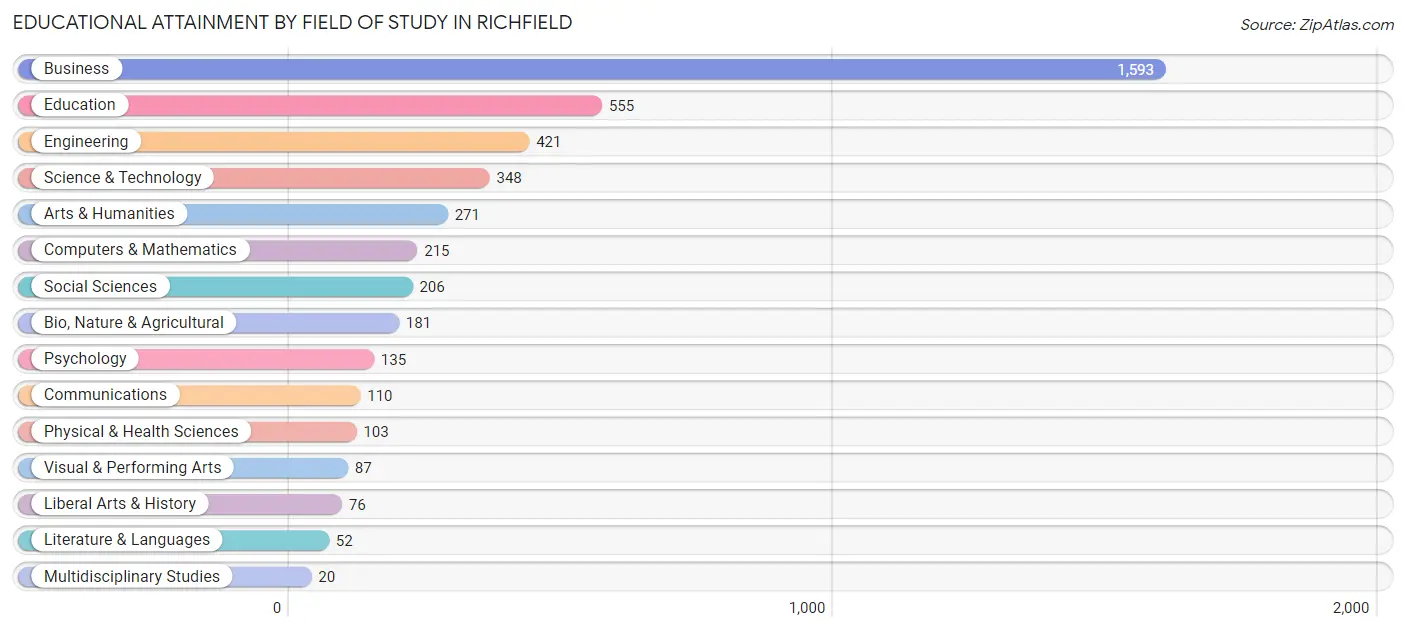
Educational Attainment by Field of Study in Richfield
Business (1,593 | 36.4%), education (555 | 12.7%), engineering (421 | 9.6%), science & technology (348 | 8.0%), and arts & humanities (271 | 6.2%) are the most common fields of study among 4,373 individuals in Richfield who have obtained a bachelor's degree or higher.
| Field of Study | # Graduates | % Graduates |
| Computers & Mathematics | 215 | 4.9% |
| Bio, Nature & Agricultural | 181 | 4.1% |
| Physical & Health Sciences | 103 | 2.4% |
| Psychology | 135 | 3.1% |
| Social Sciences | 206 | 4.7% |
| Engineering | 421 | 9.6% |
| Multidisciplinary Studies | 20 | 0.5% |
| Science & Technology | 348 | 8.0% |
| Business | 1,593 | 36.4% |
| Education | 555 | 12.7% |
| Literature & Languages | 52 | 1.2% |
| Liberal Arts & History | 76 | 1.7% |
| Visual & Performing Arts | 87 | 2.0% |
| Communications | 110 | 2.5% |
| Arts & Humanities | 271 | 6.2% |
| Total | 4,373 | 100.0% |
Transportation & Commute in Richfield
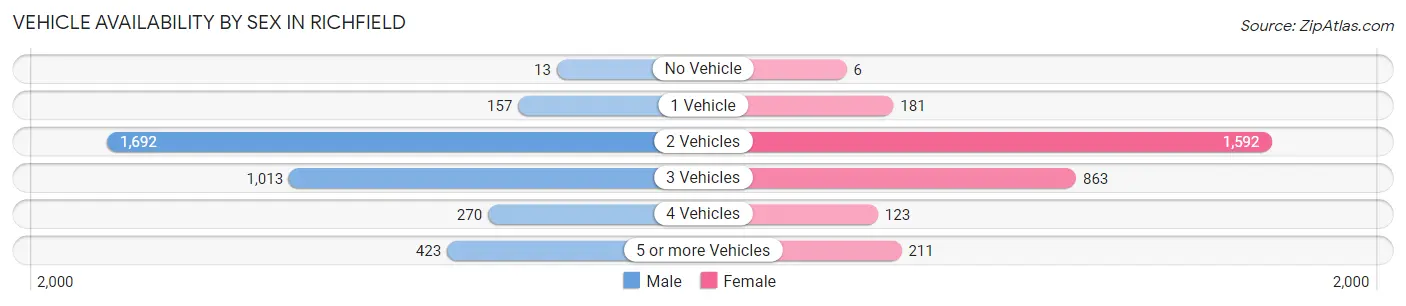
Vehicle Availability by Sex in Richfield
The most prevalent vehicle ownership categories in Richfield are males with 2 vehicles (1,692, accounting for 47.4%) and females with 2 vehicles (1,592, making up 56.9%).
| Vehicles Available | Male | Female |
| No Vehicle | 13 (0.4%) | 6 (0.2%) |
| 1 Vehicle | 157 (4.4%) | 181 (6.1%) |
| 2 Vehicles | 1,692 (47.4%) | 1,592 (53.5%) |
| 3 Vehicles | 1,013 (28.4%) | 863 (29.0%) |
| 4 Vehicles | 270 (7.6%) | 123 (4.1%) |
| 5 or more Vehicles | 423 (11.9%) | 211 (7.1%) |
| Total | 3,568 (100.0%) | 2,976 (100.0%) |
Commute Time in Richfield
The most frequently occuring commute durations in Richfield are 30 to 34 minutes (1,199 commuters, 23.2%), 20 to 24 minutes (746 commuters, 14.4%), and 15 to 19 minutes (732 commuters, 14.1%).
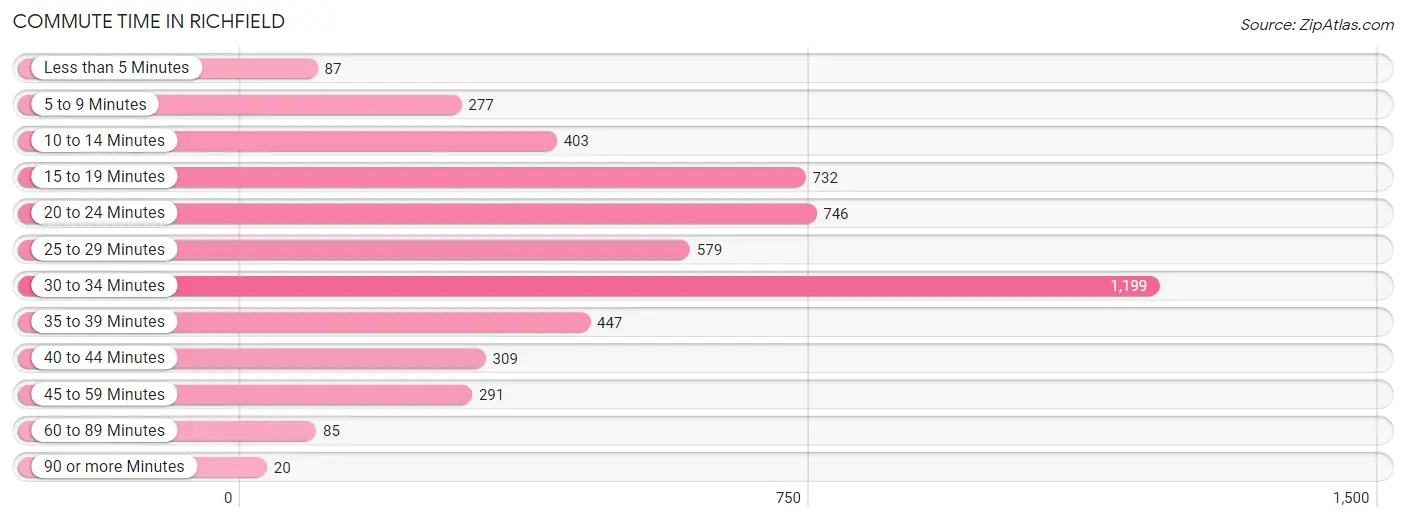
| Commute Time | # Commuters | % Commuters |
| Less than 5 Minutes | 87 | 1.7% |
| 5 to 9 Minutes | 277 | 5.3% |
| 10 to 14 Minutes | 403 | 7.8% |
| 15 to 19 Minutes | 732 | 14.1% |
| 20 to 24 Minutes | 746 | 14.4% |
| 25 to 29 Minutes | 579 | 11.2% |
| 30 to 34 Minutes | 1,199 | 23.2% |
| 35 to 39 Minutes | 447 | 8.6% |
| 40 to 44 Minutes | 309 | 6.0% |
| 45 to 59 Minutes | 291 | 5.6% |
| 60 to 89 Minutes | 85 | 1.6% |
| 90 or more Minutes | 20 | 0.4% |
Commute Time by Sex in Richfield
The most common commute times in Richfield are 30 to 34 minutes (569 commuters, 20.6%) for males and 30 to 34 minutes (630 commuters, 26.2%) for females.
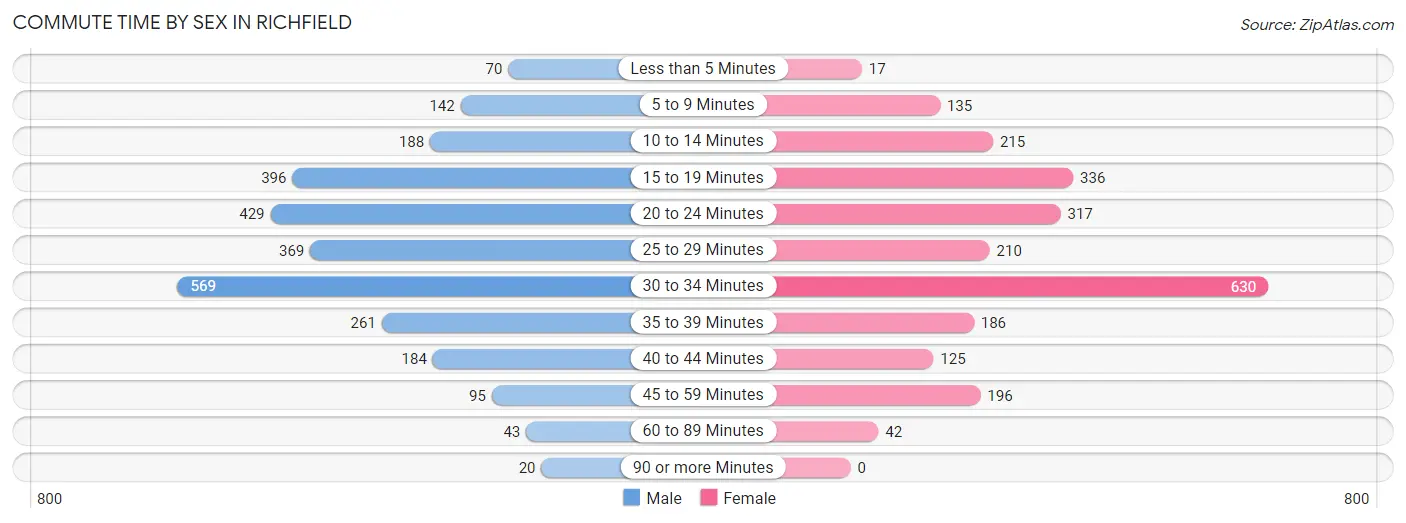
| Commute Time | Male | Female |
| Less than 5 Minutes | 70 (2.5%) | 17 (0.7%) |
| 5 to 9 Minutes | 142 (5.1%) | 135 (5.6%) |
| 10 to 14 Minutes | 188 (6.8%) | 215 (8.9%) |
| 15 to 19 Minutes | 396 (14.3%) | 336 (14.0%) |
| 20 to 24 Minutes | 429 (15.5%) | 317 (13.2%) |
| 25 to 29 Minutes | 369 (13.3%) | 210 (8.7%) |
| 30 to 34 Minutes | 569 (20.6%) | 630 (26.2%) |
| 35 to 39 Minutes | 261 (9.4%) | 186 (7.7%) |
| 40 to 44 Minutes | 184 (6.7%) | 125 (5.2%) |
| 45 to 59 Minutes | 95 (3.4%) | 196 (8.1%) |
| 60 to 89 Minutes | 43 (1.5%) | 42 (1.7%) |
| 90 or more Minutes | 20 (0.7%) | 0 (0.0%) |
Time of Departure to Work by Sex in Richfield
The most frequent times of departure to work in Richfield are 6:30 AM to 6:59 AM (507, 18.3%) for males and 7:00 AM to 7:29 AM (451, 18.7%) for females.
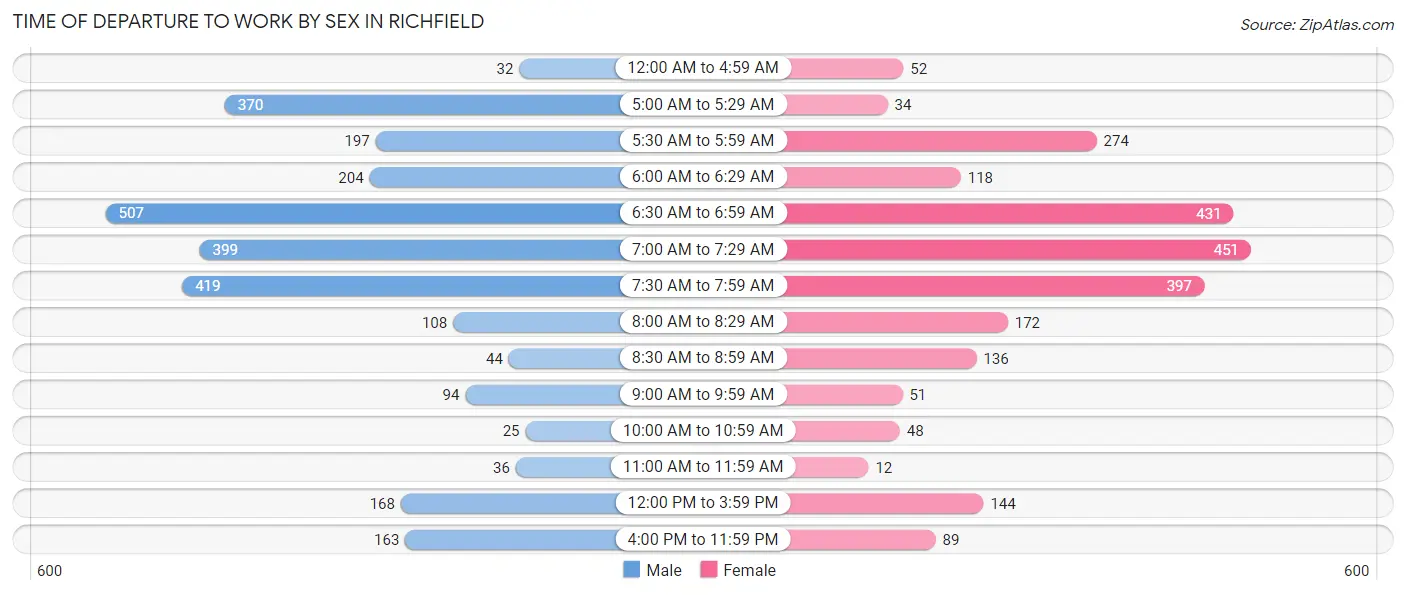
| Time of Departure | Male | Female |
| 12:00 AM to 4:59 AM | 32 (1.2%) | 52 (2.2%) |
| 5:00 AM to 5:29 AM | 370 (13.4%) | 34 (1.4%) |
| 5:30 AM to 5:59 AM | 197 (7.1%) | 274 (11.4%) |
| 6:00 AM to 6:29 AM | 204 (7.4%) | 118 (4.9%) |
| 6:30 AM to 6:59 AM | 507 (18.3%) | 431 (17.9%) |
| 7:00 AM to 7:29 AM | 399 (14.4%) | 451 (18.7%) |
| 7:30 AM to 7:59 AM | 419 (15.1%) | 397 (16.5%) |
| 8:00 AM to 8:29 AM | 108 (3.9%) | 172 (7.1%) |
| 8:30 AM to 8:59 AM | 44 (1.6%) | 136 (5.7%) |
| 9:00 AM to 9:59 AM | 94 (3.4%) | 51 (2.1%) |
| 10:00 AM to 10:59 AM | 25 (0.9%) | 48 (2.0%) |
| 11:00 AM to 11:59 AM | 36 (1.3%) | 12 (0.5%) |
| 12:00 PM to 3:59 PM | 168 (6.1%) | 144 (6.0%) |
| 4:00 PM to 11:59 PM | 163 (5.9%) | 89 (3.7%) |
| Total | 2,766 (100.0%) | 2,409 (100.0%) |
Housing Occupancy in Richfield
Occupancy by Ownership in Richfield
Of the total 4,479 dwellings in Richfield, owner-occupied units account for 4,362 (97.4%), while renter-occupied units make up 117 (2.6%).
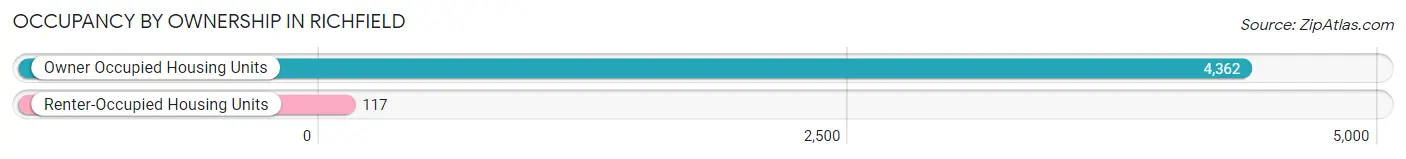
| Occupancy | # Housing Units | % Housing Units |
| Owner Occupied Housing Units | 4,362 | 97.4% |
| Renter-Occupied Housing Units | 117 | 2.6% |
| Total Occupied Housing Units | 4,479 | 100.0% |
Occupancy by Household Size in Richfield
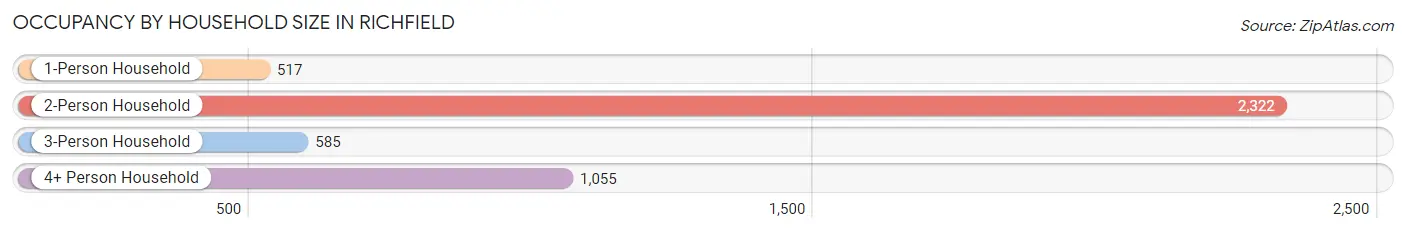
| Household Size | # Housing Units | % Housing Units |
| 1-Person Household | 517 | 11.5% |
| 2-Person Household | 2,322 | 51.8% |
| 3-Person Household | 585 | 13.1% |
| 4+ Person Household | 1,055 | 23.5% |
| Total Housing Units | 4,479 | 100.0% |
Occupancy by Ownership by Household Size in Richfield
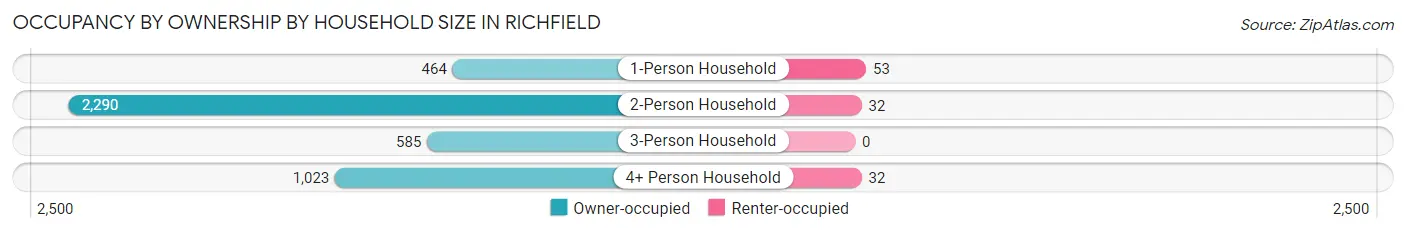
| Household Size | Owner-occupied | Renter-occupied |
| 1-Person Household | 464 (89.7%) | 53 (10.2%) |
| 2-Person Household | 2,290 (98.6%) | 32 (1.4%) |
| 3-Person Household | 585 (100.0%) | 0 (0.0%) |
| 4+ Person Household | 1,023 (97.0%) | 32 (3.0%) |
| Total Housing Units | 4,362 (97.4%) | 117 (2.6%) |
Occupancy by Educational Attainment in Richfield
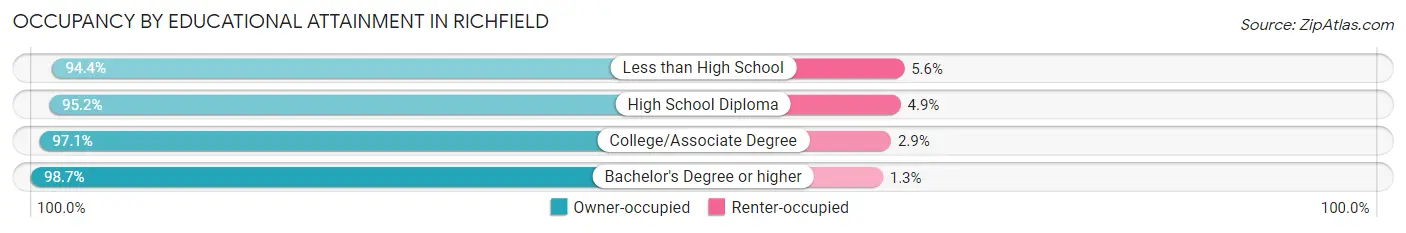
| Household Size | Owner-occupied | Renter-occupied |
| Less than High School | 68 (94.4%) | 4 (5.6%) |
| High School Diploma | 961 (95.2%) | 49 (4.9%) |
| College/Associate Degree | 1,155 (97.1%) | 35 (2.9%) |
| Bachelor's Degree or higher | 2,178 (98.7%) | 29 (1.3%) |
Occupancy by Age of Householder in Richfield
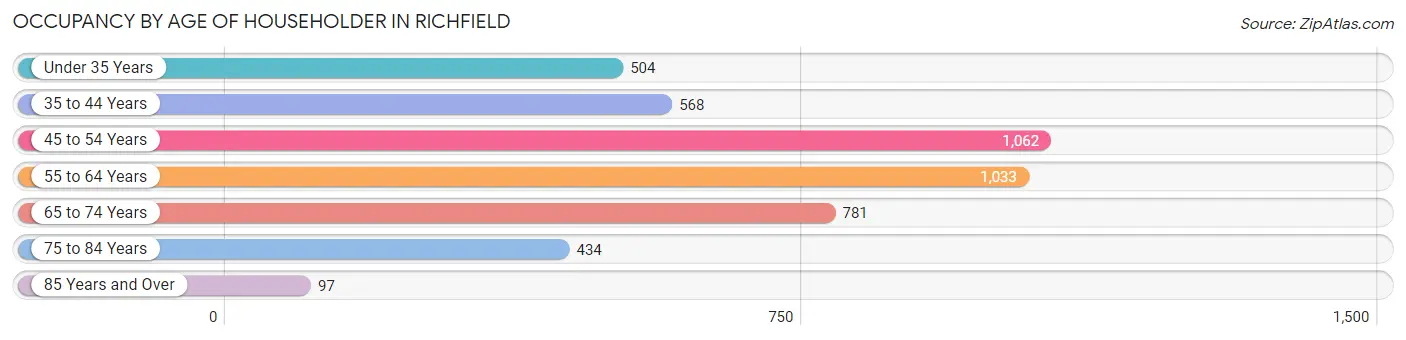
| Age Bracket | # Households | % Households |
| Under 35 Years | 504 | 11.3% |
| 35 to 44 Years | 568 | 12.7% |
| 45 to 54 Years | 1,062 | 23.7% |
| 55 to 64 Years | 1,033 | 23.1% |
| 65 to 74 Years | 781 | 17.4% |
| 75 to 84 Years | 434 | 9.7% |
| 85 Years and Over | 97 | 2.2% |
| Total | 4,479 | 100.0% |
Housing Finances in Richfield
Median Income by Occupancy in Richfield
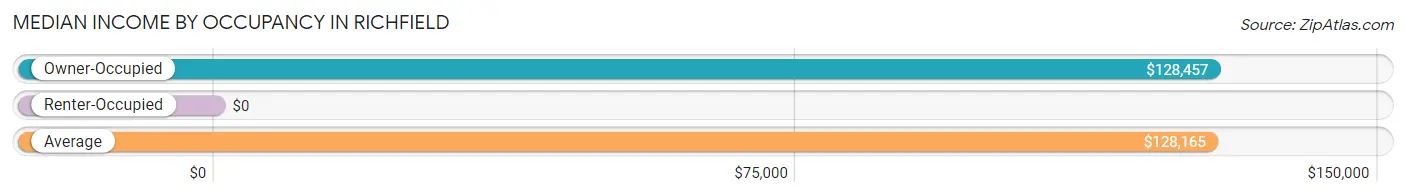
| Occupancy Type | # Households | Median Income |
| Owner-Occupied | 4,362 (97.4%) | $128,457 |
| Renter-Occupied | 117 (2.6%) | $0 |
| Average | 4,479 (100.0%) | $128,165 |
Occupancy by Householder Income Bracket in Richfield
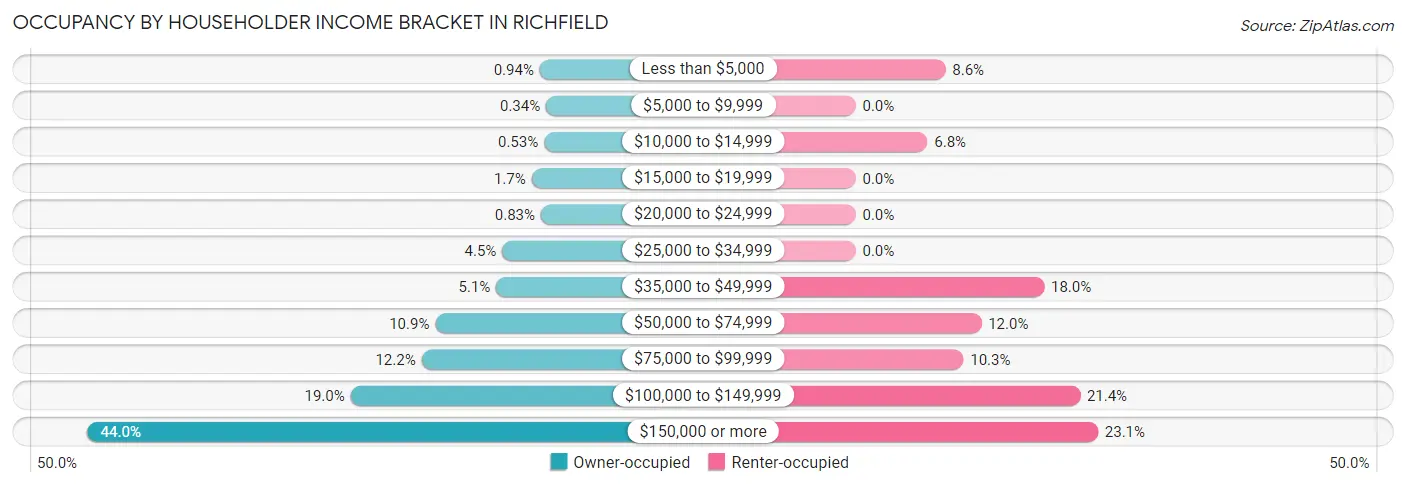
| Income Bracket | Owner-occupied | Renter-occupied |
| Less than $5,000 | 41 (0.9%) | 10 (8.6%) |
| $5,000 to $9,999 | 15 (0.3%) | 0 (0.0%) |
| $10,000 to $14,999 | 23 (0.5%) | 8 (6.8%) |
| $15,000 to $19,999 | 75 (1.7%) | 0 (0.0%) |
| $20,000 to $24,999 | 36 (0.8%) | 0 (0.0%) |
| $25,000 to $34,999 | 197 (4.5%) | 0 (0.0%) |
| $35,000 to $49,999 | 222 (5.1%) | 21 (17.9%) |
| $50,000 to $74,999 | 475 (10.9%) | 14 (12.0%) |
| $75,000 to $99,999 | 532 (12.2%) | 12 (10.3%) |
| $100,000 to $149,999 | 827 (19.0%) | 25 (21.4%) |
| $150,000 or more | 1,919 (44.0%) | 27 (23.1%) |
| Total | 4,362 (100.0%) | 117 (100.0%) |
Monthly Housing Cost Tiers in Richfield
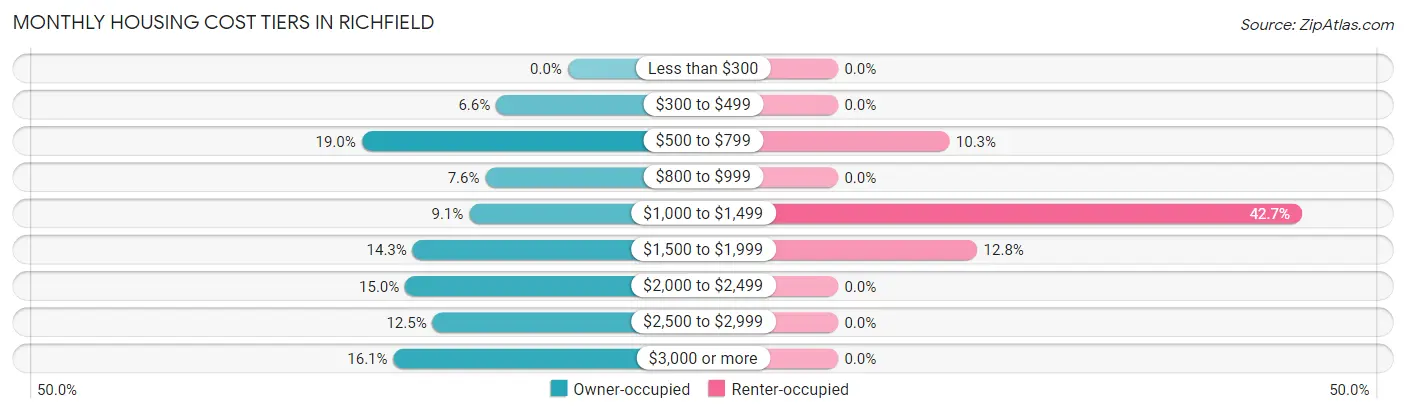
| Monthly Cost | Owner-occupied | Renter-occupied |
| Less than $300 | 0 (0.0%) | 0 (0.0%) |
| $300 to $499 | 288 (6.6%) | 0 (0.0%) |
| $500 to $799 | 828 (19.0%) | 12 (10.3%) |
| $800 to $999 | 331 (7.6%) | 0 (0.0%) |
| $1,000 to $1,499 | 396 (9.1%) | 50 (42.7%) |
| $1,500 to $1,999 | 623 (14.3%) | 15 (12.8%) |
| $2,000 to $2,499 | 653 (15.0%) | 0 (0.0%) |
| $2,500 to $2,999 | 543 (12.4%) | 0 (0.0%) |
| $3,000 or more | 700 (16.1%) | 0 (0.0%) |
| Total | 4,362 (100.0%) | 117 (100.0%) |
Physical Housing Characteristics in Richfield
Housing Structures in Richfield
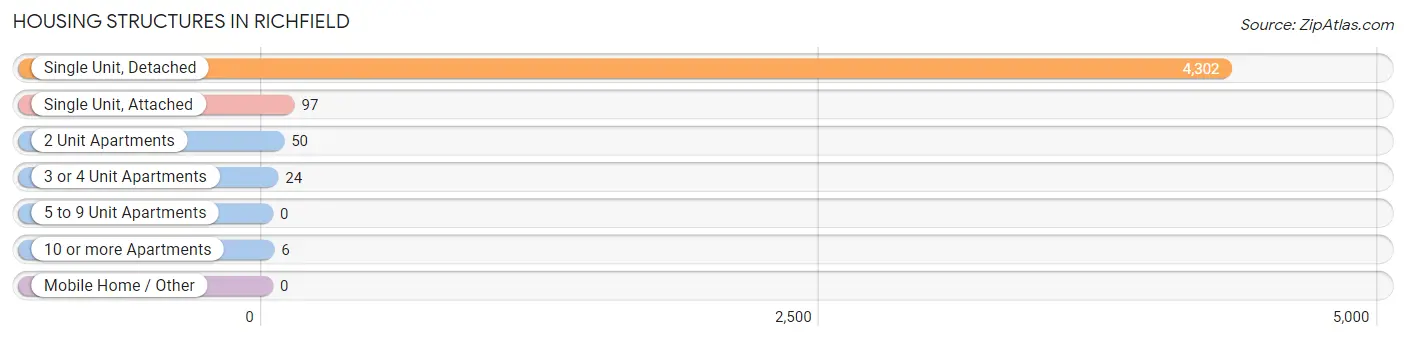
| Structure Type | # Housing Units | % Housing Units |
| Single Unit, Detached | 4,302 | 96.1% |
| Single Unit, Attached | 97 | 2.2% |
| 2 Unit Apartments | 50 | 1.1% |
| 3 or 4 Unit Apartments | 24 | 0.5% |
| 5 to 9 Unit Apartments | 0 | 0.0% |
| 10 or more Apartments | 6 | 0.1% |
| Mobile Home / Other | 0 | 0.0% |
| Total | 4,479 | 100.0% |
Housing Structures by Occupancy in Richfield
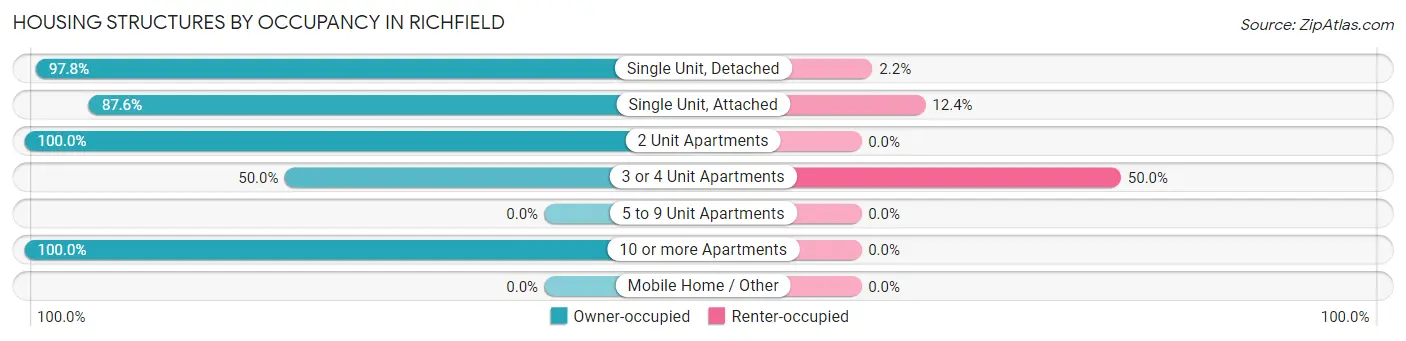
| Structure Type | Owner-occupied | Renter-occupied |
| Single Unit, Detached | 4,209 (97.8%) | 93 (2.2%) |
| Single Unit, Attached | 85 (87.6%) | 12 (12.4%) |
| 2 Unit Apartments | 50 (100.0%) | 0 (0.0%) |
| 3 or 4 Unit Apartments | 12 (50.0%) | 12 (50.0%) |
| 5 to 9 Unit Apartments | 0 (0.0%) | 0 (0.0%) |
| 10 or more Apartments | 6 (100.0%) | 0 (0.0%) |
| Mobile Home / Other | 0 (0.0%) | 0 (0.0%) |
| Total | 4,362 (97.4%) | 117 (2.6%) |
Housing Structures by Number of Rooms in Richfield
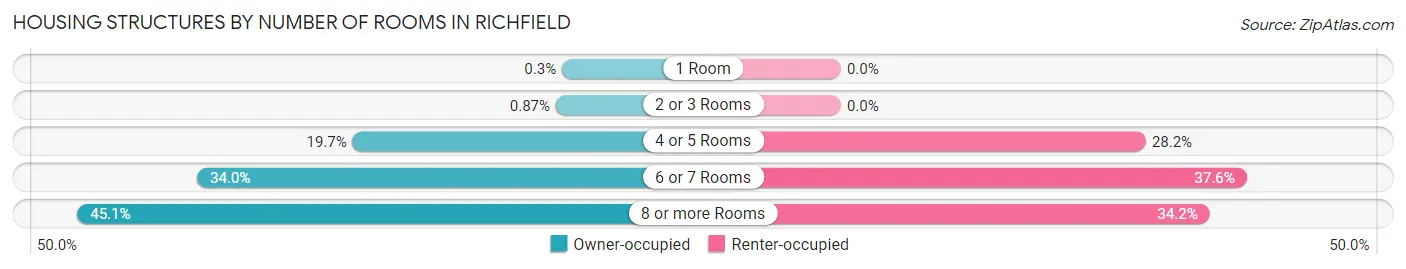
| Number of Rooms | Owner-occupied | Renter-occupied |
| 1 Room | 13 (0.3%) | 0 (0.0%) |
| 2 or 3 Rooms | 38 (0.9%) | 0 (0.0%) |
| 4 or 5 Rooms | 858 (19.7%) | 33 (28.2%) |
| 6 or 7 Rooms | 1,485 (34.0%) | 44 (37.6%) |
| 8 or more Rooms | 1,968 (45.1%) | 40 (34.2%) |
| Total | 4,362 (100.0%) | 117 (100.0%) |
Housing Structure by Heating Type in Richfield
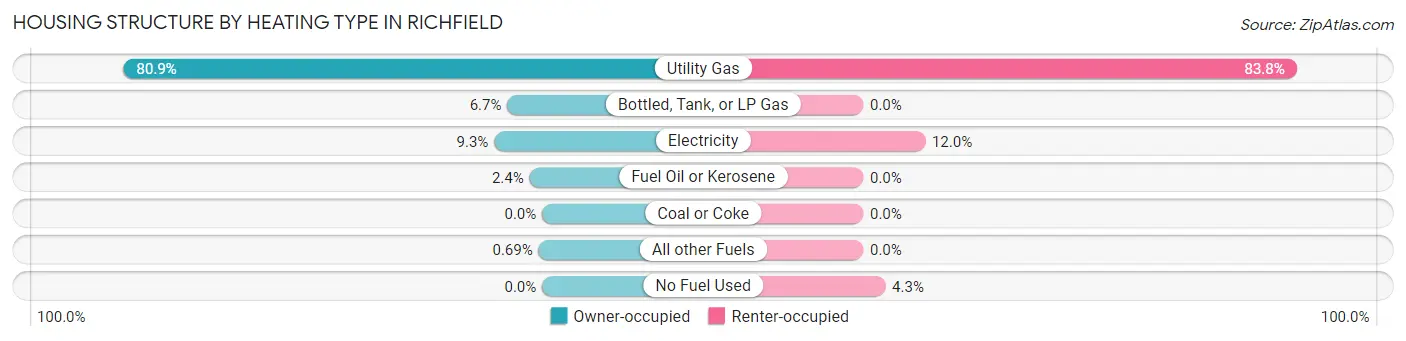
| Heating Type | Owner-occupied | Renter-occupied |
| Utility Gas | 3,529 (80.9%) | 98 (83.8%) |
| Bottled, Tank, or LP Gas | 293 (6.7%) | 0 (0.0%) |
| Electricity | 404 (9.3%) | 14 (12.0%) |
| Fuel Oil or Kerosene | 106 (2.4%) | 0 (0.0%) |
| Coal or Coke | 0 (0.0%) | 0 (0.0%) |
| All other Fuels | 30 (0.7%) | 0 (0.0%) |
| No Fuel Used | 0 (0.0%) | 5 (4.3%) |
| Total | 4,362 (100.0%) | 117 (100.0%) |
Household Vehicle Usage in Richfield
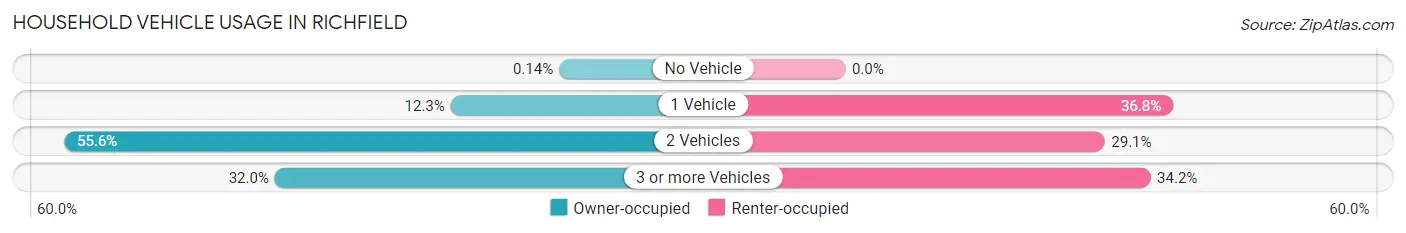
| Vehicles per Household | Owner-occupied | Renter-occupied |
| No Vehicle | 6 (0.1%) | 0 (0.0%) |
| 1 Vehicle | 536 (12.3%) | 43 (36.7%) |
| 2 Vehicles | 2,425 (55.6%) | 34 (29.1%) |
| 3 or more Vehicles | 1,395 (32.0%) | 40 (34.2%) |
| Total | 4,362 (100.0%) | 117 (100.0%) |
Real Estate & Mortgages in Richfield
Real Estate and Mortgage Overview in Richfield
| Characteristic | Without Mortgage | With Mortgage |
| Housing Units | 1,517 | 2,845 |
| Median Property Value | $335,800 | $437,900 |
| Median Household Income | $82,179 | $1,653 |
| Monthly Housing Costs | $698 | $688 |
| Real Estate Taxes | $4,095 | $0 |
Property Value by Mortgage Status in Richfield
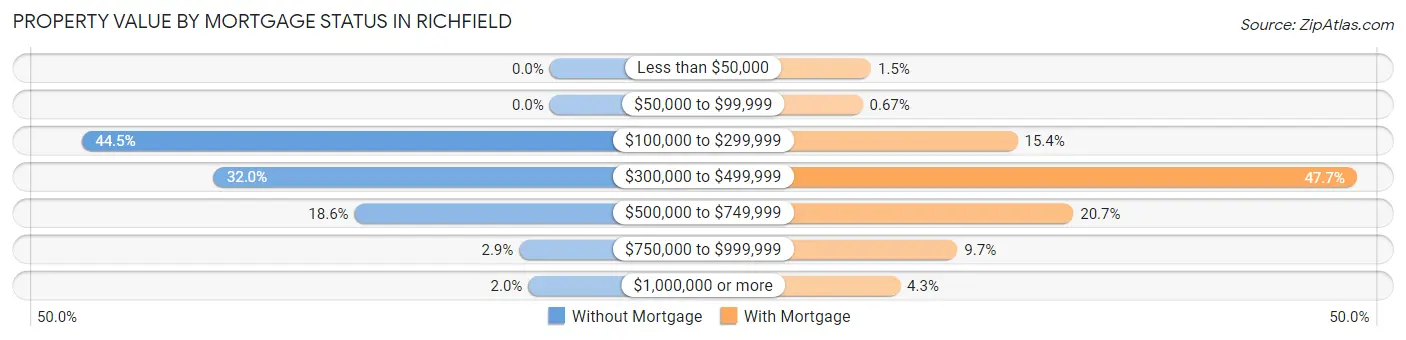
| Property Value | Without Mortgage | With Mortgage |
| Less than $50,000 | 0 (0.0%) | 42 (1.5%) |
| $50,000 to $99,999 | 0 (0.0%) | 19 (0.7%) |
| $100,000 to $299,999 | 675 (44.5%) | 439 (15.4%) |
| $300,000 to $499,999 | 485 (32.0%) | 1,358 (47.7%) |
| $500,000 to $749,999 | 282 (18.6%) | 590 (20.7%) |
| $750,000 to $999,999 | 44 (2.9%) | 276 (9.7%) |
| $1,000,000 or more | 31 (2.0%) | 121 (4.3%) |
| Total | 1,517 (100.0%) | 2,845 (100.0%) |
Household Income by Mortgage Status in Richfield
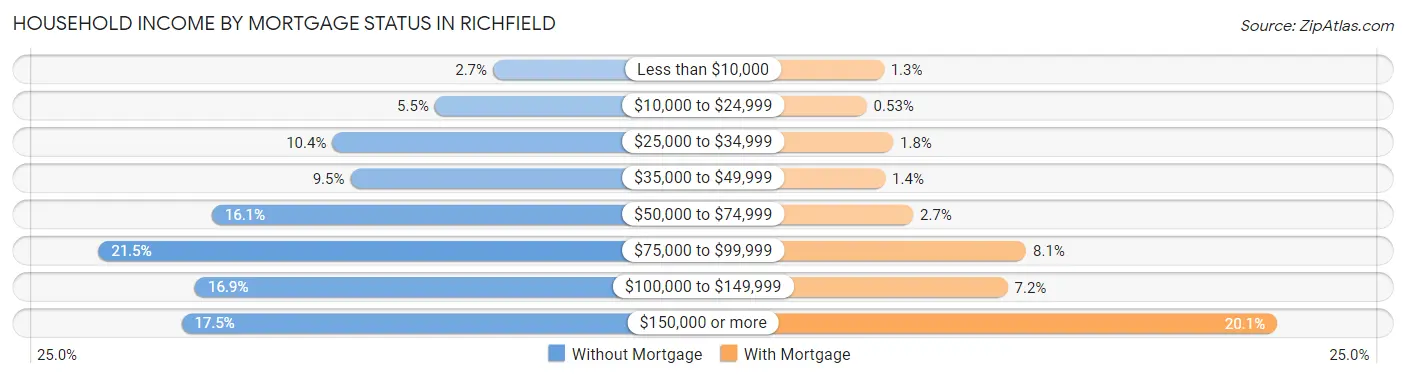
| Household Income | Without Mortgage | With Mortgage |
| Less than $10,000 | 41 (2.7%) | 38 (1.3%) |
| $10,000 to $24,999 | 83 (5.5%) | 15 (0.5%) |
| $25,000 to $34,999 | 157 (10.3%) | 51 (1.8%) |
| $35,000 to $49,999 | 144 (9.5%) | 40 (1.4%) |
| $50,000 to $74,999 | 244 (16.1%) | 78 (2.7%) |
| $75,000 to $99,999 | 326 (21.5%) | 231 (8.1%) |
| $100,000 to $149,999 | 256 (16.9%) | 206 (7.2%) |
| $150,000 or more | 266 (17.5%) | 571 (20.1%) |
| Total | 1,517 (100.0%) | 2,845 (100.0%) |
Property Value to Household Income Ratio in Richfield
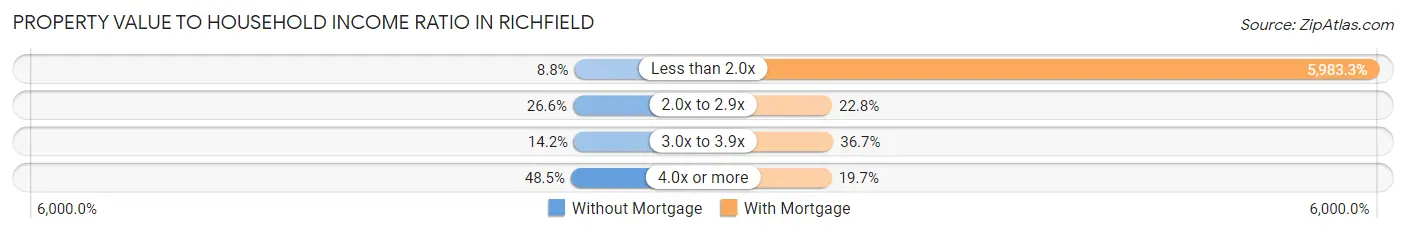
| Value-to-Income Ratio | Without Mortgage | With Mortgage |
| Less than 2.0x | 134 (8.8%) | 170,225 (5,983.3%) |
| 2.0x to 2.9x | 403 (26.6%) | 648 (22.8%) |
| 3.0x to 3.9x | 215 (14.2%) | 1,044 (36.7%) |
| 4.0x or more | 735 (48.4%) | 561 (19.7%) |
| Total | 1,517 (100.0%) | 2,845 (100.0%) |
Real Estate Taxes by Mortgage Status in Richfield
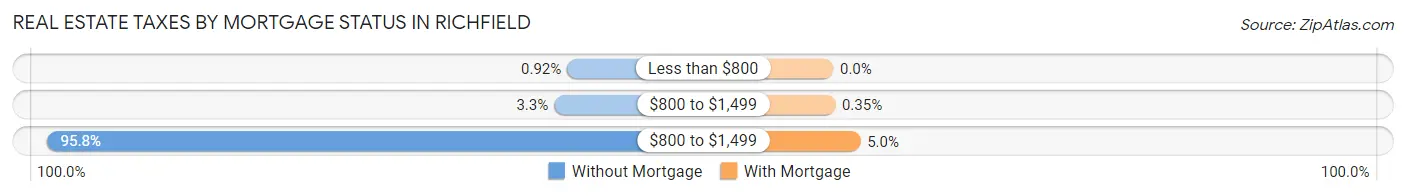
| Property Taxes | Without Mortgage | With Mortgage |
| Less than $800 | 14 (0.9%) | 0 (0.0%) |
| $800 to $1,499 | 50 (3.3%) | 10 (0.4%) |
| $800 to $1,499 | 1,453 (95.8%) | 141 (5.0%) |
| Total | 1,517 (100.0%) | 2,845 (100.0%) |
Health & Disability in Richfield
Health Insurance Coverage by Age in Richfield
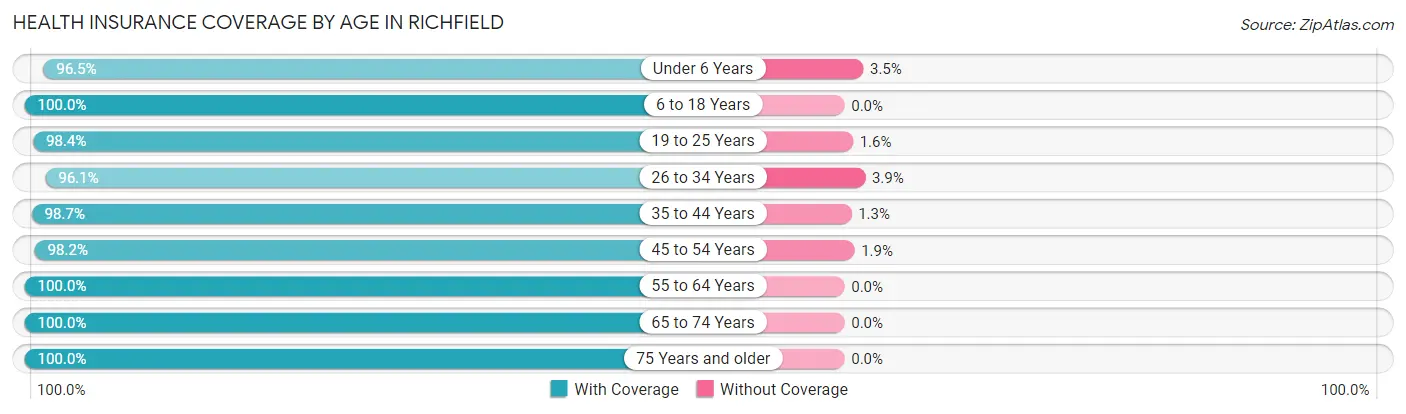
| Age Bracket | With Coverage | Without Coverage |
| Under 6 Years | 690 (96.5%) | 25 (3.5%) |
| 6 to 18 Years | 1,822 (100.0%) | 0 (0.0%) |
| 19 to 25 Years | 753 (98.4%) | 12 (1.6%) |
| 26 to 34 Years | 995 (96.1%) | 40 (3.9%) |
| 35 to 44 Years | 1,145 (98.7%) | 15 (1.3%) |
| 45 to 54 Years | 1,808 (98.2%) | 34 (1.8%) |
| 55 to 64 Years | 2,122 (100.0%) | 0 (0.0%) |
| 65 to 74 Years | 1,401 (100.0%) | 0 (0.0%) |
| 75 Years and older | 895 (100.0%) | 0 (0.0%) |
| Total | 11,631 (98.9%) | 126 (1.1%) |
Health Insurance Coverage by Citizenship Status in Richfield

| Citizenship Status | With Coverage | Without Coverage |
| Native Born | 690 (96.5%) | 25 (3.5%) |
| Foreign Born, Citizen | 1,822 (100.0%) | 0 (0.0%) |
| Foreign Born, not a Citizen | 753 (98.4%) | 12 (1.6%) |
Health Insurance Coverage by Household Income in Richfield
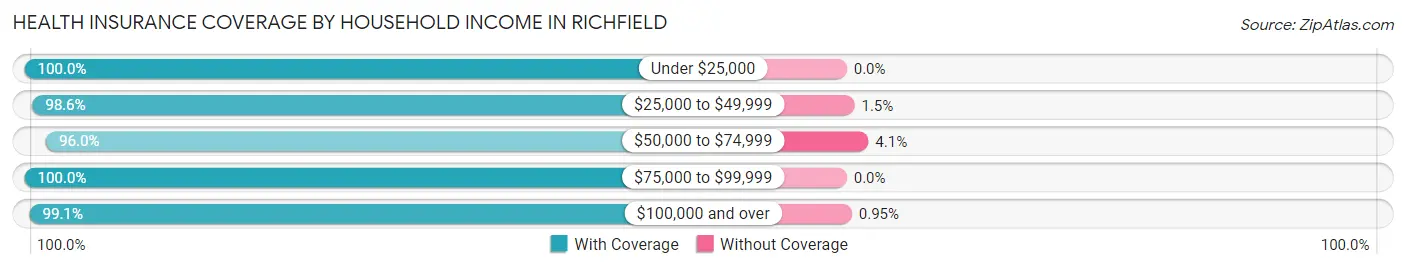
| Household Income | With Coverage | Without Coverage |
| Under $25,000 | 357 (100.0%) | 0 (0.0%) |
| $25,000 to $49,999 | 680 (98.6%) | 10 (1.5%) |
| $50,000 to $74,999 | 829 (96.0%) | 35 (4.1%) |
| $75,000 to $99,999 | 1,331 (100.0%) | 0 (0.0%) |
| $100,000 and over | 8,433 (99.1%) | 81 (0.9%) |
Public vs Private Health Insurance Coverage by Age in Richfield
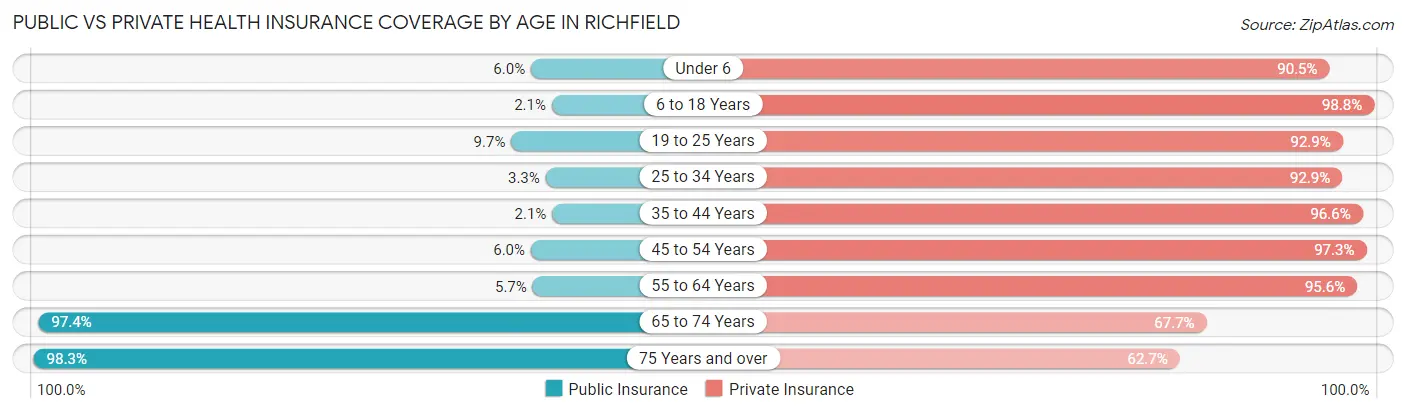
| Age Bracket | Public Insurance | Private Insurance |
| Under 6 | 43 (6.0%) | 647 (90.5%) |
| 6 to 18 Years | 39 (2.1%) | 1,800 (98.8%) |
| 19 to 25 Years | 74 (9.7%) | 711 (92.9%) |
| 25 to 34 Years | 34 (3.3%) | 961 (92.8%) |
| 35 to 44 Years | 24 (2.1%) | 1,121 (96.6%) |
| 45 to 54 Years | 111 (6.0%) | 1,793 (97.3%) |
| 55 to 64 Years | 121 (5.7%) | 2,029 (95.6%) |
| 65 to 74 Years | 1,365 (97.4%) | 948 (67.7%) |
| 75 Years and over | 880 (98.3%) | 561 (62.7%) |
| Total | 2,691 (22.9%) | 10,571 (89.9%) |
Disability Status by Sex by Age in Richfield
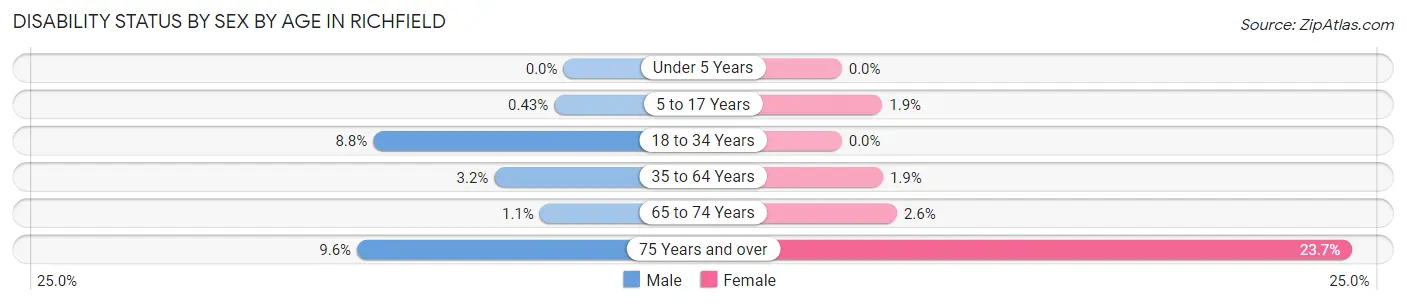
| Age Bracket | Male | Female |
| Under 5 Years | 0 (0.0%) | 0 (0.0%) |
| 5 to 17 Years | 4 (0.4%) | 21 (1.9%) |
| 18 to 34 Years | 101 (8.8%) | 0 (0.0%) |
| 35 to 64 Years | 82 (3.2%) | 49 (1.9%) |
| 65 to 74 Years | 6 (1.1%) | 22 (2.6%) |
| 75 Years and over | 55 (9.6%) | 76 (23.7%) |
Disability Class by Sex by Age in Richfield
Disability Class: Hearing Difficulty
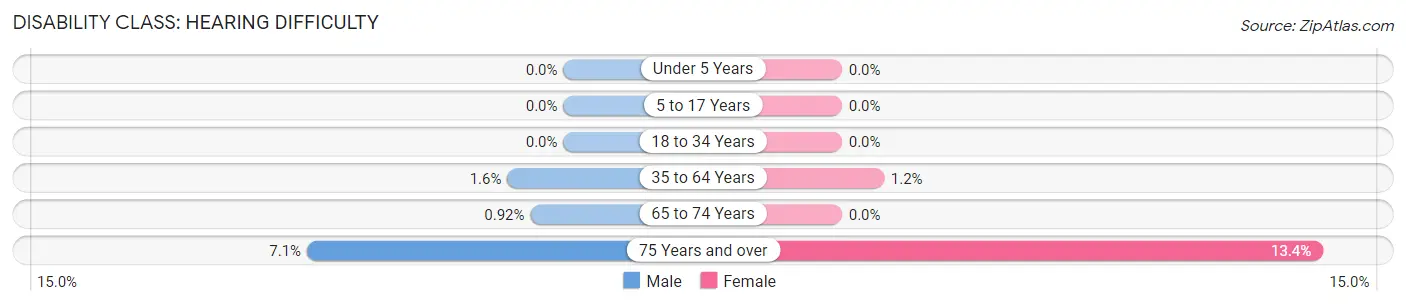
| Age Bracket | Male | Female |
| Under 5 Years | 0 (0.0%) | 0 (0.0%) |
| 5 to 17 Years | 0 (0.0%) | 0 (0.0%) |
| 18 to 34 Years | 0 (0.0%) | 0 (0.0%) |
| 35 to 64 Years | 40 (1.6%) | 30 (1.2%) |
| 65 to 74 Years | 5 (0.9%) | 0 (0.0%) |
| 75 Years and over | 41 (7.1%) | 43 (13.4%) |
Disability Class: Vision Difficulty
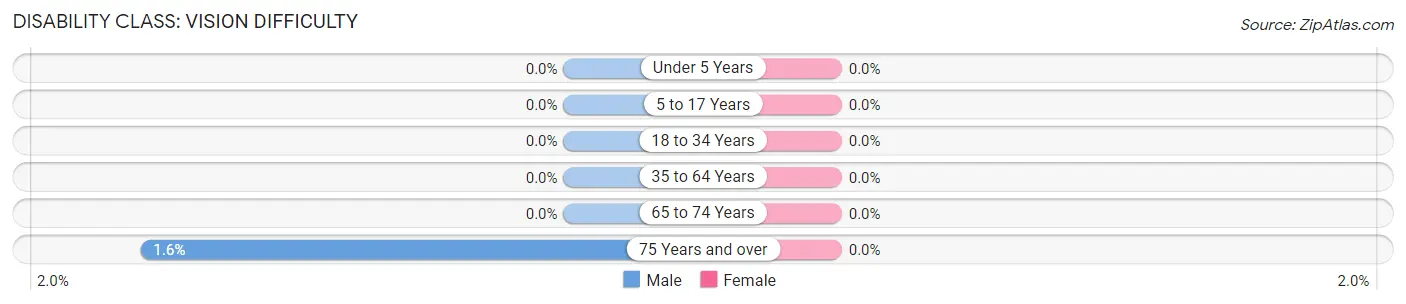
| Age Bracket | Male | Female |
| Under 5 Years | 0 (0.0%) | 0 (0.0%) |
| 5 to 17 Years | 0 (0.0%) | 0 (0.0%) |
| 18 to 34 Years | 0 (0.0%) | 0 (0.0%) |
| 35 to 64 Years | 0 (0.0%) | 0 (0.0%) |
| 65 to 74 Years | 0 (0.0%) | 0 (0.0%) |
| 75 Years and over | 9 (1.6%) | 0 (0.0%) |
Disability Class: Cognitive Difficulty
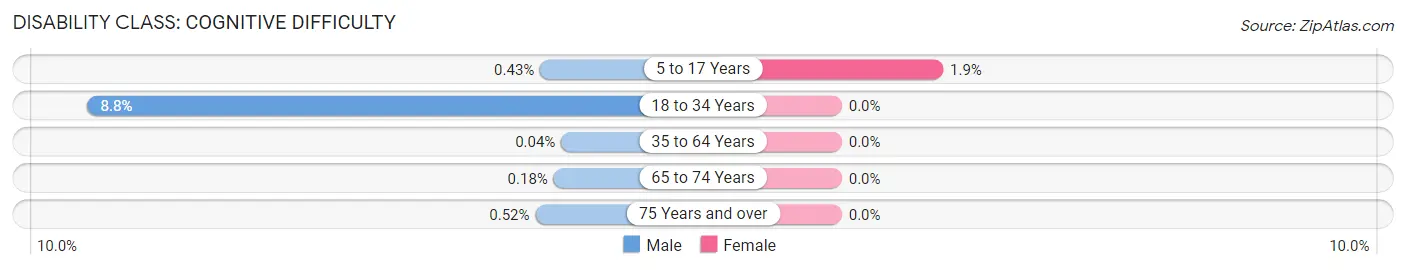
| Age Bracket | Male | Female |
| 5 to 17 Years | 4 (0.4%) | 21 (1.9%) |
| 18 to 34 Years | 101 (8.8%) | 0 (0.0%) |
| 35 to 64 Years | 1 (0.0%) | 0 (0.0%) |
| 65 to 74 Years | 1 (0.2%) | 0 (0.0%) |
| 75 Years and over | 3 (0.5%) | 0 (0.0%) |
Disability Class: Ambulatory Difficulty
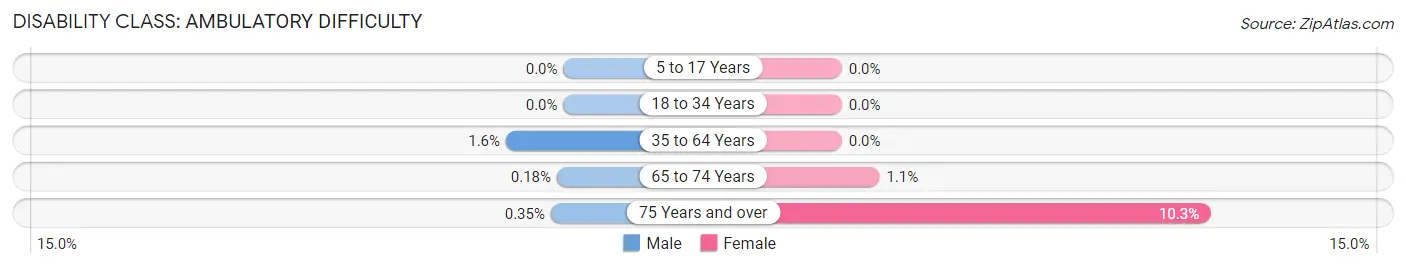
| Age Bracket | Male | Female |
| 5 to 17 Years | 0 (0.0%) | 0 (0.0%) |
| 18 to 34 Years | 0 (0.0%) | 0 (0.0%) |
| 35 to 64 Years | 41 (1.6%) | 0 (0.0%) |
| 65 to 74 Years | 1 (0.2%) | 9 (1.1%) |
| 75 Years and over | 2 (0.4%) | 33 (10.3%) |
Disability Class: Self-Care Difficulty
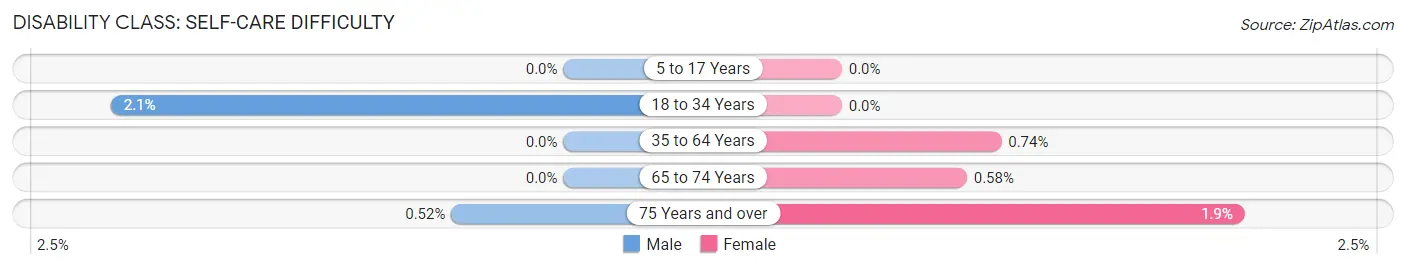
| Age Bracket | Male | Female |
| 5 to 17 Years | 0 (0.0%) | 0 (0.0%) |
| 18 to 34 Years | 24 (2.1%) | 0 (0.0%) |
| 35 to 64 Years | 0 (0.0%) | 19 (0.7%) |
| 65 to 74 Years | 0 (0.0%) | 5 (0.6%) |
| 75 Years and over | 3 (0.5%) | 6 (1.9%) |
Technology Access in Richfield
Computing Device Access in Richfield
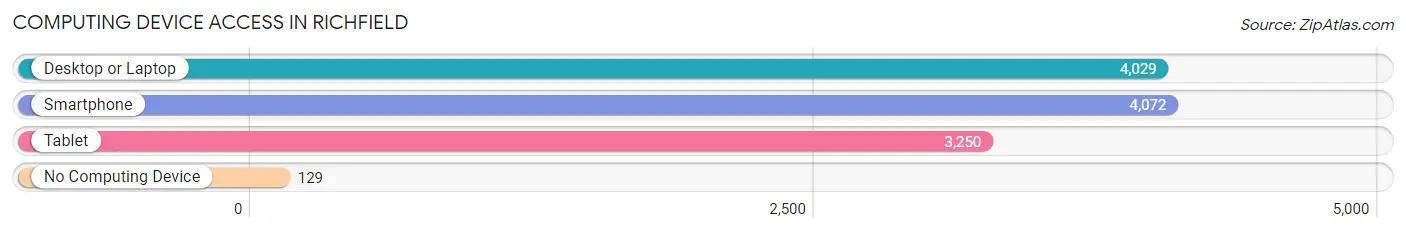
| Device Type | # Households | % Households |
| Desktop or Laptop | 4,029 | 89.9% |
| Smartphone | 4,072 | 90.9% |
| Tablet | 3,250 | 72.6% |
| No Computing Device | 129 | 2.9% |
| Total | 4,479 | 100.0% |
Internet Access in Richfield
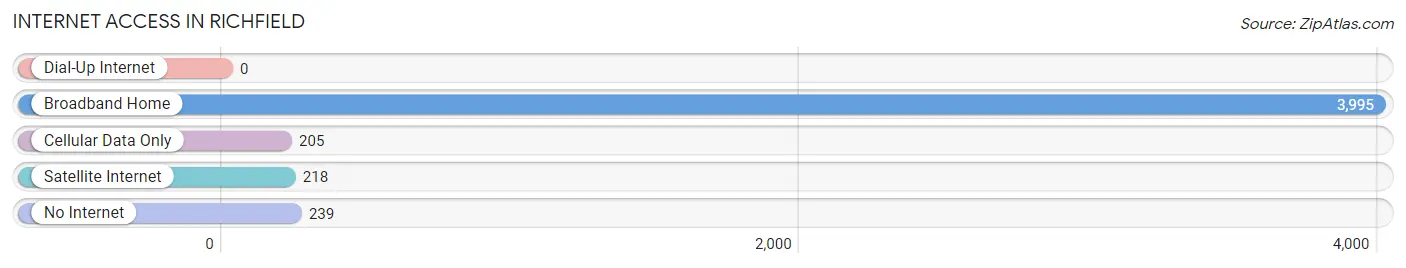
| Internet Type | # Households | % Households |
| Dial-Up Internet | 0 | 0.0% |
| Broadband Home | 3,995 | 89.2% |
| Cellular Data Only | 205 | 4.6% |
| Satellite Internet | 218 | 4.9% |
| No Internet | 239 | 5.3% |
| Total | 4,479 | 100.0% |
Richfield Summary
Richfield, Wisconsin is a small village located in Washington County, Wisconsin. It is situated on the banks of the Milwaukee River, about 20 miles northwest of Milwaukee. The village has a population of approximately 1,500 people and covers an area of 1.2 square miles.
History
Richfield was first settled in 1845 by a group of German immigrants. The village was originally known as “New Berlin” and was later renamed Richfield in 1856. The name was chosen to reflect the rich soil in the area. The village was officially incorporated in 1872.
In the late 19th century, Richfield was a thriving agricultural community. The village was home to several dairy farms, as well as a number of small businesses. The village also had a train station, which allowed for easy access to Milwaukee and other nearby cities.
In the early 20th century, Richfield began to experience a decline in population. This was due to the increasing mechanization of farming, which made it difficult for small farmers to compete. By the 1950s, the village had become a bedroom community for Milwaukee.
Geography
Richfield is located in the Kettle Moraine region of Wisconsin. The village is situated on the banks of the Milwaukee River, which flows through the village. The terrain is mostly flat, with some rolling hills in the area. The village is surrounded by a number of small lakes, including Big Cedar Lake, Little Cedar Lake, and Silver Lake.
The climate in Richfield is typical of the Midwest, with cold winters and hot summers. The average annual temperature is around 50 degrees Fahrenheit. The average annual precipitation is around 35 inches.
Economy
The economy of Richfield is largely based on agriculture and tourism. The village is home to several small farms, which produce a variety of crops, including corn, soybeans, and hay. The village also has a number of small businesses, including restaurants, shops, and a hardware store.
Tourism is an important part of the local economy. The village is home to several parks and recreational areas, including Big Cedar Lake Park and Silver Lake Park. The village also hosts a number of festivals and events throughout the year, including the Richfield Summer Festival and the Richfield Harvest Festival.
Demographics
As of the 2010 census, the population of Richfield was 1,521. The racial makeup of the village was 97.3% White, 0.7% African American, 0.3% Native American, 0.3% Asian, 0.2% from other races, and 1.2% from two or more races. Hispanic or Latino of any race were 1.2% of the population.
The median household income in Richfield was $50,938, and the median family income was $60,938. The per capita income was $25,938. About 4.3% of families and 5.3% of the population were below the poverty line, including 6.3% of those under age 18 and 4.3% of those age 65 or over.
Richfield is a small village with a rich history and a vibrant economy. The village is home to a diverse population and offers a variety of recreational activities and events. Richfield is a great place to live, work, and play.
Common Questions
What is the Total Population of Richfield?
Total Population of Richfield is 11,757.
What is the Total Male Population of Richfield?
Total Male Population of Richfield is 5,983.
What is the Total Female Population of Richfield?
Total Female Population of Richfield is 5,774.
What is the Ratio of Males per 100 Females in Richfield?
There are 103.62 Males per 100 Females in Richfield.
What is the Ratio of Females per 100 Males in Richfield?
There are 96.51 Females per 100 Males in Richfield.
What is the Median Population Age in Richfield?
Median Population Age in Richfield is 47.5 Years.
What is the Average Family Size in Richfield
Average Family Size in Richfield is 2.8 People.
What is the Average Household Size in Richfield
Average Household Size in Richfield is 2.6 People.
What is Per Capita Income in Richfield?
Per Capita income in Richfield is $60,912.
What is the Median Family Income in Richfield?
Median Family Income in Richfield is $148,580.
What is the Median Household income in Richfield?
Median Household Income in Richfield is $128,165.
What is Income or Wage Gap in Richfield?
Income or Wage Gap in Richfield is 38.2%.
Women in Richfield earn 61.8 cents for every dollar earned by a man.
What is Inequality or Gini Index in Richfield?
Inequality or Gini Index in Richfield is 0.39.
How Large is the Labor Force in Richfield?
There are 6,761 People in the Labor Forcein in Richfield.
What is the Percentage of People in the Labor Force in Richfield?
70.6% of People are in the Labor Force in Richfield.
What is the Unemployment Rate in Richfield?
Unemployment Rate in Richfield is 1.0%.