Summit, WI
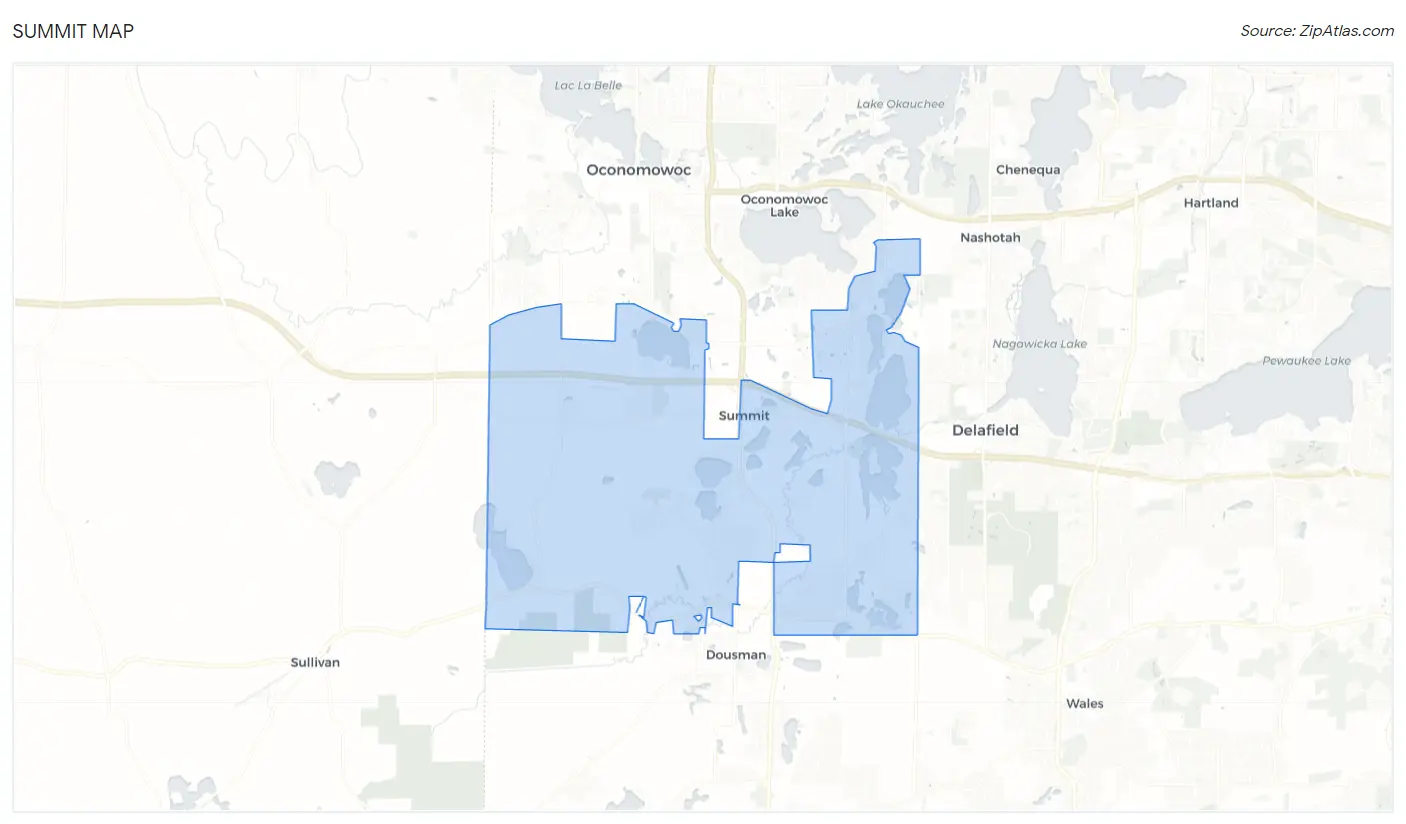
Summit Map
Summit Overview
4,914
TOTAL POPULATION
2,685
MALE POPULATION
2,229
FEMALE POPULATION
120.46
MALES / 100 FEMALES
83.02
FEMALES / 100 MALES
52.7
MEDIAN AGE
2.9
AVG FAMILY SIZE
2.5
AVG HOUSEHOLD SIZE
$62,480
PER CAPITA INCOME
$136,857
AVG FAMILY INCOME
$125,298
AVG HOUSEHOLD INCOME
44.0%
WAGE / INCOME GAP [ % ]
56.0¢/ $1
WAGE / INCOME GAP [ $ ]
0.44
INEQUALITY / GINI INDEX
2,355
LABOR FORCE [ PEOPLE ]
57.1%
PERCENT IN LABOR FORCE
0.5%
UNEMPLOYMENT RATE
Race in Summit
The most populous races in Summit are White / Caucasian (4,444 | 90.4%), Hispanic or Latino (251 | 5.1%), and Two or more Races (224 | 4.6%).
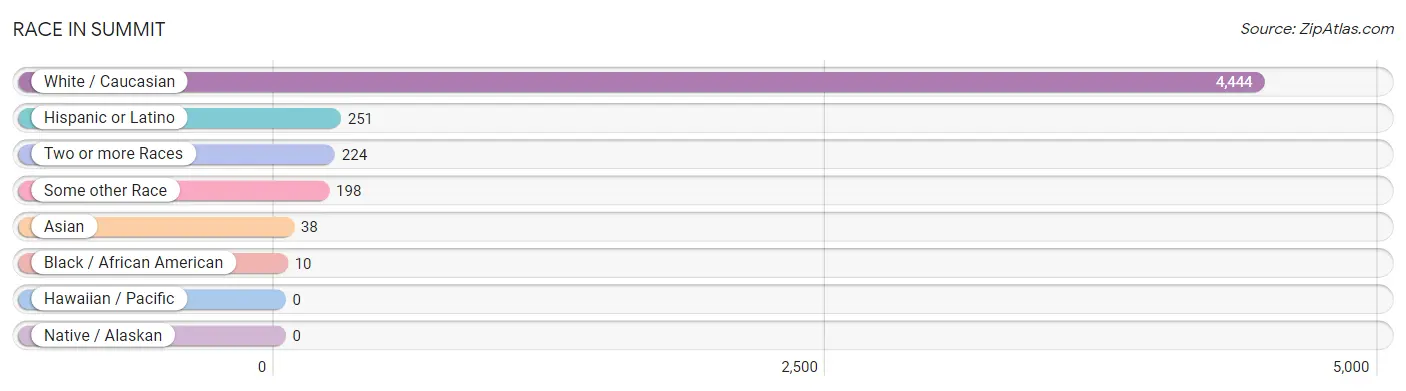
| Race | # Population | % Population |
| Asian | 38 | 0.8% |
| Black / African American | 10 | 0.2% |
| Hawaiian / Pacific | 0 | 0.0% |
| Hispanic or Latino | 251 | 5.1% |
| Native / Alaskan | 0 | 0.0% |
| White / Caucasian | 4,444 | 90.4% |
| Two or more Races | 224 | 4.6% |
| Some other Race | 198 | 4.0% |
| Total | 4,914 | 100.0% |
Ancestry in Summit
The most populous ancestries reported in Summit are German (2,017 | 41.0%), Irish (838 | 17.1%), English (574 | 11.7%), Italian (494 | 10.1%), and Polish (487 | 9.9%), together accounting for 89.7% of all Summit residents.
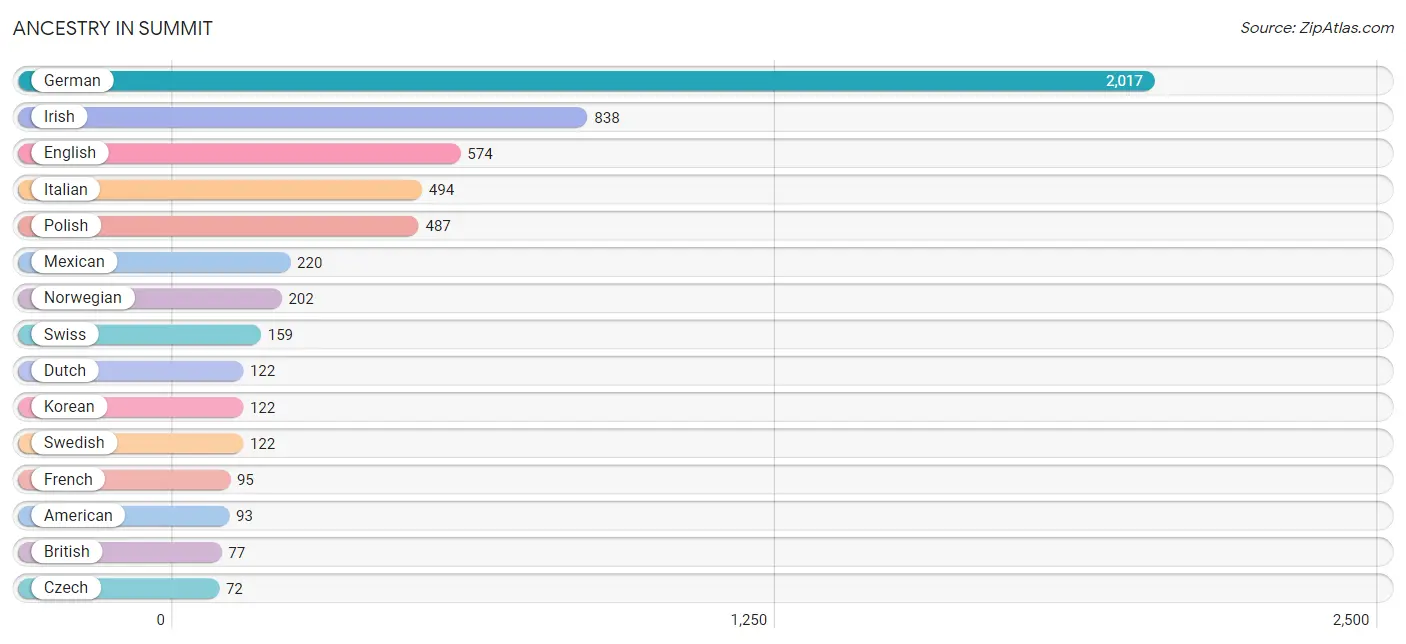
| Ancestry | # Population | % Population |
| American | 93 | 1.9% |
| Austrian | 18 | 0.4% |
| Belgian | 63 | 1.3% |
| British | 77 | 1.6% |
| Chippewa | 7 | 0.1% |
| Czech | 72 | 1.5% |
| Czechoslovakian | 19 | 0.4% |
| Danish | 19 | 0.4% |
| Dutch | 122 | 2.5% |
| Eastern European | 7 | 0.1% |
| English | 574 | 11.7% |
| European | 69 | 1.4% |
| Finnish | 49 | 1.0% |
| French | 95 | 1.9% |
| French Canadian | 21 | 0.4% |
| German | 2,017 | 41.0% |
| Greek | 47 | 1.0% |
| Indian (Asian) | 17 | 0.4% |
| Irish | 838 | 17.1% |
| Italian | 494 | 10.1% |
| Korean | 122 | 2.5% |
| Latvian | 22 | 0.4% |
| Luxembourger | 25 | 0.5% |
| Mexican | 220 | 4.5% |
| Norwegian | 202 | 4.1% |
| Polish | 487 | 9.9% |
| Puerto Rican | 27 | 0.5% |
| Russian | 6 | 0.1% |
| Scandinavian | 19 | 0.4% |
| Scotch-Irish | 24 | 0.5% |
| Scottish | 58 | 1.2% |
| Serbian | 10 | 0.2% |
| Slovak | 12 | 0.2% |
| Swedish | 122 | 2.5% |
| Swiss | 159 | 3.2% |
| Thai | 21 | 0.4% |
| Ukrainian | 10 | 0.2% |
| Welsh | 14 | 0.3% | View All 38 Rows |
Immigrants in Summit
The most numerous immigrant groups reported in Summit came from Central America (132 | 2.7%), Latin America (132 | 2.7%), Mexico (132 | 2.7%), Canada (74 | 1.5%), and Asia (38 | 0.8%), together accounting for 10.3% of all Summit residents.
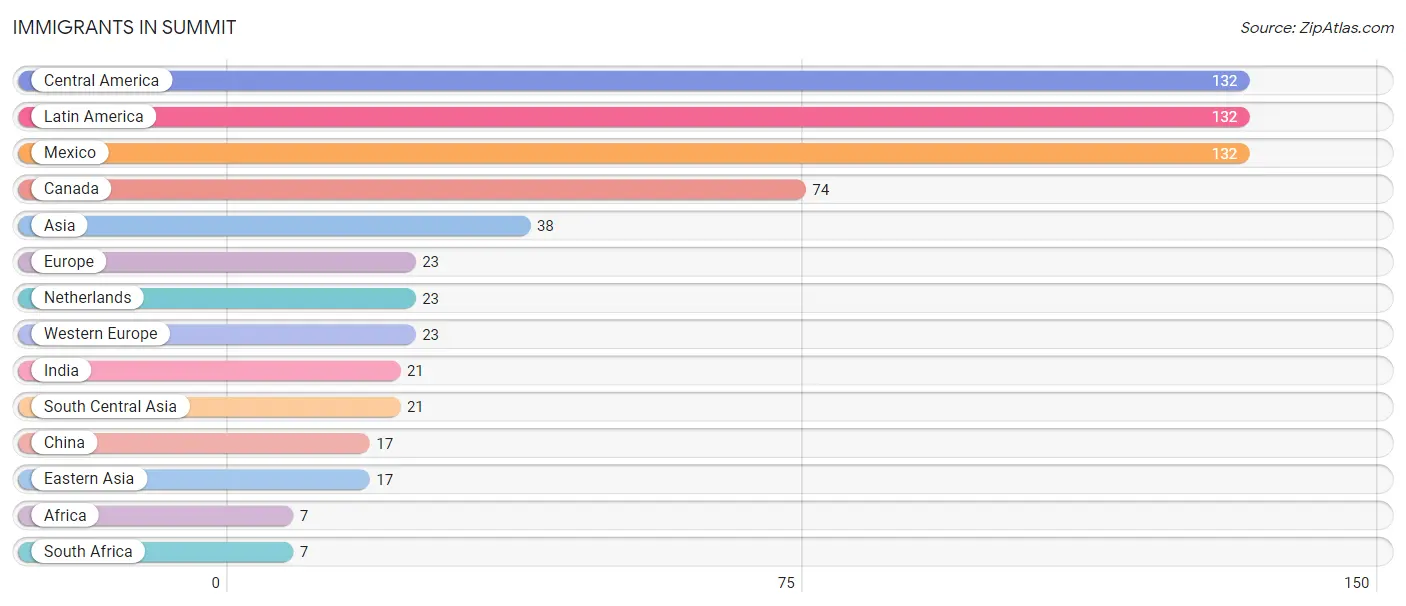
| Immigration Origin | # Population | % Population |
| Africa | 7 | 0.1% |
| Asia | 38 | 0.8% |
| Canada | 74 | 1.5% |
| Central America | 132 | 2.7% |
| China | 17 | 0.4% |
| Eastern Asia | 17 | 0.4% |
| Europe | 23 | 0.5% |
| India | 21 | 0.4% |
| Latin America | 132 | 2.7% |
| Mexico | 132 | 2.7% |
| Netherlands | 23 | 0.5% |
| South Africa | 7 | 0.1% |
| South Central Asia | 21 | 0.4% |
| Western Europe | 23 | 0.5% | View All 14 Rows |
Sex and Age in Summit
Sex and Age in Summit
The most populous age groups in Summit are 60 to 64 Years (350 | 13.0%) for men and 60 to 64 Years (291 | 13.1%) for women.
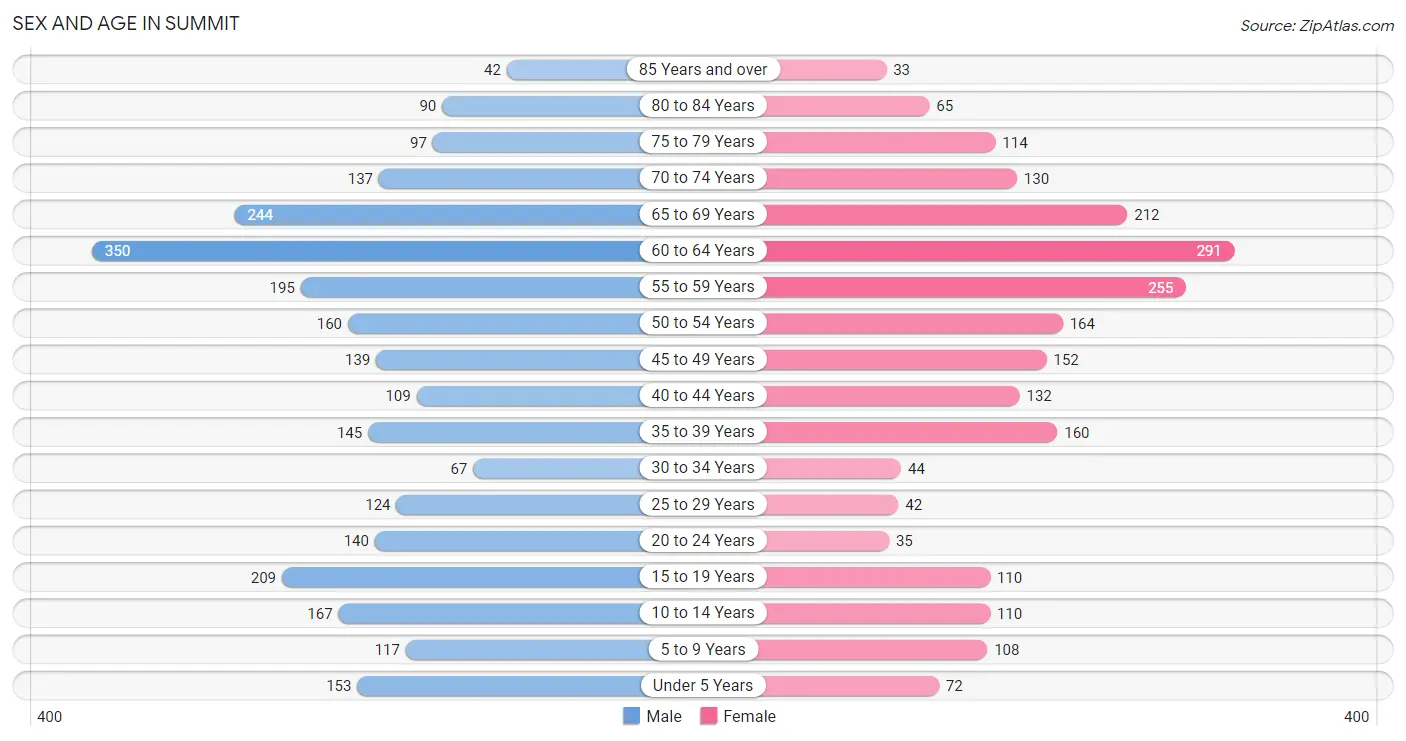
| Age Bracket | Male | Female |
| Under 5 Years | 153 (5.7%) | 72 (3.2%) |
| 5 to 9 Years | 117 (4.4%) | 108 (4.9%) |
| 10 to 14 Years | 167 (6.2%) | 110 (4.9%) |
| 15 to 19 Years | 209 (7.8%) | 110 (4.9%) |
| 20 to 24 Years | 140 (5.2%) | 35 (1.6%) |
| 25 to 29 Years | 124 (4.6%) | 42 (1.9%) |
| 30 to 34 Years | 67 (2.5%) | 44 (2.0%) |
| 35 to 39 Years | 145 (5.4%) | 160 (7.2%) |
| 40 to 44 Years | 109 (4.1%) | 132 (5.9%) |
| 45 to 49 Years | 139 (5.2%) | 152 (6.8%) |
| 50 to 54 Years | 160 (6.0%) | 164 (7.4%) |
| 55 to 59 Years | 195 (7.3%) | 255 (11.4%) |
| 60 to 64 Years | 350 (13.0%) | 291 (13.1%) |
| 65 to 69 Years | 244 (9.1%) | 212 (9.5%) |
| 70 to 74 Years | 137 (5.1%) | 130 (5.8%) |
| 75 to 79 Years | 97 (3.6%) | 114 (5.1%) |
| 80 to 84 Years | 90 (3.4%) | 65 (2.9%) |
| 85 Years and over | 42 (1.6%) | 33 (1.5%) |
| Total | 2,685 (100.0%) | 2,229 (100.0%) |
Families and Households in Summit
Median Family Size in Summit
The median family size in Summit is 2.89 persons per family, with married-couple families (1,382 | 93.9%) accounting for the largest median family size of 2.94 persons per family. On the other hand, single female/mother families (59 | 4.0%) represent the smallest median family size with 2.15 persons per family.
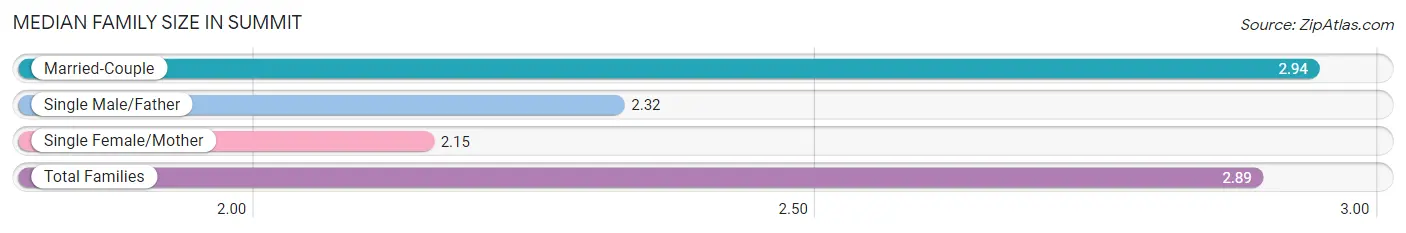
| Family Type | # Families | Family Size |
| Married-Couple | 1,382 (93.9%) | 2.94 |
| Single Male/Father | 31 (2.1%) | 2.32 |
| Single Female/Mother | 59 (4.0%) | 2.15 |
| Total Families | 1,472 (100.0%) | 2.89 |
Median Household Size in Summit
The median household size in Summit is 2.55 persons per household, with married-couple households (1,382 | 73.0%) accounting for the largest median household size of 2.95 persons per household. non-family households (421 | 22.2%) represent the smallest median household size with 1.24 persons per household.
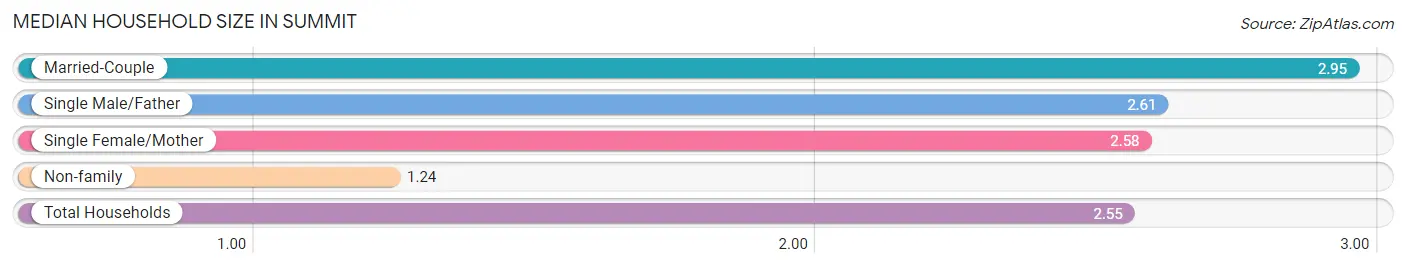
| Household Type | # Households | Household Size |
| Married-Couple | 1,382 (73.0%) | 2.95 |
| Single Male/Father | 31 (1.6%) | 2.61 |
| Single Female/Mother | 59 (3.1%) | 2.58 |
| Non-family | 421 (22.2%) | 1.24 |
| Total Households | 1,893 (100.0%) | 2.55 |
Household Size by Marriage Status in Summit
Out of a total of 1,893 households in Summit, 1,472 (77.8%) are family households, while 421 (22.2%) are nonfamily households. The most numerous type of family households are 2-person households, comprising 777, and the most common type of nonfamily households are 1-person households, comprising 329.
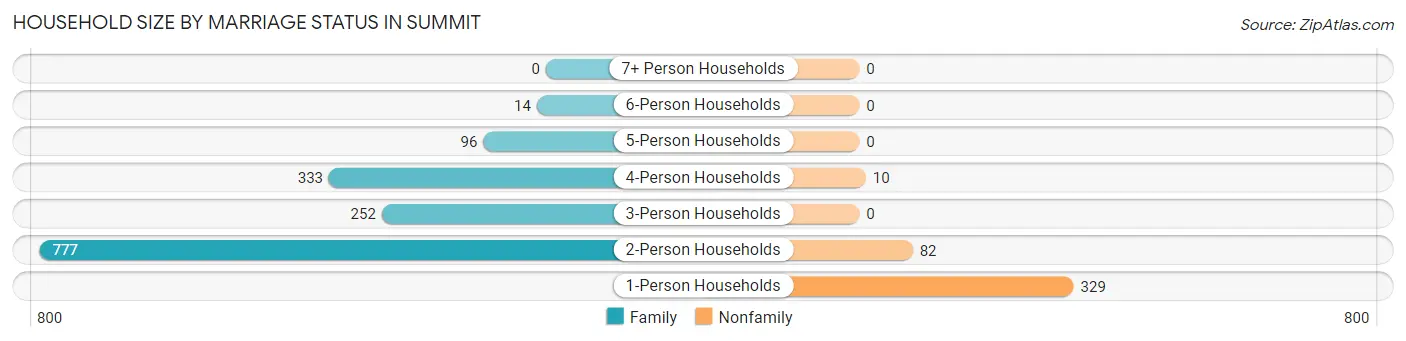
| Household Size | Family Households | Nonfamily Households |
| 1-Person Households | - | 329 (17.4%) |
| 2-Person Households | 777 (41.0%) | 82 (4.3%) |
| 3-Person Households | 252 (13.3%) | 0 (0.0%) |
| 4-Person Households | 333 (17.6%) | 10 (0.5%) |
| 5-Person Households | 96 (5.1%) | 0 (0.0%) |
| 6-Person Households | 14 (0.7%) | 0 (0.0%) |
| 7+ Person Households | 0 (0.0%) | 0 (0.0%) |
| Total | 1,472 (77.8%) | 421 (22.2%) |
Female Fertility in Summit
Fertility by Age in Summit
Average fertility rate in Summit is 76.0 births per 1,000 women. Women in the age bracket of 35 to 50 years have the highest fertility rate with 114.0 births per 1,000 women. Women in the age bracket of 35 to 50 years acount for 100.0% of all women with births.
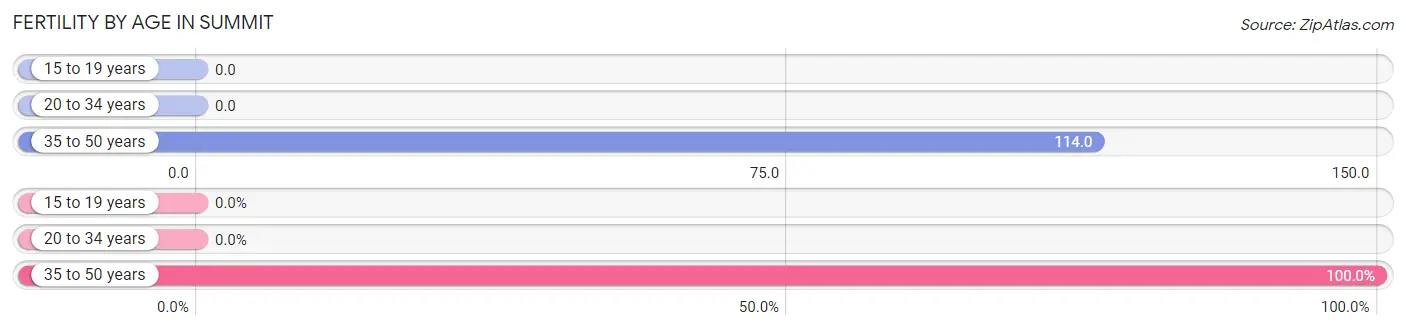
| Age Bracket | Women with Births | Births / 1,000 Women |
| 15 to 19 years | 0 (0.0%) | 0.0 |
| 20 to 34 years | 0 (0.0%) | 0.0 |
| 35 to 50 years | 53 (100.0%) | 114.0 |
| Total | 53 (100.0%) | 76.0 |
Fertility by Age by Marriage Status in Summit
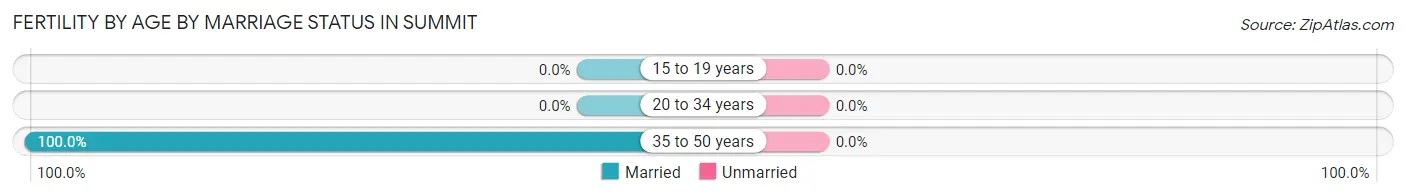
| Age Bracket | Married | Unmarried |
| 15 to 19 years | 0 (0.0%) | 0 (0.0%) |
| 20 to 34 years | 0 (0.0%) | 0 (0.0%) |
| 35 to 50 years | 53 (100.0%) | 0 (0.0%) |
| Total | 53 (100.0%) | 0 (0.0%) |
Fertility by Education in Summit
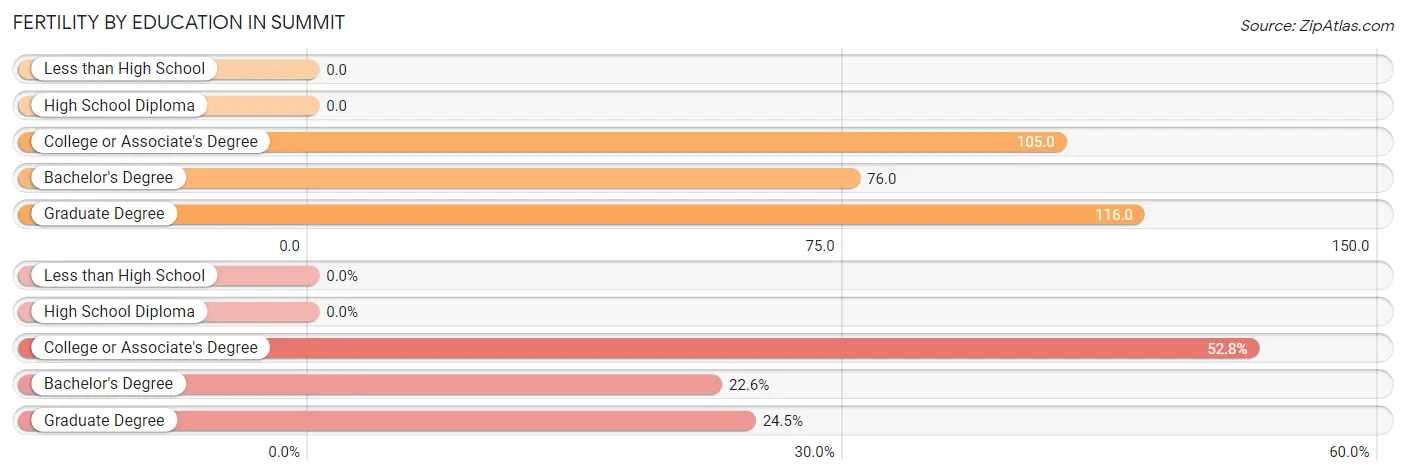
| Educational Attainment | Women with Births | Births / 1,000 Women |
| Less than High School | 0 (0.0%) | 0.0 |
| High School Diploma | 0 (0.0%) | 0.0 |
| College or Associate's Degree | 28 (52.8%) | 105.0 |
| Bachelor's Degree | 12 (22.6%) | 76.0 |
| Graduate Degree | 13 (24.5%) | 116.0 |
| Total | 53 (100.0%) | 76.0 |
Fertility by Education by Marriage Status in Summit
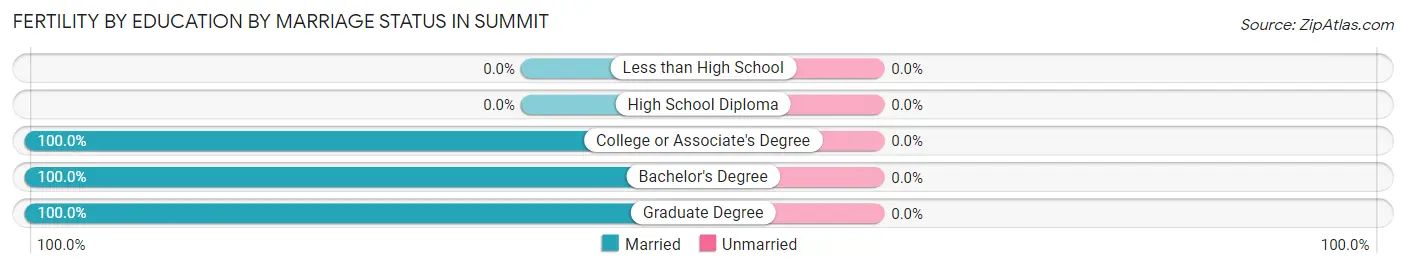
| Educational Attainment | Married | Unmarried |
| Less than High School | 0 (0.0%) | 0 (0.0%) |
| High School Diploma | 0 (0.0%) | 0 (0.0%) |
| College or Associate's Degree | 28 (100.0%) | 0 (0.0%) |
| Bachelor's Degree | 12 (100.0%) | 0 (0.0%) |
| Graduate Degree | 13 (100.0%) | 0 (0.0%) |
| Total | 53 (100.0%) | 0 (0.0%) |
Income in Summit
Income Overview in Summit
Per Capita Income in Summit is $62,480, while median incomes of families and households are $136,857 and $125,298 respectively.
| Characteristic | Number | Measure |
| Per Capita Income | 4,914 | $62,480 |
| Median Family Income | 1,472 | $136,857 |
| Mean Family Income | 1,472 | $179,452 |
| Median Household Income | 1,893 | $125,298 |
| Mean Household Income | 1,893 | $161,825 |
| Income Deficit | 1,472 | $0 |
| Wage / Income Gap (%) | 4,914 | 44.01% |
| Wage / Income Gap ($) | 4,914 | 55.99¢ per $1 |
| Gini / Inequality Index | 4,914 | 0.44 |
Earnings by Sex in Summit
Average Earnings in Summit are $50,435, $78,333 for men and $43,857 for women, a difference of 44.0%.
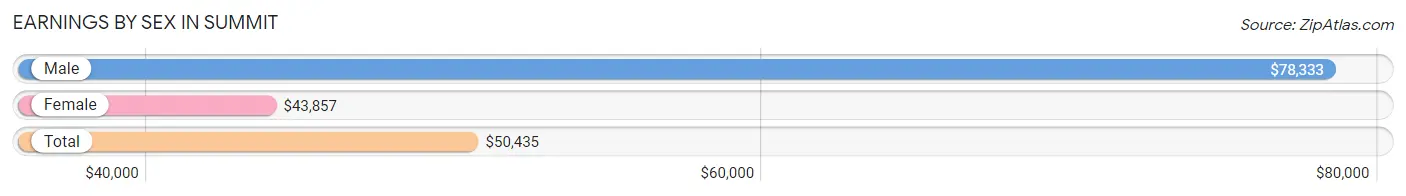
| Sex | Number | Average Earnings |
| Male | 1,478 (57.2%) | $78,333 |
| Female | 1,108 (42.8%) | $43,857 |
| Total | 2,586 (100.0%) | $50,435 |
Earnings by Sex by Income Bracket in Summit
The most common earnings brackets in Summit are $100,000+ for men (543 | 36.7%) and $100,000+ for women (178 | 16.1%).
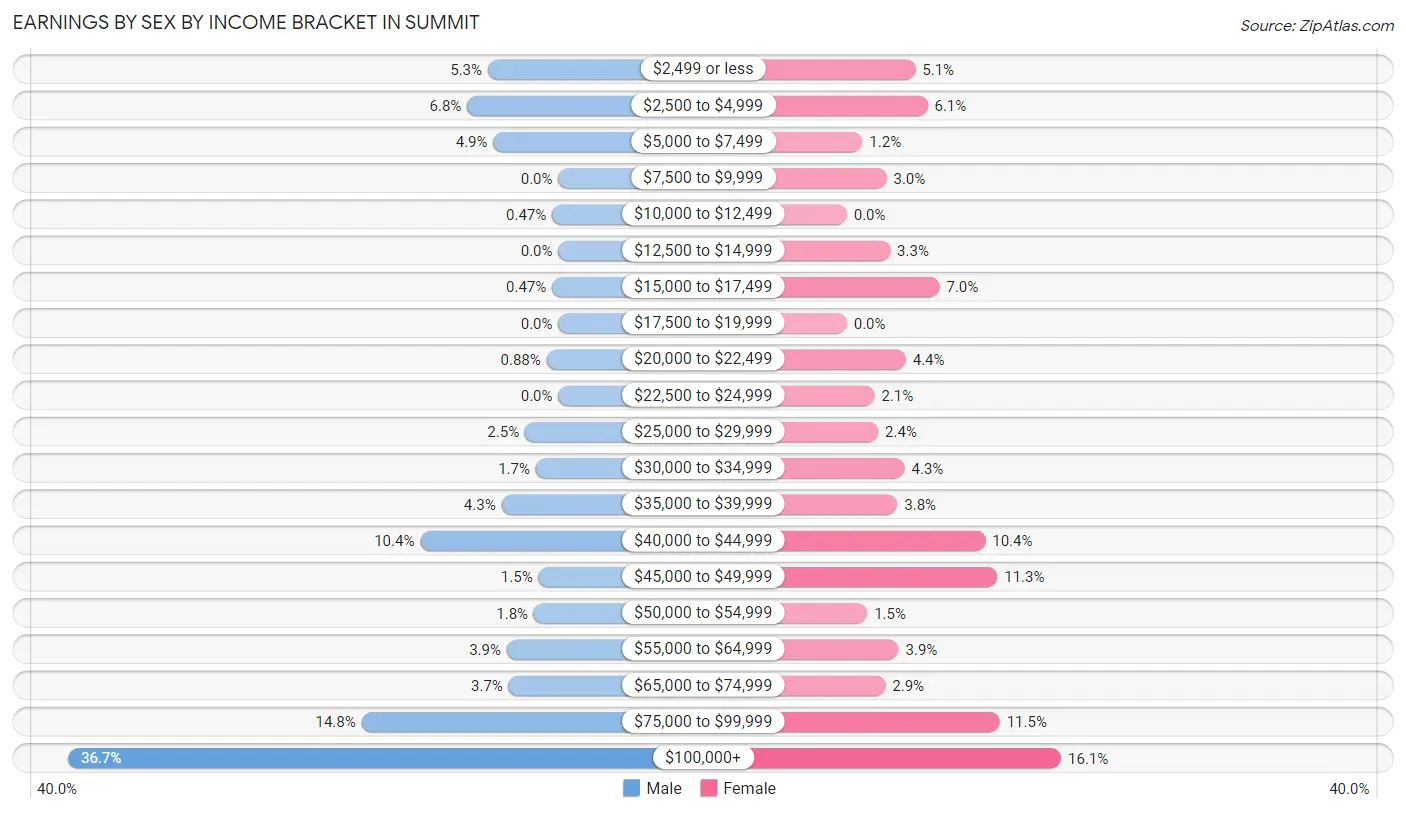
| Income | Male | Female |
| $2,499 or less | 78 (5.3%) | 57 (5.1%) |
| $2,500 to $4,999 | 101 (6.8%) | 67 (6.0%) |
| $5,000 to $7,499 | 72 (4.9%) | 13 (1.2%) |
| $7,500 to $9,999 | 0 (0.0%) | 33 (3.0%) |
| $10,000 to $12,499 | 7 (0.5%) | 0 (0.0%) |
| $12,500 to $14,999 | 0 (0.0%) | 36 (3.3%) |
| $15,000 to $17,499 | 7 (0.5%) | 77 (7.0%) |
| $17,500 to $19,999 | 0 (0.0%) | 0 (0.0%) |
| $20,000 to $22,499 | 13 (0.9%) | 49 (4.4%) |
| $22,500 to $24,999 | 0 (0.0%) | 23 (2.1%) |
| $25,000 to $29,999 | 37 (2.5%) | 26 (2.4%) |
| $30,000 to $34,999 | 25 (1.7%) | 48 (4.3%) |
| $35,000 to $39,999 | 63 (4.3%) | 42 (3.8%) |
| $40,000 to $44,999 | 153 (10.3%) | 115 (10.4%) |
| $45,000 to $49,999 | 22 (1.5%) | 125 (11.3%) |
| $50,000 to $54,999 | 27 (1.8%) | 17 (1.5%) |
| $55,000 to $64,999 | 57 (3.9%) | 43 (3.9%) |
| $65,000 to $74,999 | 55 (3.7%) | 32 (2.9%) |
| $75,000 to $99,999 | 218 (14.7%) | 127 (11.5%) |
| $100,000+ | 543 (36.7%) | 178 (16.1%) |
| Total | 1,478 (100.0%) | 1,108 (100.0%) |
Earnings by Sex by Educational Attainment in Summit
Average earnings in Summit are $81,863 for men and $45,473 for women, a difference of 44.5%. Men with an educational attainment of graduate degree enjoy the highest average annual earnings of $162,604, while those with college or associate's degree education earn the least with $45,511. Women with an educational attainment of graduate degree earn the most with the average annual earnings of $65,875, while those with high school diploma education have the smallest earnings of $34,306.
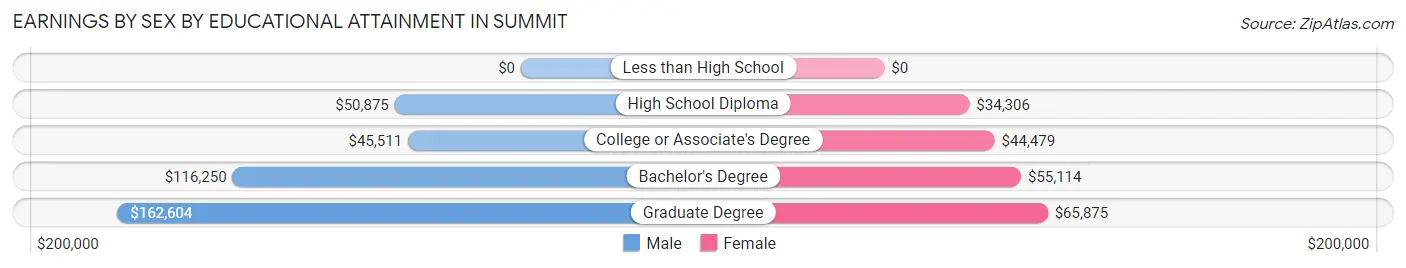
| Educational Attainment | Male Income | Female Income |
| Less than High School | - | - |
| High School Diploma | $50,875 | $34,306 |
| College or Associate's Degree | $45,511 | $44,479 |
| Bachelor's Degree | $116,250 | $55,114 |
| Graduate Degree | $162,604 | $65,875 |
| Total | $81,863 | $45,473 |
Family Income in Summit
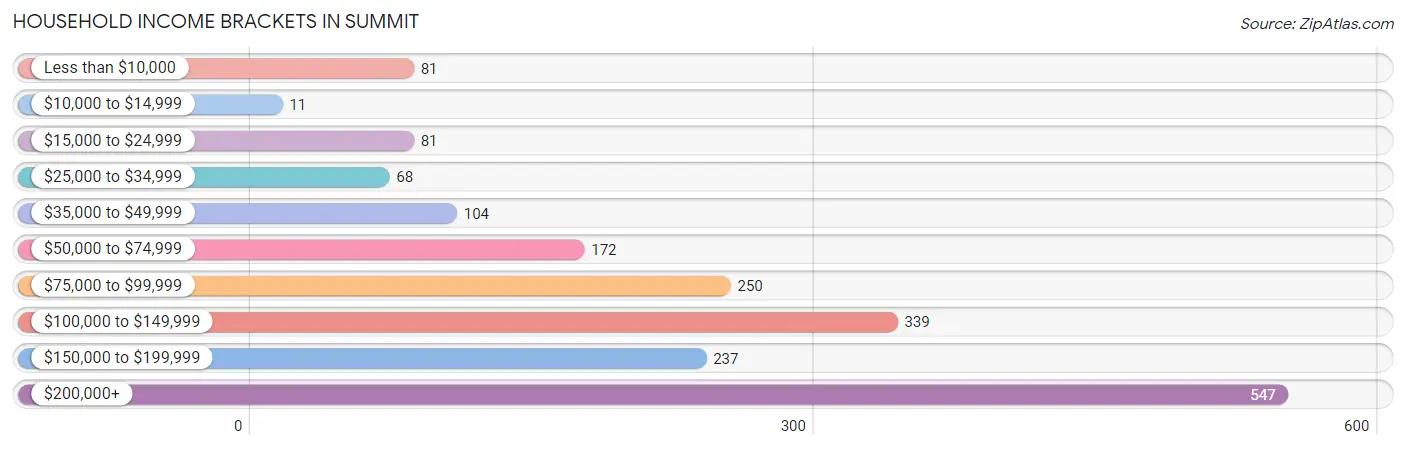
Family Income Brackets in Summit
According to the Summit family income data, there are 495 families falling into the $200,000+ income range, which is the most common income bracket and makes up 33.6% of all families.
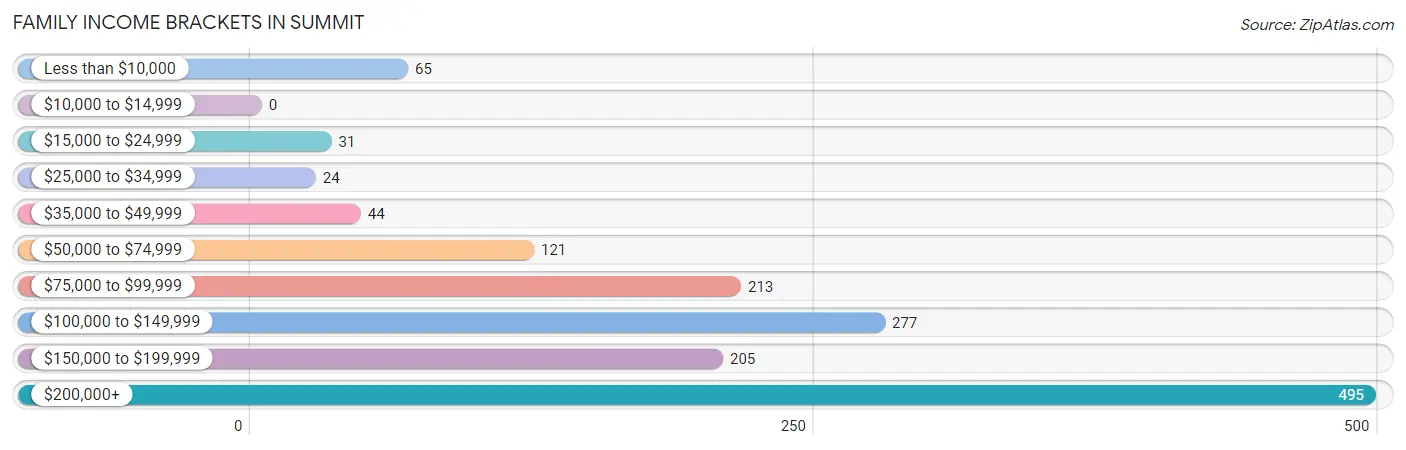
| Income Bracket | # Families | % Families |
| Less than $10,000 | 65 | 4.4% |
| $10,000 to $14,999 | 0 | 0.0% |
| $15,000 to $24,999 | 31 | 2.1% |
| $25,000 to $34,999 | 24 | 1.6% |
| $35,000 to $49,999 | 44 | 3.0% |
| $50,000 to $74,999 | 121 | 8.2% |
| $75,000 to $99,999 | 213 | 14.5% |
| $100,000 to $149,999 | 277 | 18.8% |
| $150,000 to $199,999 | 205 | 13.9% |
| $200,000+ | 495 | 33.6% |
Family Income by Famaliy Size in Summit
3-person families (220 | 14.9%) account for the highest median family income in Summit with $210,000 per family, while 3-person families (220 | 14.9%) have the highest median income of $70,000 per family member.
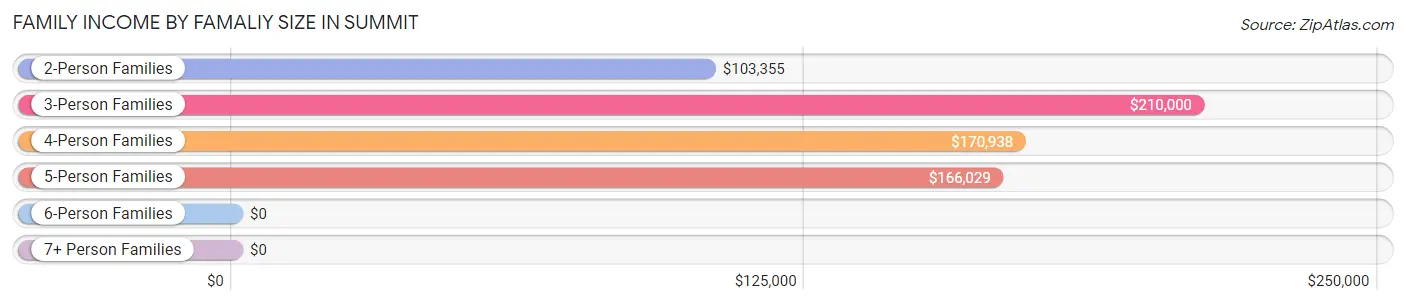
| Income Bracket | # Families | Median Income |
| 2-Person Families | 809 (55.0%) | $103,355 |
| 3-Person Families | 220 (14.9%) | $210,000 |
| 4-Person Families | 340 (23.1%) | $170,938 |
| 5-Person Families | 96 (6.5%) | $166,029 |
| 6-Person Families | 7 (0.5%) | $0 |
| 7+ Person Families | 0 (0.0%) | $0 |
| Total | 1,472 (100.0%) | $136,857 |
Family Income by Number of Earners in Summit
The median family income in Summit is $136,857, with families comprising 3+ earners (260) having the highest median family income of $203,182, while families with no earners (382) have the lowest median family income of $78,047, accounting for 17.7% and 26.0% of families, respectively.
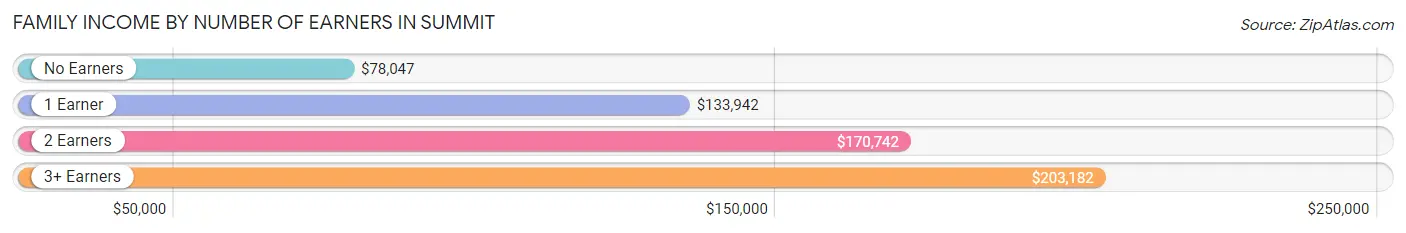
| Number of Earners | # Families | Median Income |
| No Earners | 382 (26.0%) | $78,047 |
| 1 Earner | 241 (16.4%) | $133,942 |
| 2 Earners | 589 (40.0%) | $170,742 |
| 3+ Earners | 260 (17.7%) | $203,182 |
| Total | 1,472 (100.0%) | $136,857 |
Household Income in Summit
Household Income Brackets in Summit
With 547 households falling in the category, the $200,000+ income range is the most frequent in Summit, accounting for 28.9% of all households. In contrast, only 11 households (0.6%) fall into the $10,000 to $14,999 income bracket, making it the least populous group.
| Income Bracket | # Households | % Households |
| Less than $10,000 | 81 | 4.3% |
| $10,000 to $14,999 | 11 | 0.6% |
| $15,000 to $24,999 | 81 | 4.3% |
| $25,000 to $34,999 | 68 | 3.6% |
| $35,000 to $49,999 | 104 | 5.5% |
| $50,000 to $74,999 | 172 | 9.1% |
| $75,000 to $99,999 | 250 | 13.2% |
| $100,000 to $149,999 | 339 | 17.9% |
| $150,000 to $199,999 | 237 | 12.5% |
| $200,000+ | 547 | 28.9% |
Household Income by Householder Age in Summit
The median household income in Summit is $125,298, with the highest median household income of $158,042 found in the 25 to 44 years age bracket for the primary householder. A total of 317 households (16.8%) fall into this category.
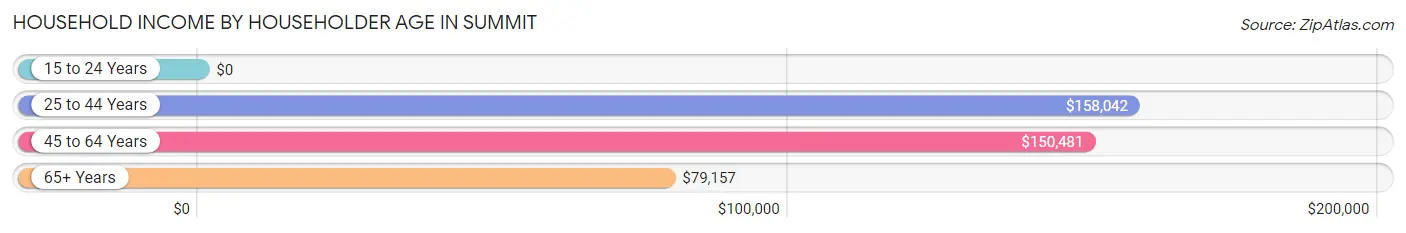
| Income Bracket | # Households | Median Income |
| 15 to 24 Years | 0 (0.0%) | $0 |
| 25 to 44 Years | 317 (16.8%) | $158,042 |
| 45 to 64 Years | 869 (45.9%) | $150,481 |
| 65+ Years | 707 (37.3%) | $79,157 |
| Total | 1,893 (100.0%) | $125,298 |
Poverty in Summit
Income Below Poverty by Sex and Age in Summit
With 6.5% poverty level for males and 5.4% for females among the residents of Summit, 15 year old males and 75 year old and over females are the most vulnerable to poverty, with 7 males (24.1%) and 24 females (12.1%) in their respective age groups living below the poverty level.
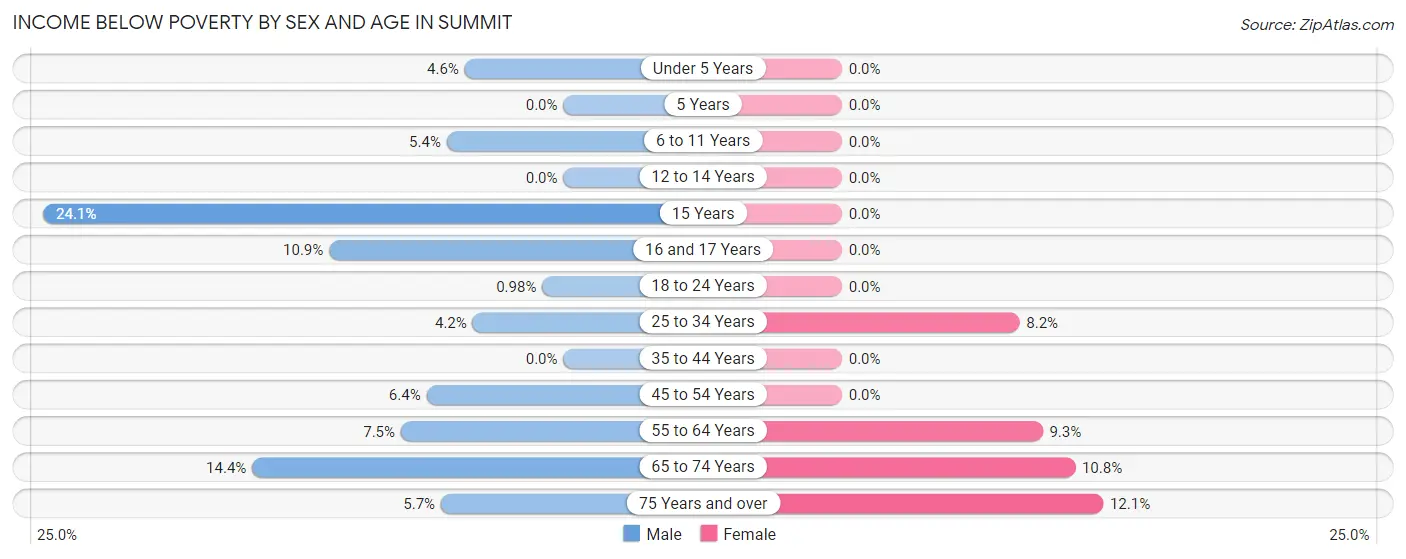
| Age Bracket | Male | Female |
| Under 5 Years | 7 (4.6%) | 0 (0.0%) |
| 5 Years | 0 (0.0%) | 0 (0.0%) |
| 6 to 11 Years | 10 (5.4%) | 0 (0.0%) |
| 12 to 14 Years | 0 (0.0%) | 0 (0.0%) |
| 15 Years | 7 (24.1%) | 0 (0.0%) |
| 16 and 17 Years | 10 (10.9%) | 0 (0.0%) |
| 18 to 24 Years | 2 (1.0%) | 0 (0.0%) |
| 25 to 34 Years | 8 (4.2%) | 7 (8.2%) |
| 35 to 44 Years | 0 (0.0%) | 0 (0.0%) |
| 45 to 54 Years | 19 (6.4%) | 0 (0.0%) |
| 55 to 64 Years | 41 (7.5%) | 50 (9.3%) |
| 65 to 74 Years | 55 (14.4%) | 37 (10.8%) |
| 75 Years and over | 13 (5.7%) | 24 (12.1%) |
| Total | 172 (6.5%) | 118 (5.4%) |
Income Above Poverty by Sex and Age in Summit
According to the poverty statistics in Summit, males aged 5 years and females aged under 5 years are the age groups that are most secure financially, with 100.0% of males and 100.0% of females in these age groups living above the poverty line.
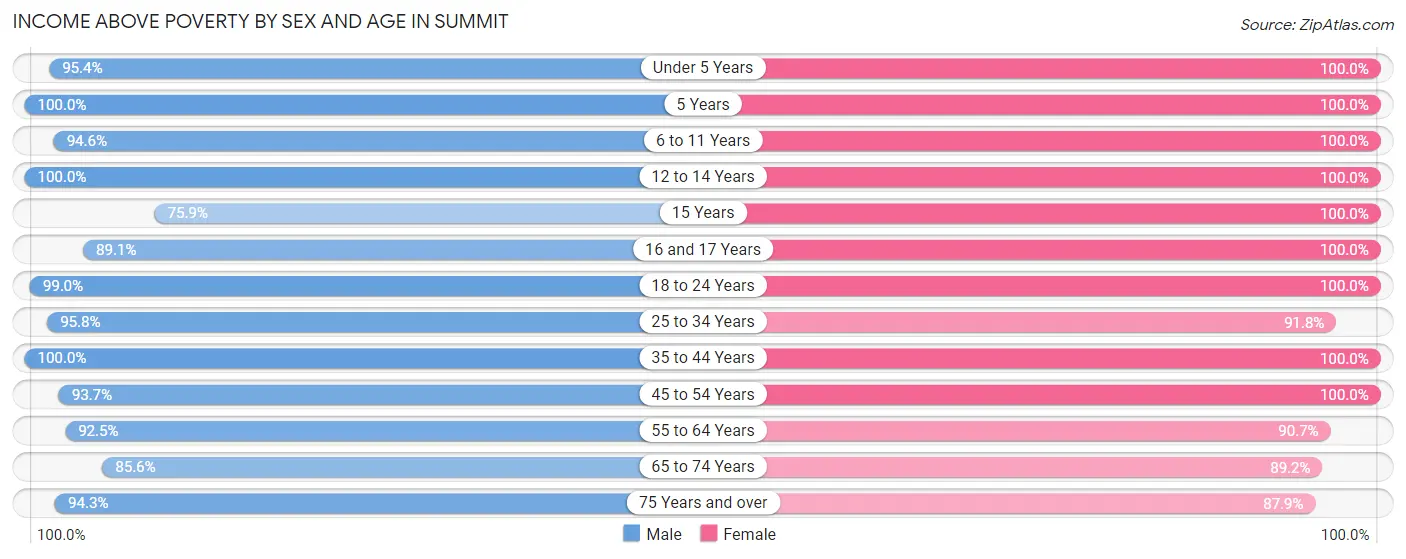
| Age Bracket | Male | Female |
| Under 5 Years | 146 (95.4%) | 72 (100.0%) |
| 5 Years | 12 (100.0%) | 49 (100.0%) |
| 6 to 11 Years | 175 (94.6%) | 79 (100.0%) |
| 12 to 14 Years | 61 (100.0%) | 84 (100.0%) |
| 15 Years | 22 (75.9%) | 21 (100.0%) |
| 16 and 17 Years | 82 (89.1%) | 57 (100.0%) |
| 18 to 24 Years | 203 (99.0%) | 61 (100.0%) |
| 25 to 34 Years | 182 (95.8%) | 78 (91.8%) |
| 35 to 44 Years | 254 (100.0%) | 292 (100.0%) |
| 45 to 54 Years | 280 (93.6%) | 315 (100.0%) |
| 55 to 64 Years | 503 (92.5%) | 487 (90.7%) |
| 65 to 74 Years | 326 (85.6%) | 305 (89.2%) |
| 75 Years and over | 216 (94.3%) | 174 (87.9%) |
| Total | 2,462 (93.5%) | 2,074 (94.6%) |
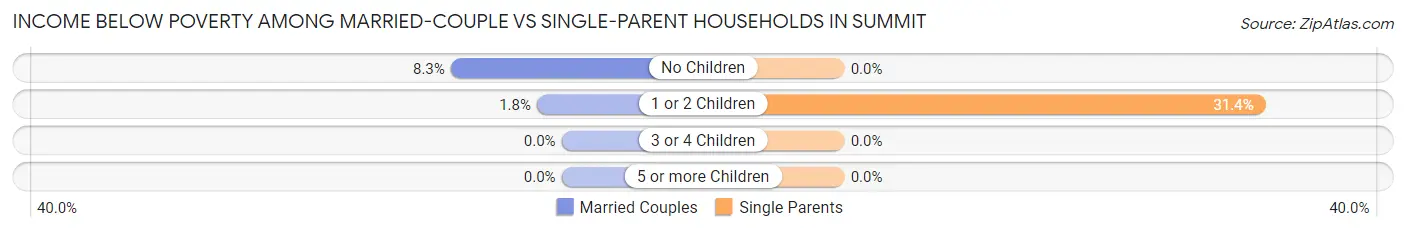
Income Below Poverty Among Married-Couple Families in Summit
The poverty statistics for married-couple families in Summit show that 6.1% or 85 of the total 1,382 families live below the poverty line. Families with no children have the highest poverty rate of 8.3%, comprising of 78 families. On the other hand, families with 3 or 4 children have the lowest poverty rate of 0.0%, which includes 0 families.
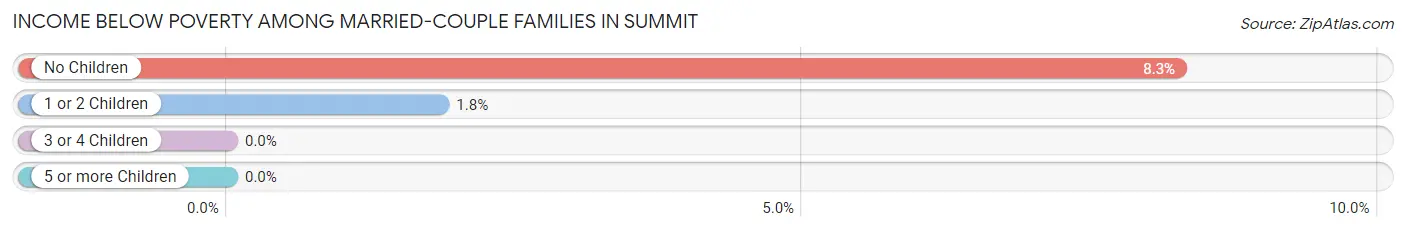
| Children | Above Poverty | Below Poverty |
| No Children | 866 (91.7%) | 78 (8.3%) |
| 1 or 2 Children | 374 (98.2%) | 7 (1.8%) |
| 3 or 4 Children | 57 (100.0%) | 0 (0.0%) |
| 5 or more Children | 0 (0.0%) | 0 (0.0%) |
| Total | 1,297 (93.9%) | 85 (6.1%) |
Income Below Poverty Among Single-Parent Households in Summit
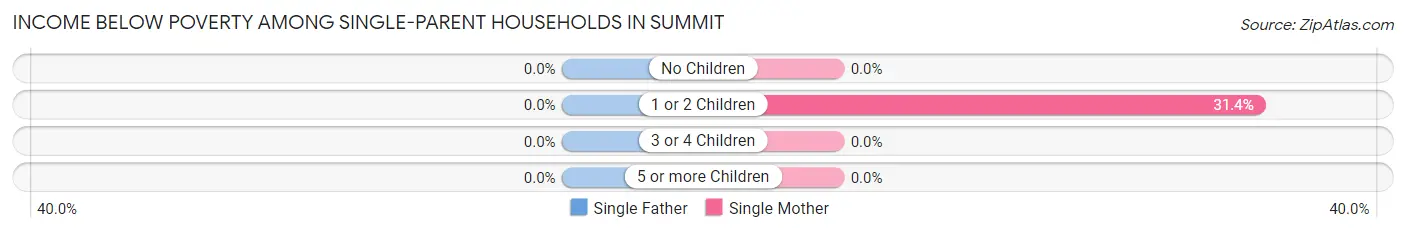
| Children | Single Father | Single Mother |
| No Children | 0 (0.0%) | 0 (0.0%) |
| 1 or 2 Children | 0 (0.0%) | 11 (31.4%) |
| 3 or 4 Children | 0 (0.0%) | 0 (0.0%) |
| 5 or more Children | 0 (0.0%) | 0 (0.0%) |
| Total | 0 (0.0%) | 11 (18.6%) |
Income Below Poverty Among Married-Couple vs Single-Parent Households in Summit
The poverty data for Summit shows that 85 of the married-couple family households (6.1%) and 11 of the single-parent households (12.2%) are living below the poverty level. Within the married-couple family households, those with no children have the highest poverty rate, with 78 households (8.3%) falling below the poverty line. Among the single-parent households, those with 1 or 2 children have the highest poverty rate, with 11 household (31.4%) living below poverty.
| Children | Married-Couple Families | Single-Parent Households |
| No Children | 78 (8.3%) | 0 (0.0%) |
| 1 or 2 Children | 7 (1.8%) | 11 (31.4%) |
| 3 or 4 Children | 0 (0.0%) | 0 (0.0%) |
| 5 or more Children | 0 (0.0%) | 0 (0.0%) |
| Total | 85 (6.1%) | 11 (12.2%) |
Employment Characteristics in Summit
Employment by Class of Employer in Summit
Among the 2,231 employed individuals in Summit, private company employees (1,651 | 74.0%), not-for-profit organizations (175 | 7.8%), and local government employees (120 | 5.4%) make up the most common classes of employment.
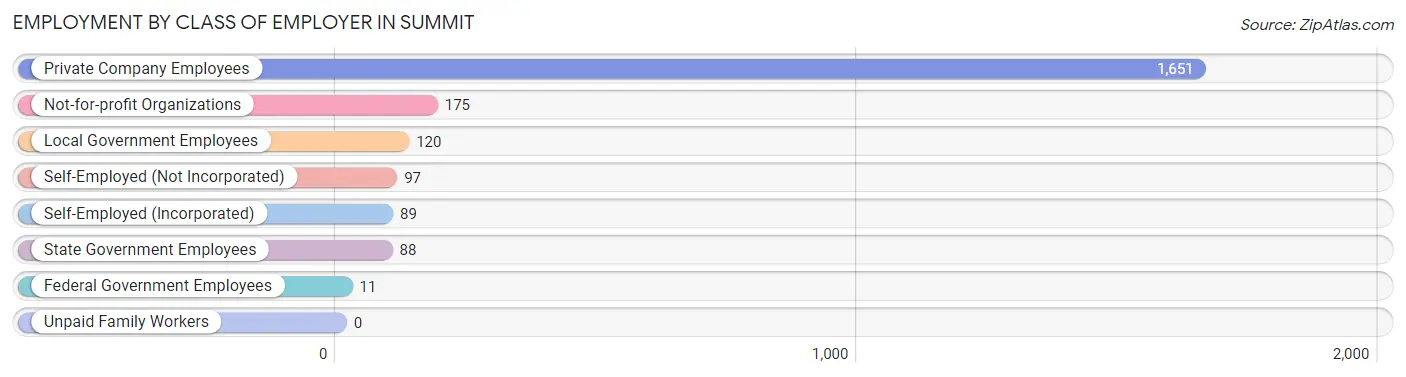
| Employer Class | # Employees | % Employees |
| Private Company Employees | 1,651 | 74.0% |
| Self-Employed (Incorporated) | 89 | 4.0% |
| Self-Employed (Not Incorporated) | 97 | 4.3% |
| Not-for-profit Organizations | 175 | 7.8% |
| Local Government Employees | 120 | 5.4% |
| State Government Employees | 88 | 3.9% |
| Federal Government Employees | 11 | 0.5% |
| Unpaid Family Workers | 0 | 0.0% |
| Total | 2,231 | 100.0% |
Employment Status by Age in Summit
According to the labor force statistics for Summit, out of the total population over 16 years of age (4,124), 57.1% or 2,355 individuals are in the labor force, with 0.5% or 12 of them unemployed. The age group with the highest labor force participation rate is 30 to 34 years, with 98.2% or 109 individuals in the labor force. Within the labor force, the 55 to 59 years age range has the highest percentage of unemployed individuals, with 3.3% or 12 of them being unemployed.
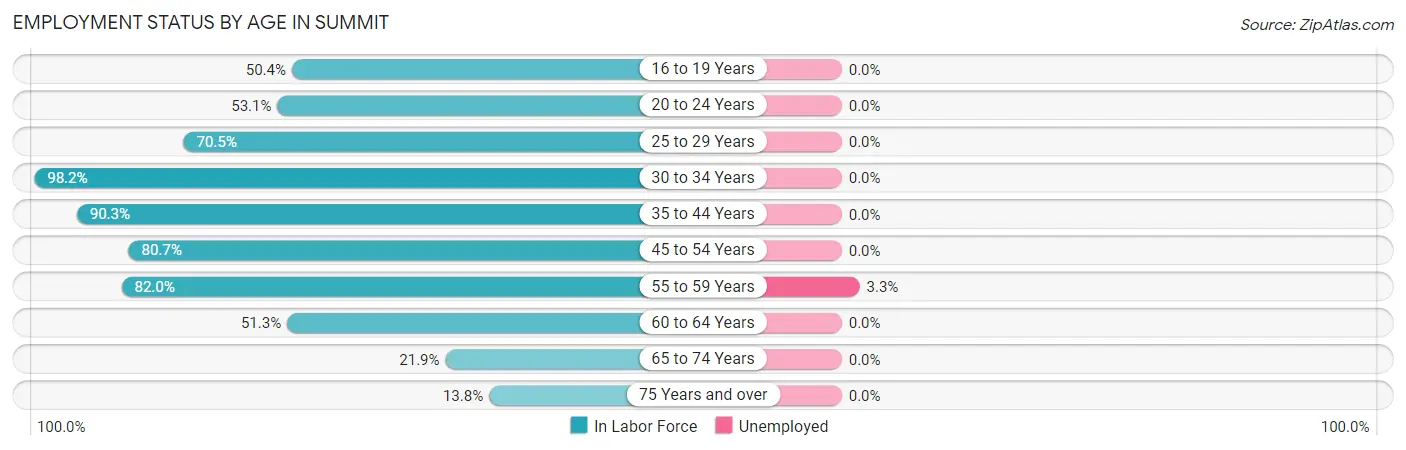
| Age Bracket | In Labor Force | Unemployed |
| 16 to 19 Years | 129 (50.4%) | 0 (0.0%) |
| 20 to 24 Years | 93 (53.1%) | 0 (0.0%) |
| 25 to 29 Years | 117 (70.5%) | 0 (0.0%) |
| 30 to 34 Years | 109 (98.2%) | 0 (0.0%) |
| 35 to 44 Years | 493 (90.3%) | 0 (0.0%) |
| 45 to 54 Years | 496 (80.7%) | 0 (0.0%) |
| 55 to 59 Years | 369 (82.0%) | 12 (3.3%) |
| 60 to 64 Years | 329 (51.3%) | 0 (0.0%) |
| 65 to 74 Years | 158 (21.9%) | 0 (0.0%) |
| 75 Years and over | 61 (13.8%) | 0 (0.0%) |
| Total | 2,355 (57.1%) | 12 (0.5%) |
Employment Status by Educational Attainment in Summit
According to labor force statistics for Summit, 75.6% of individuals (1,912) out of the total population between 25 and 64 years of age (2,529) are in the labor force, with 0.6% or 11 of them being unemployed. The group with the highest labor force participation rate are those with the educational attainment of less than high school, with 94.1% or 32 individuals in the labor force. Within the labor force, individuals with college / associate degree education have the highest percentage of unemployment, with 2.2% or 12 of them being unemployed.
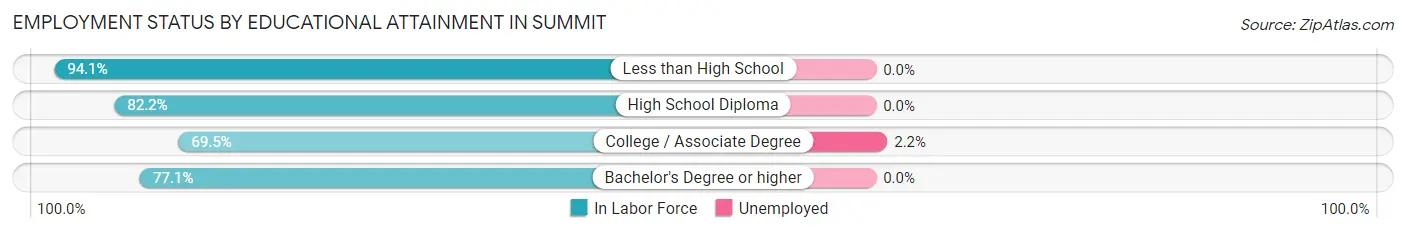
| Educational Attainment | In Labor Force | Unemployed |
| Less than High School | 32 (94.1%) | 0 (0.0%) |
| High School Diploma | 272 (82.2%) | 0 (0.0%) |
| College / Associate Degree | 550 (69.5%) | 17 (2.2%) |
| Bachelor's Degree or higher | 1,059 (77.1%) | 0 (0.0%) |
| Total | 1,912 (75.6%) | 15 (0.6%) |
Employment Occupations by Sex in Summit
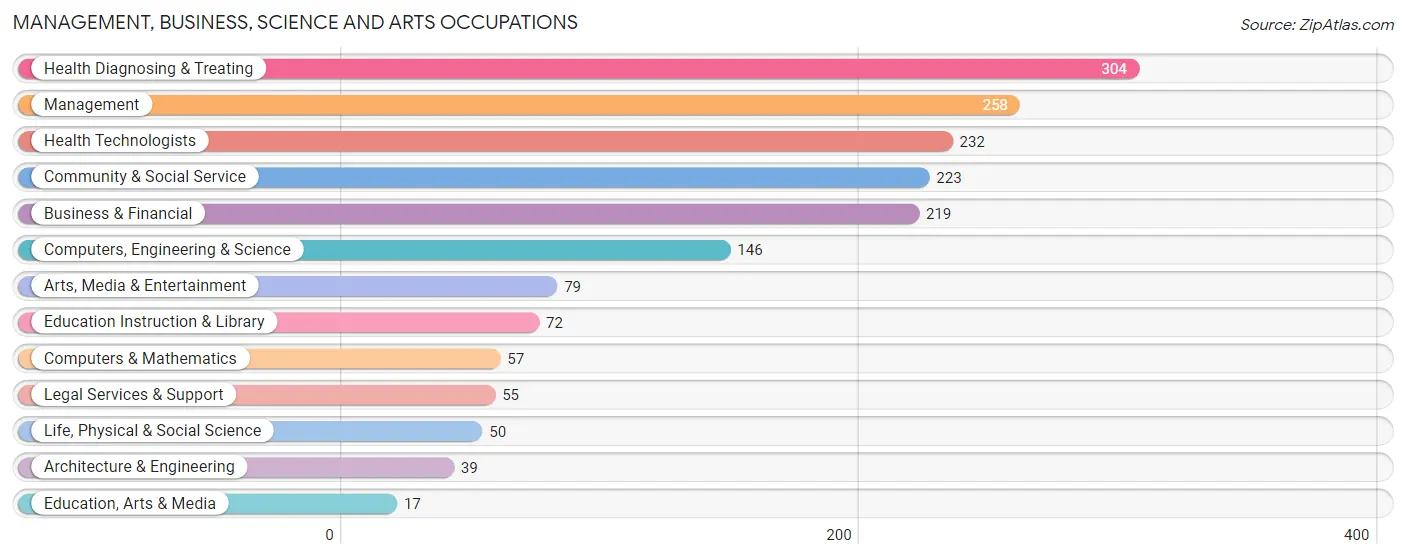
Management, Business, Science and Arts Occupations
The most common Management, Business, Science and Arts occupations in Summit are Health Diagnosing & Treating (304 | 13.0%), Management (258 | 11.0%), Health Technologists (232 | 9.9%), Community & Social Service (223 | 9.5%), and Business & Financial (219 | 9.3%).
Management, Business, Science and Arts Occupations by Sex
Within the Management, Business, Science and Arts occupations in Summit, the most male-oriented occupations are Architecture & Engineering (100.0%), Life, Physical & Social Science (100.0%), and Education, Arts & Media (100.0%), while the most female-oriented occupations are Education Instruction & Library (100.0%), Health Diagnosing & Treating (89.1%), and Health Technologists (85.8%).
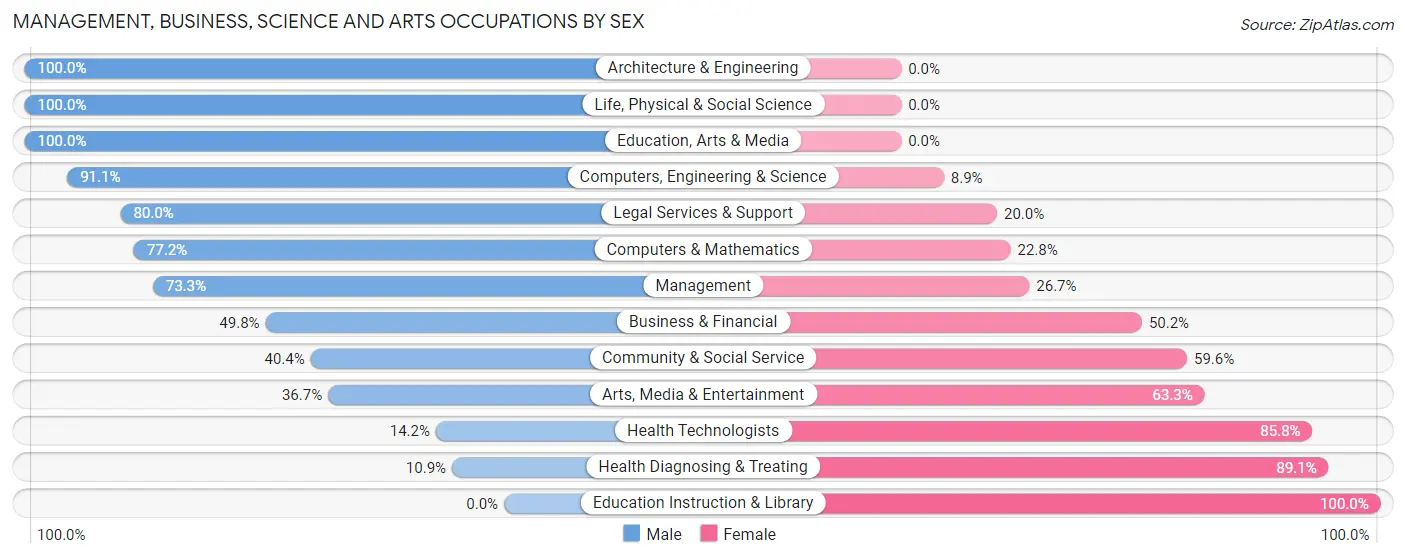
| Occupation | Male | Female |
| Management | 189 (73.3%) | 69 (26.7%) |
| Business & Financial | 109 (49.8%) | 110 (50.2%) |
| Computers, Engineering & Science | 133 (91.1%) | 13 (8.9%) |
| Computers & Mathematics | 44 (77.2%) | 13 (22.8%) |
| Architecture & Engineering | 39 (100.0%) | 0 (0.0%) |
| Life, Physical & Social Science | 50 (100.0%) | 0 (0.0%) |
| Community & Social Service | 90 (40.4%) | 133 (59.6%) |
| Education, Arts & Media | 17 (100.0%) | 0 (0.0%) |
| Legal Services & Support | 44 (80.0%) | 11 (20.0%) |
| Education Instruction & Library | 0 (0.0%) | 72 (100.0%) |
| Arts, Media & Entertainment | 29 (36.7%) | 50 (63.3%) |
| Health Diagnosing & Treating | 33 (10.9%) | 271 (89.1%) |
| Health Technologists | 33 (14.2%) | 199 (85.8%) |
| Total (Category) | 554 (48.2%) | 596 (51.8%) |
| Total (Overall) | 1,360 (58.1%) | 982 (41.9%) |
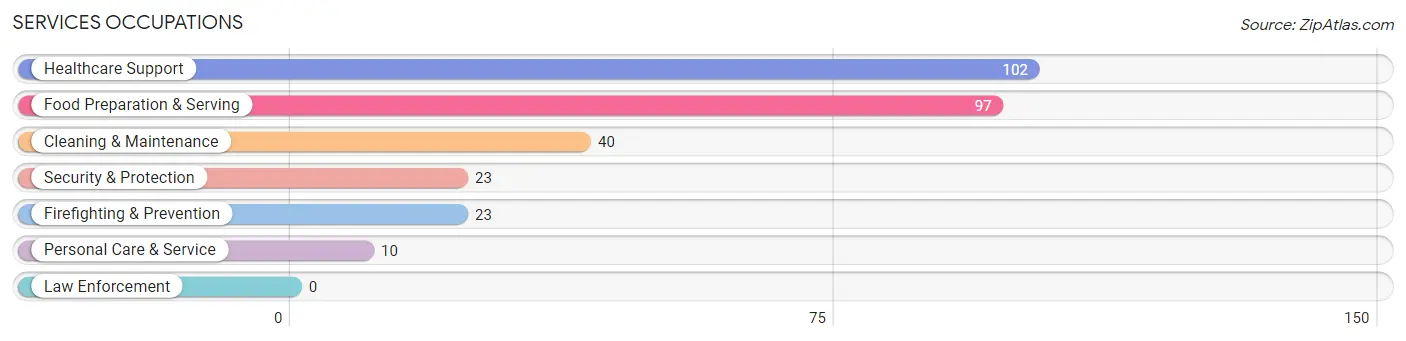
Services Occupations
The most common Services occupations in Summit are Healthcare Support (102 | 4.4%), Food Preparation & Serving (97 | 4.1%), Cleaning & Maintenance (40 | 1.7%), Security & Protection (23 | 1.0%), and Firefighting & Prevention (23 | 1.0%).
Services Occupations by Sex
Within the Services occupations in Summit, the most male-oriented occupations are Security & Protection (100.0%), Firefighting & Prevention (100.0%), and Healthcare Support (55.9%), while the most female-oriented occupations are Personal Care & Service (100.0%), Food Preparation & Serving (48.4%), and Cleaning & Maintenance (47.5%).
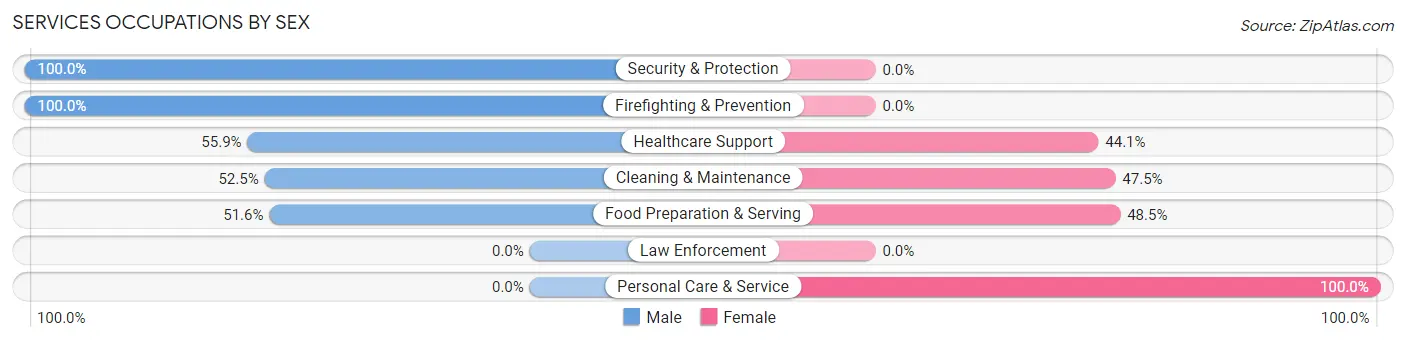
| Occupation | Male | Female |
| Healthcare Support | 57 (55.9%) | 45 (44.1%) |
| Security & Protection | 23 (100.0%) | 0 (0.0%) |
| Firefighting & Prevention | 23 (100.0%) | 0 (0.0%) |
| Law Enforcement | 0 (0.0%) | 0 (0.0%) |
| Food Preparation & Serving | 50 (51.5%) | 47 (48.4%) |
| Cleaning & Maintenance | 21 (52.5%) | 19 (47.5%) |
| Personal Care & Service | 0 (0.0%) | 10 (100.0%) |
| Total (Category) | 151 (55.5%) | 121 (44.5%) |
| Total (Overall) | 1,360 (58.1%) | 982 (41.9%) |
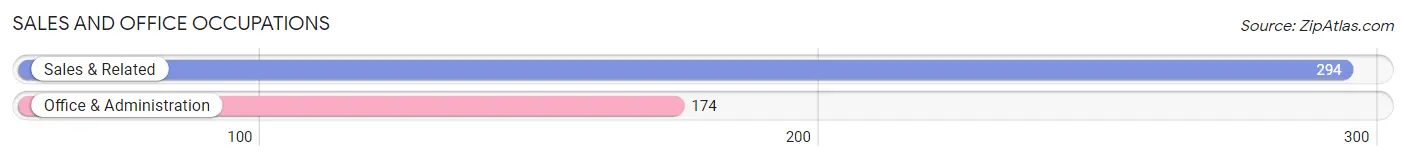
Sales and Office Occupations
The most common Sales and Office occupations in Summit are Sales & Related (294 | 12.6%), and Office & Administration (174 | 7.4%).
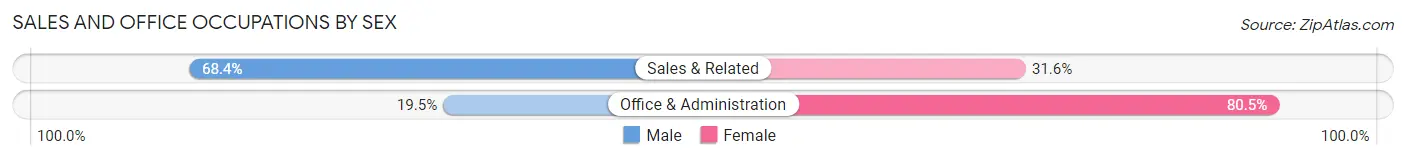
Sales and Office Occupations by Sex
| Occupation | Male | Female |
| Sales & Related | 201 (68.4%) | 93 (31.6%) |
| Office & Administration | 34 (19.5%) | 140 (80.5%) |
| Total (Category) | 235 (50.2%) | 233 (49.8%) |
| Total (Overall) | 1,360 (58.1%) | 982 (41.9%) |
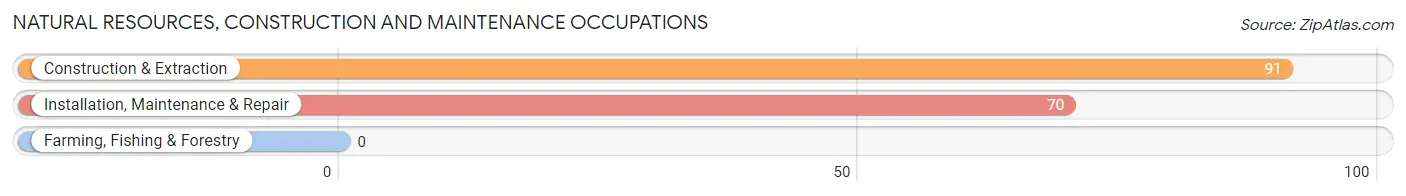
Natural Resources, Construction and Maintenance Occupations
The most common Natural Resources, Construction and Maintenance occupations in Summit are Construction & Extraction (91 | 3.9%), and Installation, Maintenance & Repair (70 | 3.0%).
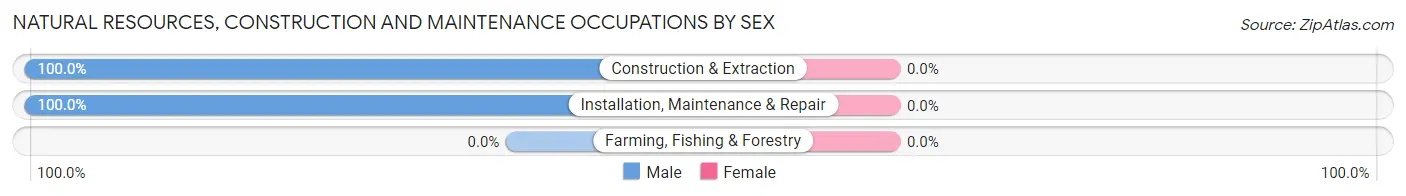
Natural Resources, Construction and Maintenance Occupations by Sex
| Occupation | Male | Female |
| Farming, Fishing & Forestry | 0 (0.0%) | 0 (0.0%) |
| Construction & Extraction | 91 (100.0%) | 0 (0.0%) |
| Installation, Maintenance & Repair | 70 (100.0%) | 0 (0.0%) |
| Total (Category) | 161 (100.0%) | 0 (0.0%) |
| Total (Overall) | 1,360 (58.1%) | 982 (41.9%) |
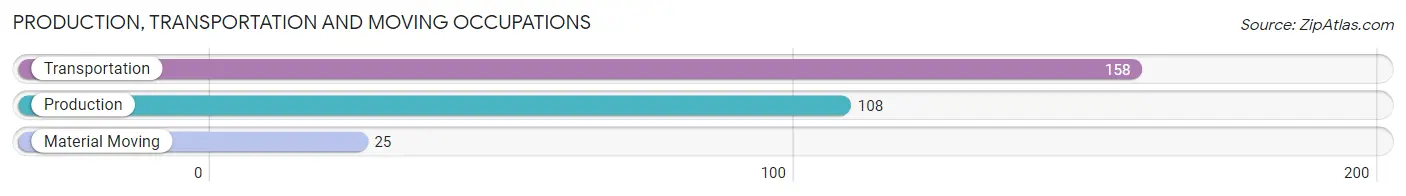
Production, Transportation and Moving Occupations
The most common Production, Transportation and Moving occupations in Summit are Transportation (158 | 6.8%), Production (108 | 4.6%), and Material Moving (25 | 1.1%).
Production, Transportation and Moving Occupations by Sex
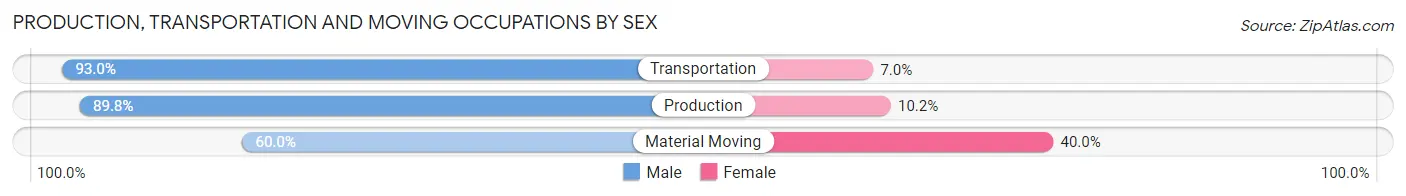
| Occupation | Male | Female |
| Production | 97 (89.8%) | 11 (10.2%) |
| Transportation | 147 (93.0%) | 11 (7.0%) |
| Material Moving | 15 (60.0%) | 10 (40.0%) |
| Total (Category) | 259 (89.0%) | 32 (11.0%) |
| Total (Overall) | 1,360 (58.1%) | 982 (41.9%) |
Employment Industries by Sex in Summit
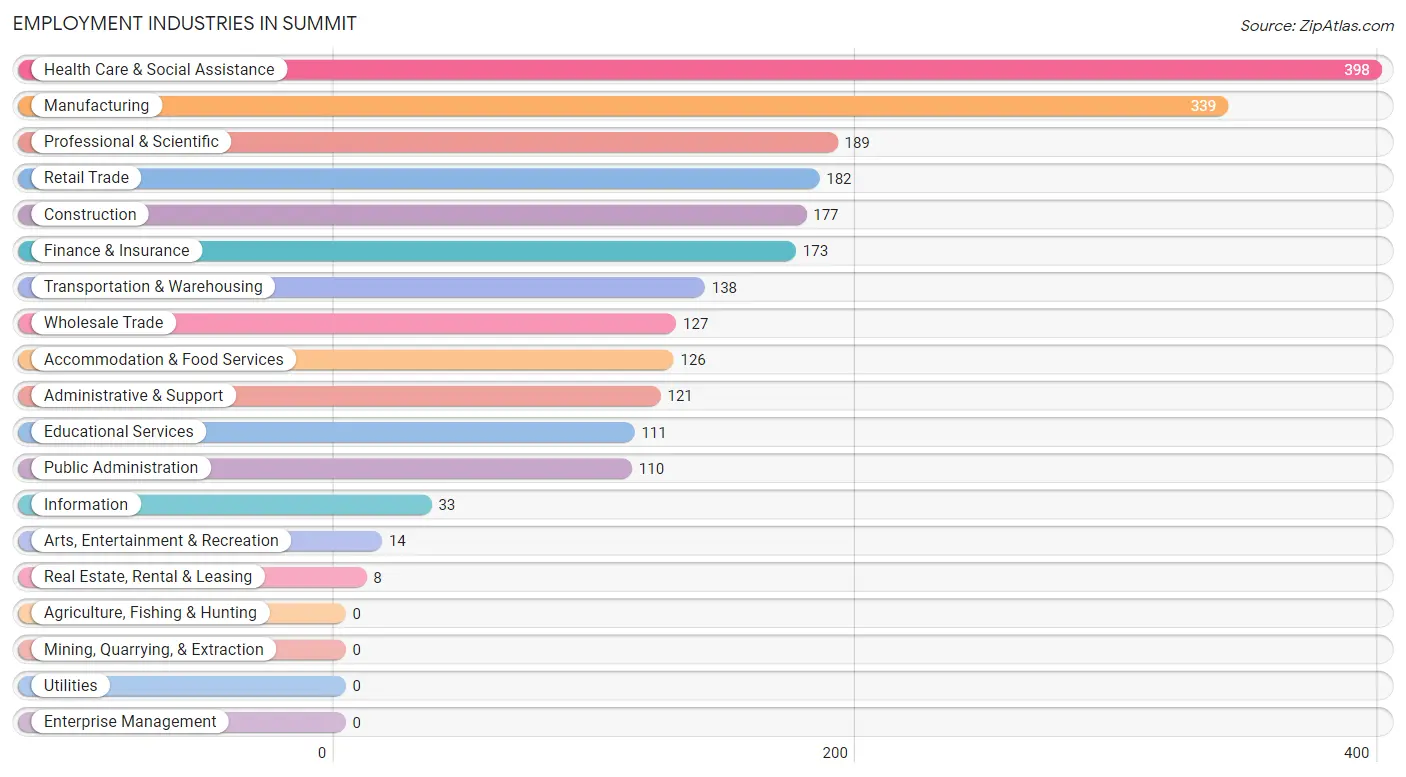
Employment Industries in Summit
The major employment industries in Summit include Health Care & Social Assistance (398 | 17.0%), Manufacturing (339 | 14.5%), Professional & Scientific (189 | 8.1%), Retail Trade (182 | 7.8%), and Construction (177 | 7.6%).
Employment Industries by Sex in Summit
The Summit industries that see more men than women are Construction (100.0%), Real Estate, Rental & Leasing (100.0%), and Arts, Entertainment & Recreation (100.0%), whereas the industries that tend to have a higher number of women are Health Care & Social Assistance (77.1%), Educational Services (76.6%), and Finance & Insurance (66.5%).
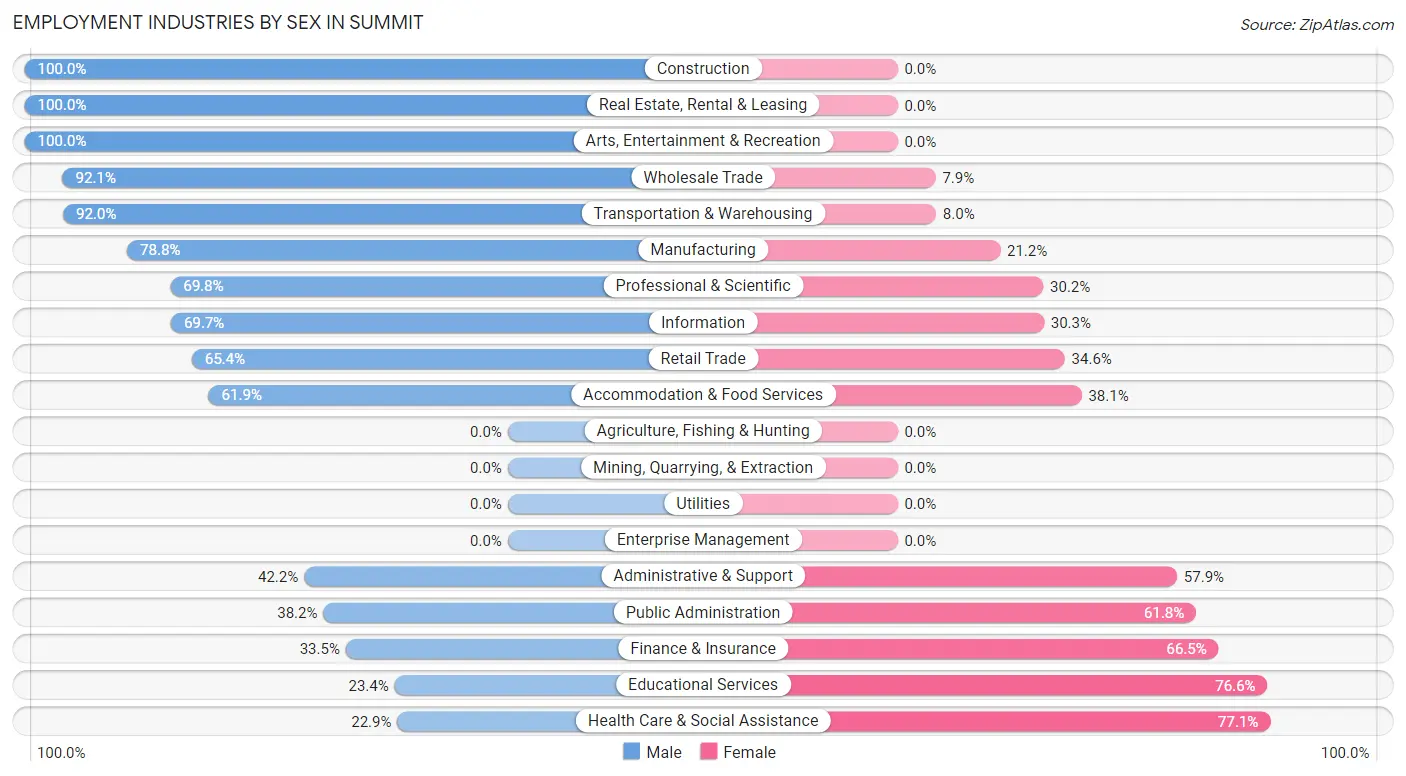
| Industry | Male | Female |
| Agriculture, Fishing & Hunting | 0 (0.0%) | 0 (0.0%) |
| Mining, Quarrying, & Extraction | 0 (0.0%) | 0 (0.0%) |
| Construction | 177 (100.0%) | 0 (0.0%) |
| Manufacturing | 267 (78.8%) | 72 (21.2%) |
| Wholesale Trade | 117 (92.1%) | 10 (7.9%) |
| Retail Trade | 119 (65.4%) | 63 (34.6%) |
| Transportation & Warehousing | 127 (92.0%) | 11 (8.0%) |
| Utilities | 0 (0.0%) | 0 (0.0%) |
| Information | 23 (69.7%) | 10 (30.3%) |
| Finance & Insurance | 58 (33.5%) | 115 (66.5%) |
| Real Estate, Rental & Leasing | 8 (100.0%) | 0 (0.0%) |
| Professional & Scientific | 132 (69.8%) | 57 (30.2%) |
| Enterprise Management | 0 (0.0%) | 0 (0.0%) |
| Administrative & Support | 51 (42.1%) | 70 (57.9%) |
| Educational Services | 26 (23.4%) | 85 (76.6%) |
| Health Care & Social Assistance | 91 (22.9%) | 307 (77.1%) |
| Arts, Entertainment & Recreation | 14 (100.0%) | 0 (0.0%) |
| Accommodation & Food Services | 78 (61.9%) | 48 (38.1%) |
| Public Administration | 42 (38.2%) | 68 (61.8%) |
| Total | 1,360 (58.1%) | 982 (41.9%) |
Education in Summit
School Enrollment in Summit
The most common levels of schooling among the 1,263 students in Summit are college / undergraduate (352 | 27.9%), high school (276 | 21.8%), and middle school (250 | 19.8%).
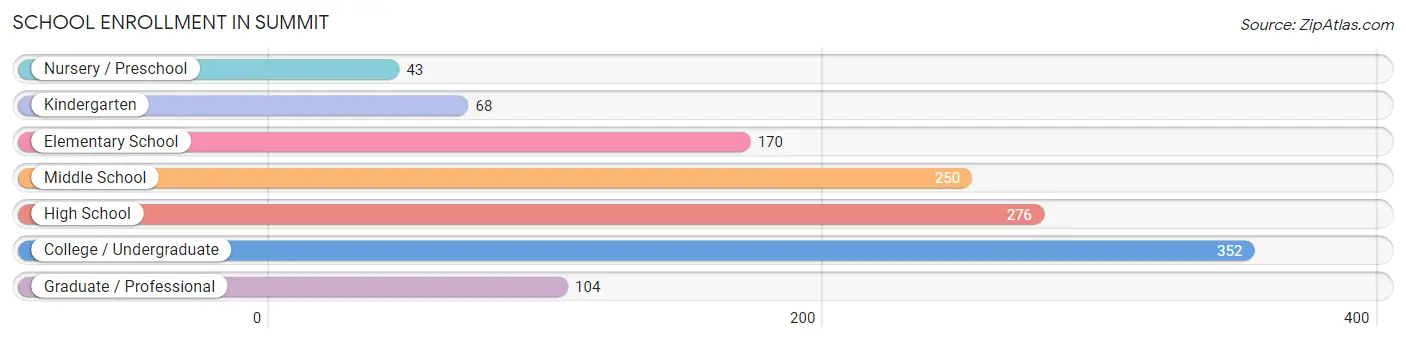
| School Level | # Students | % Students |
| Nursery / Preschool | 43 | 3.4% |
| Kindergarten | 68 | 5.4% |
| Elementary School | 170 | 13.5% |
| Middle School | 250 | 19.8% |
| High School | 276 | 21.8% |
| College / Undergraduate | 352 | 27.9% |
| Graduate / Professional | 104 | 8.2% |
| Total | 1,263 | 100.0% |
School Enrollment by Age by Funding Source in Summit
Out of a total of 1,263 students who are enrolled in schools in Summit, 258 (20.4%) attend a private institution, while the remaining 1,005 (79.6%) are enrolled in public schools. The age group of 10 to 14 year olds has the highest likelihood of being enrolled in private schools, with 90 (32.5% in the age bracket) enrolled. Conversely, the age group of 35 years and over has the lowest likelihood of being enrolled in a private school, with 228 (100.0% in the age bracket) attending a public institution.
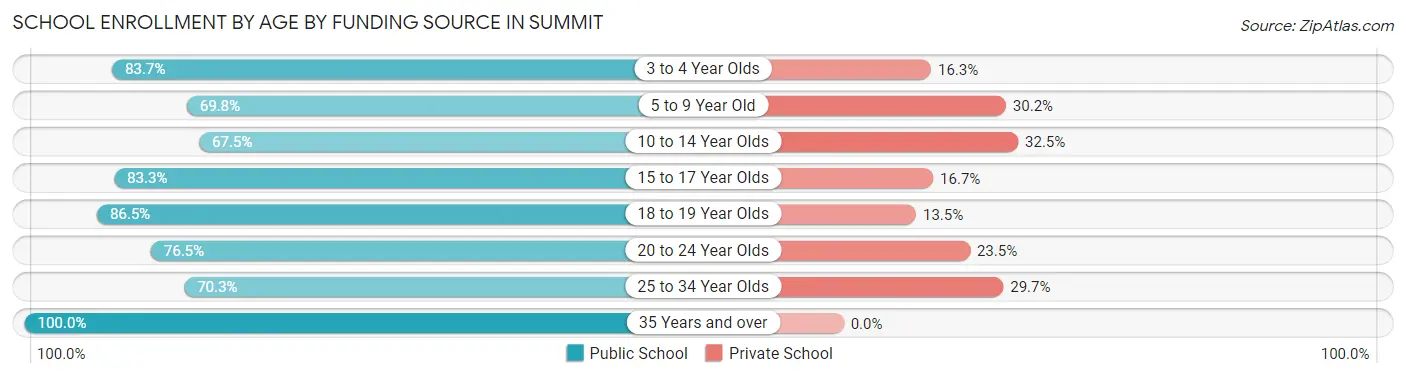
| Age Bracket | Public School | Private School |
| 3 to 4 Year Olds | 36 (83.7%) | 7 (16.3%) |
| 5 to 9 Year Old | 157 (69.8%) | 68 (30.2%) |
| 10 to 14 Year Olds | 187 (67.5%) | 90 (32.5%) |
| 15 to 17 Year Olds | 190 (83.3%) | 38 (16.7%) |
| 18 to 19 Year Olds | 77 (86.5%) | 12 (13.5%) |
| 20 to 24 Year Olds | 104 (76.5%) | 32 (23.5%) |
| 25 to 34 Year Olds | 26 (70.3%) | 11 (29.7%) |
| 35 Years and over | 228 (100.0%) | 0 (0.0%) |
| Total | 1,005 (79.6%) | 258 (20.4%) |
Educational Attainment by Field of Study in Summit
Science & technology (460 | 21.7%), business (362 | 17.1%), education (239 | 11.3%), engineering (190 | 9.0%), and social sciences (189 | 8.9%) are the most common fields of study among 2,115 individuals in Summit who have obtained a bachelor's degree or higher.
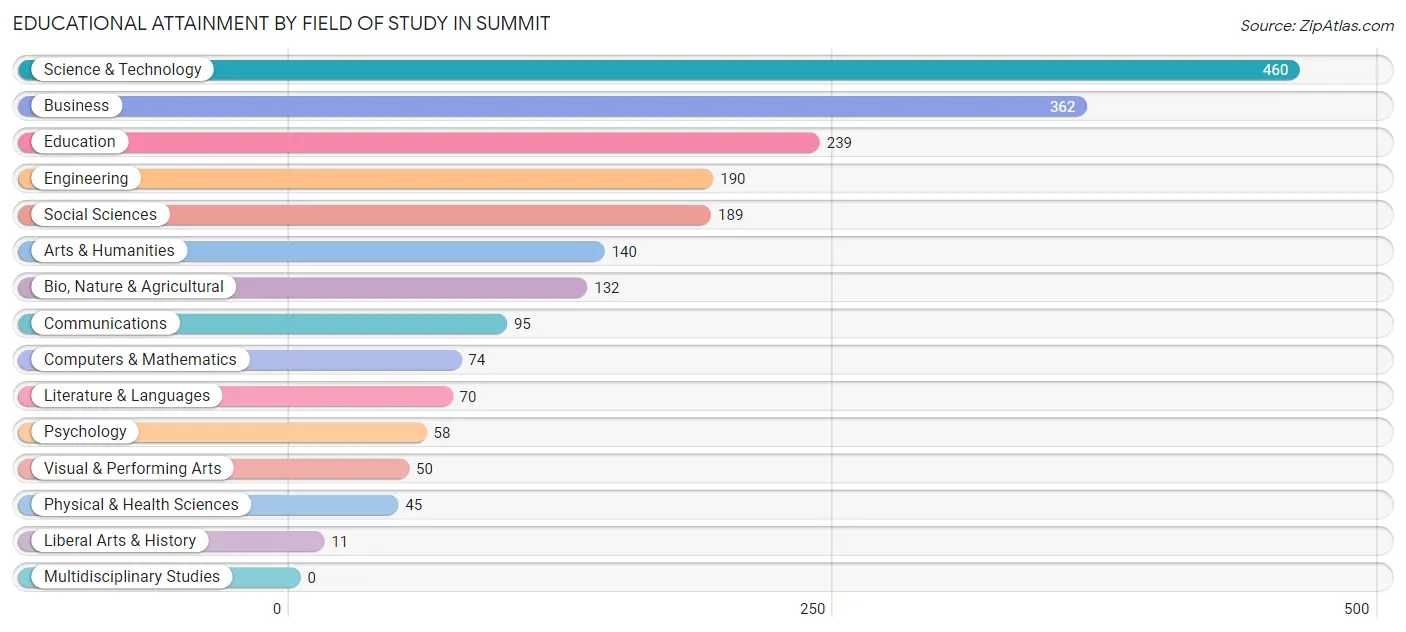
| Field of Study | # Graduates | % Graduates |
| Computers & Mathematics | 74 | 3.5% |
| Bio, Nature & Agricultural | 132 | 6.2% |
| Physical & Health Sciences | 45 | 2.1% |
| Psychology | 58 | 2.7% |
| Social Sciences | 189 | 8.9% |
| Engineering | 190 | 9.0% |
| Multidisciplinary Studies | 0 | 0.0% |
| Science & Technology | 460 | 21.7% |
| Business | 362 | 17.1% |
| Education | 239 | 11.3% |
| Literature & Languages | 70 | 3.3% |
| Liberal Arts & History | 11 | 0.5% |
| Visual & Performing Arts | 50 | 2.4% |
| Communications | 95 | 4.5% |
| Arts & Humanities | 140 | 6.6% |
| Total | 2,115 | 100.0% |
Transportation & Commute in Summit
Vehicle Availability by Sex in Summit
The most prevalent vehicle ownership categories in Summit are males with 2 vehicles (532, accounting for 40.9%) and females with 2 vehicles (356, making up 57.2%).
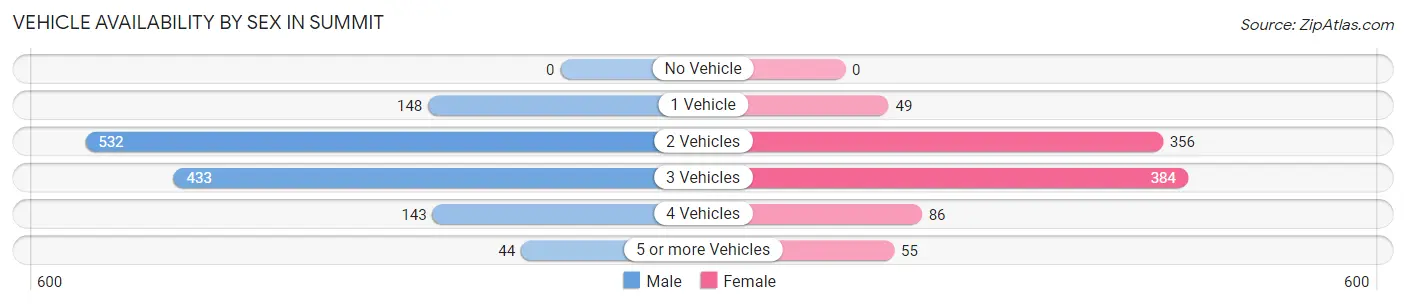
| Vehicles Available | Male | Female |
| No Vehicle | 0 (0.0%) | 0 (0.0%) |
| 1 Vehicle | 148 (11.4%) | 49 (5.3%) |
| 2 Vehicles | 532 (40.9%) | 356 (38.3%) |
| 3 Vehicles | 433 (33.3%) | 384 (41.3%) |
| 4 Vehicles | 143 (11.0%) | 86 (9.2%) |
| 5 or more Vehicles | 44 (3.4%) | 55 (5.9%) |
| Total | 1,300 (100.0%) | 930 (100.0%) |
Commute Time in Summit
The most frequently occuring commute durations in Summit are 20 to 24 minutes (334 commuters, 16.8%), 30 to 34 minutes (290 commuters, 14.6%), and 15 to 19 minutes (259 commuters, 13.0%).
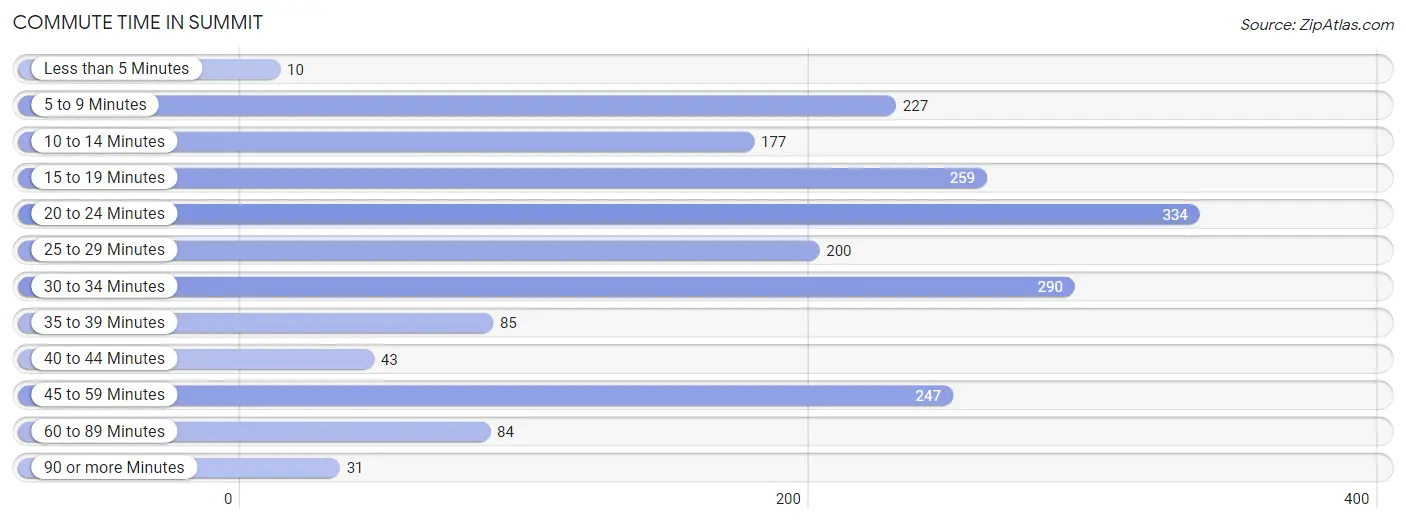
| Commute Time | # Commuters | % Commuters |
| Less than 5 Minutes | 10 | 0.5% |
| 5 to 9 Minutes | 227 | 11.4% |
| 10 to 14 Minutes | 177 | 8.9% |
| 15 to 19 Minutes | 259 | 13.0% |
| 20 to 24 Minutes | 334 | 16.8% |
| 25 to 29 Minutes | 200 | 10.1% |
| 30 to 34 Minutes | 290 | 14.6% |
| 35 to 39 Minutes | 85 | 4.3% |
| 40 to 44 Minutes | 43 | 2.2% |
| 45 to 59 Minutes | 247 | 12.4% |
| 60 to 89 Minutes | 84 | 4.2% |
| 90 or more Minutes | 31 | 1.6% |
Commute Time by Sex in Summit
The most common commute times in Summit are 45 to 59 minutes (212 commuters, 17.9%) for males and 20 to 24 minutes (180 commuters, 22.5%) for females.
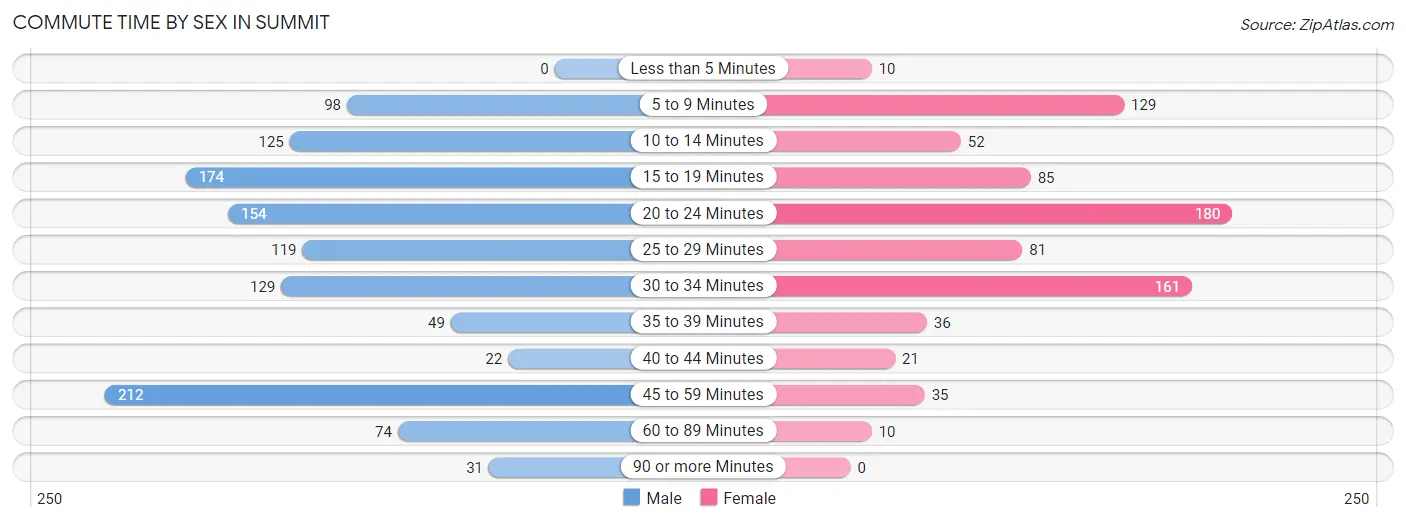
| Commute Time | Male | Female |
| Less than 5 Minutes | 0 (0.0%) | 10 (1.3%) |
| 5 to 9 Minutes | 98 (8.3%) | 129 (16.1%) |
| 10 to 14 Minutes | 125 (10.5%) | 52 (6.5%) |
| 15 to 19 Minutes | 174 (14.7%) | 85 (10.6%) |
| 20 to 24 Minutes | 154 (13.0%) | 180 (22.5%) |
| 25 to 29 Minutes | 119 (10.0%) | 81 (10.1%) |
| 30 to 34 Minutes | 129 (10.9%) | 161 (20.1%) |
| 35 to 39 Minutes | 49 (4.1%) | 36 (4.5%) |
| 40 to 44 Minutes | 22 (1.8%) | 21 (2.6%) |
| 45 to 59 Minutes | 212 (17.9%) | 35 (4.4%) |
| 60 to 89 Minutes | 74 (6.2%) | 10 (1.3%) |
| 90 or more Minutes | 31 (2.6%) | 0 (0.0%) |
Time of Departure to Work by Sex in Summit
The most frequent times of departure to work in Summit are 7:00 AM to 7:29 AM (346, 29.1%) for males and 8:00 AM to 8:29 AM (190, 23.7%) for females.
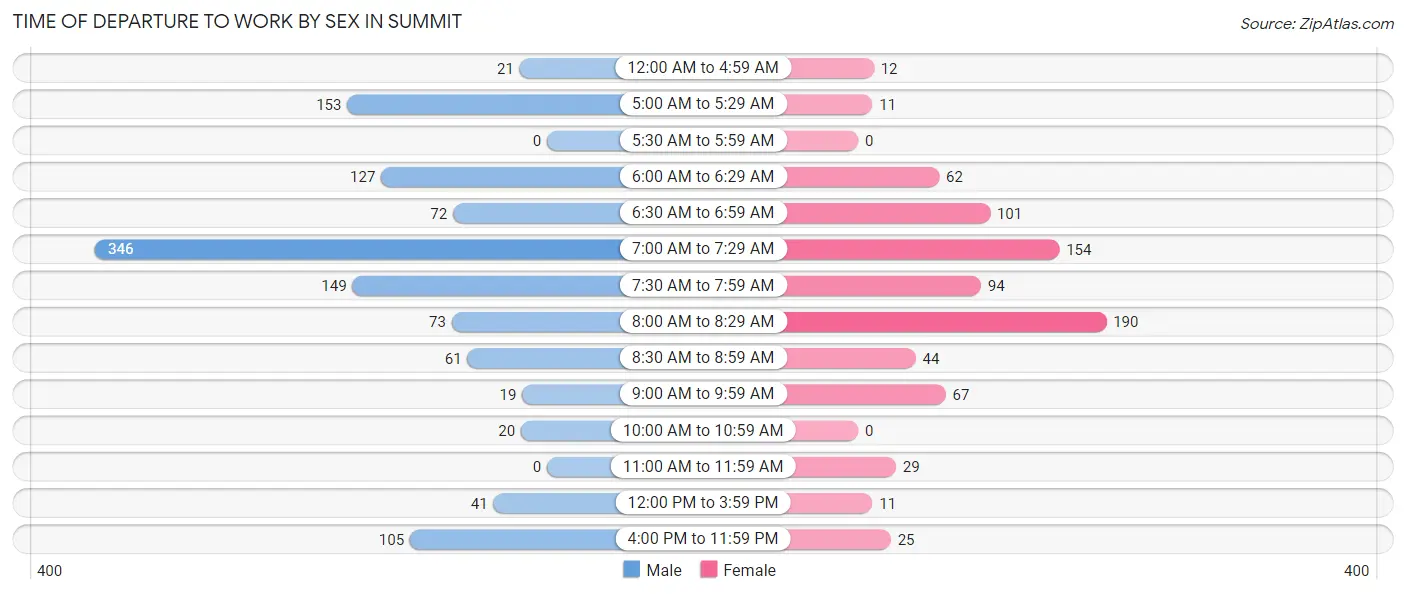
| Time of Departure | Male | Female |
| 12:00 AM to 4:59 AM | 21 (1.8%) | 12 (1.5%) |
| 5:00 AM to 5:29 AM | 153 (12.9%) | 11 (1.4%) |
| 5:30 AM to 5:59 AM | 0 (0.0%) | 0 (0.0%) |
| 6:00 AM to 6:29 AM | 127 (10.7%) | 62 (7.7%) |
| 6:30 AM to 6:59 AM | 72 (6.1%) | 101 (12.6%) |
| 7:00 AM to 7:29 AM | 346 (29.1%) | 154 (19.3%) |
| 7:30 AM to 7:59 AM | 149 (12.6%) | 94 (11.7%) |
| 8:00 AM to 8:29 AM | 73 (6.1%) | 190 (23.7%) |
| 8:30 AM to 8:59 AM | 61 (5.1%) | 44 (5.5%) |
| 9:00 AM to 9:59 AM | 19 (1.6%) | 67 (8.4%) |
| 10:00 AM to 10:59 AM | 20 (1.7%) | 0 (0.0%) |
| 11:00 AM to 11:59 AM | 0 (0.0%) | 29 (3.6%) |
| 12:00 PM to 3:59 PM | 41 (3.5%) | 11 (1.4%) |
| 4:00 PM to 11:59 PM | 105 (8.8%) | 25 (3.1%) |
| Total | 1,187 (100.0%) | 800 (100.0%) |
Housing Occupancy in Summit
Occupancy by Ownership in Summit
Of the total 1,893 dwellings in Summit, owner-occupied units account for 1,723 (91.0%), while renter-occupied units make up 170 (9.0%).
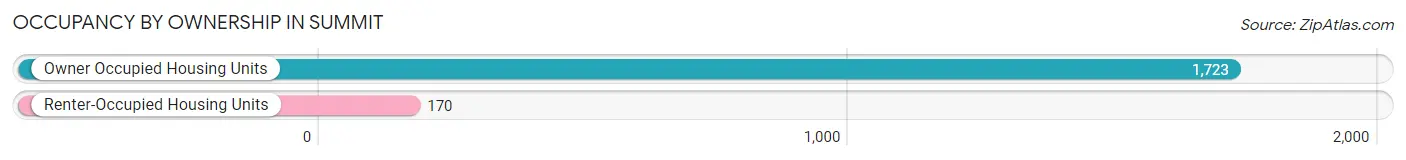
| Occupancy | # Housing Units | % Housing Units |
| Owner Occupied Housing Units | 1,723 | 91.0% |
| Renter-Occupied Housing Units | 170 | 9.0% |
| Total Occupied Housing Units | 1,893 | 100.0% |
Occupancy by Household Size in Summit
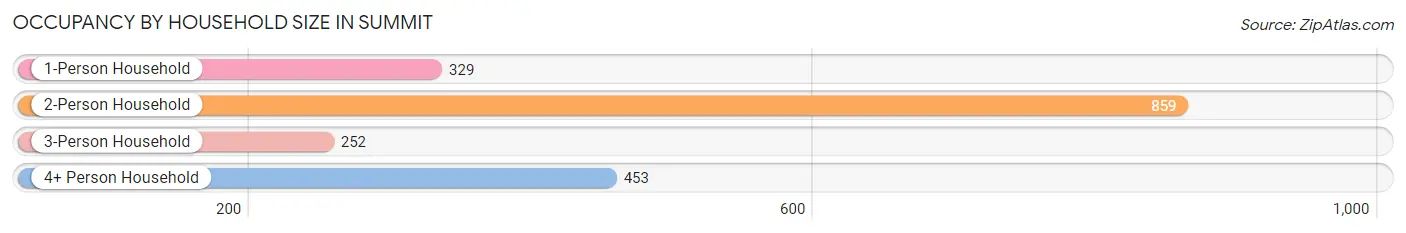
| Household Size | # Housing Units | % Housing Units |
| 1-Person Household | 329 | 17.4% |
| 2-Person Household | 859 | 45.4% |
| 3-Person Household | 252 | 13.3% |
| 4+ Person Household | 453 | 23.9% |
| Total Housing Units | 1,893 | 100.0% |
Occupancy by Ownership by Household Size in Summit
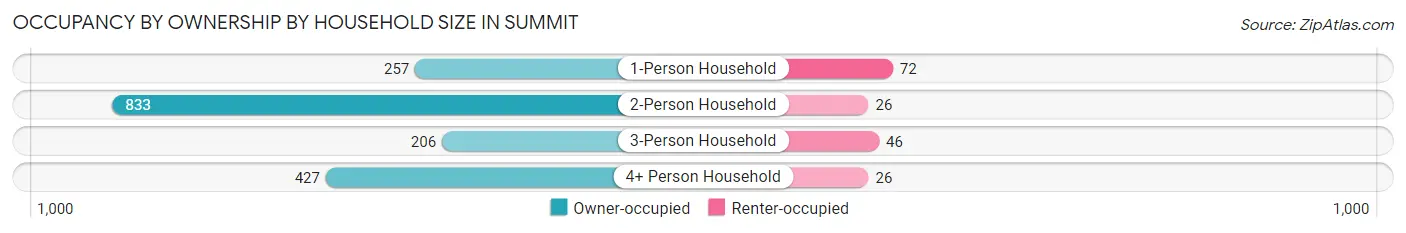
| Household Size | Owner-occupied | Renter-occupied |
| 1-Person Household | 257 (78.1%) | 72 (21.9%) |
| 2-Person Household | 833 (97.0%) | 26 (3.0%) |
| 3-Person Household | 206 (81.8%) | 46 (18.2%) |
| 4+ Person Household | 427 (94.3%) | 26 (5.7%) |
| Total Housing Units | 1,723 (91.0%) | 170 (9.0%) |
Occupancy by Educational Attainment in Summit
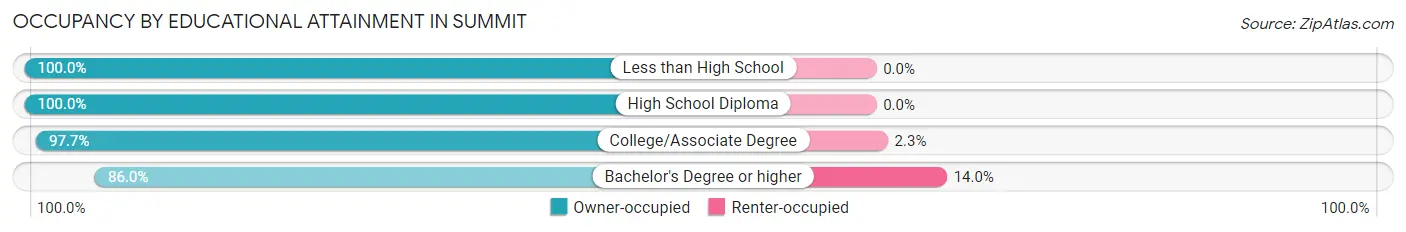
| Household Size | Owner-occupied | Renter-occupied |
| Less than High School | 27 (100.0%) | 0 (0.0%) |
| High School Diploma | 210 (100.0%) | 0 (0.0%) |
| College/Associate Degree | 514 (97.7%) | 12 (2.3%) |
| Bachelor's Degree or higher | 972 (86.0%) | 158 (14.0%) |
Occupancy by Age of Householder in Summit
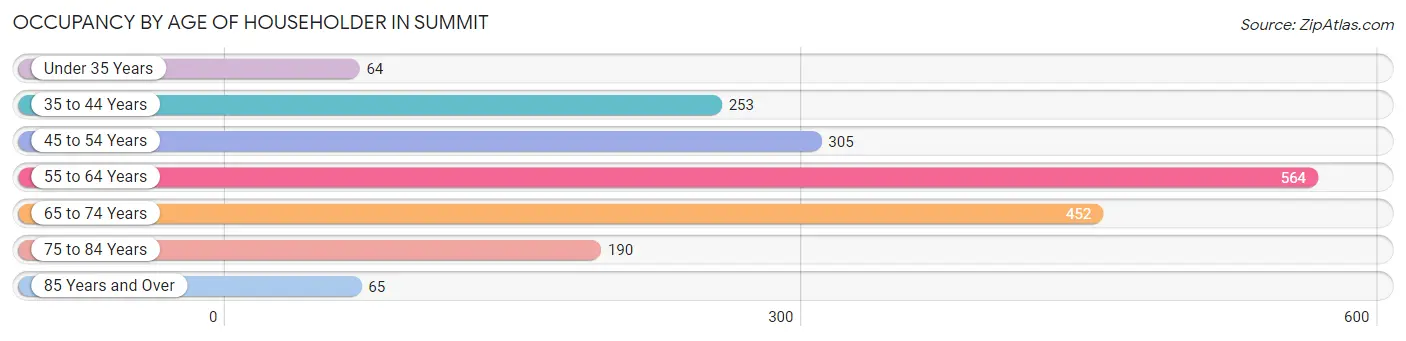
| Age Bracket | # Households | % Households |
| Under 35 Years | 64 | 3.4% |
| 35 to 44 Years | 253 | 13.4% |
| 45 to 54 Years | 305 | 16.1% |
| 55 to 64 Years | 564 | 29.8% |
| 65 to 74 Years | 452 | 23.9% |
| 75 to 84 Years | 190 | 10.0% |
| 85 Years and Over | 65 | 3.4% |
| Total | 1,893 | 100.0% |
Housing Finances in Summit
Median Income by Occupancy in Summit
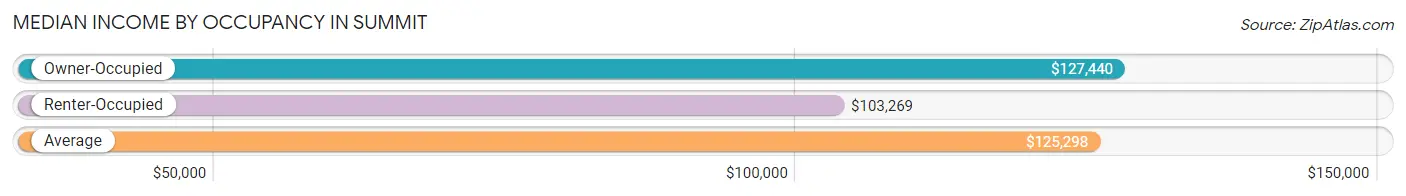
| Occupancy Type | # Households | Median Income |
| Owner-Occupied | 1,723 (91.0%) | $127,440 |
| Renter-Occupied | 170 (9.0%) | $103,269 |
| Average | 1,893 (100.0%) | $125,298 |
Occupancy by Householder Income Bracket in Summit
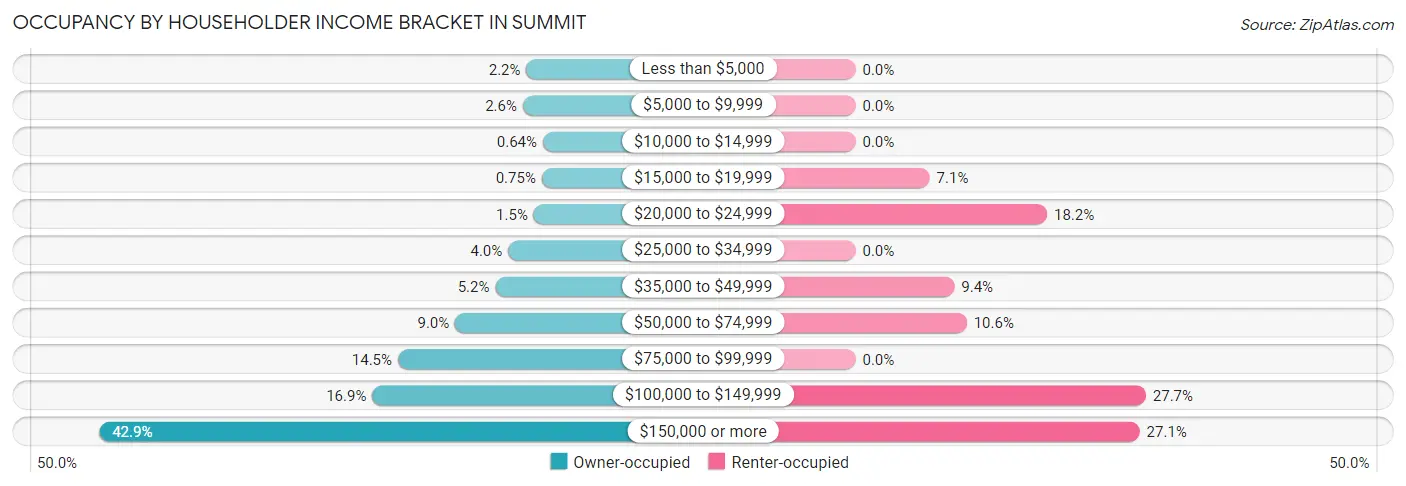
| Income Bracket | Owner-occupied | Renter-occupied |
| Less than $5,000 | 38 (2.2%) | 0 (0.0%) |
| $5,000 to $9,999 | 44 (2.5%) | 0 (0.0%) |
| $10,000 to $14,999 | 11 (0.6%) | 0 (0.0%) |
| $15,000 to $19,999 | 13 (0.7%) | 12 (7.1%) |
| $20,000 to $24,999 | 26 (1.5%) | 31 (18.2%) |
| $25,000 to $34,999 | 68 (4.0%) | 0 (0.0%) |
| $35,000 to $49,999 | 89 (5.2%) | 16 (9.4%) |
| $50,000 to $74,999 | 155 (9.0%) | 18 (10.6%) |
| $75,000 to $99,999 | 249 (14.4%) | 0 (0.0%) |
| $100,000 to $149,999 | 291 (16.9%) | 47 (27.7%) |
| $150,000 or more | 739 (42.9%) | 46 (27.1%) |
| Total | 1,723 (100.0%) | 170 (100.0%) |
Monthly Housing Cost Tiers in Summit
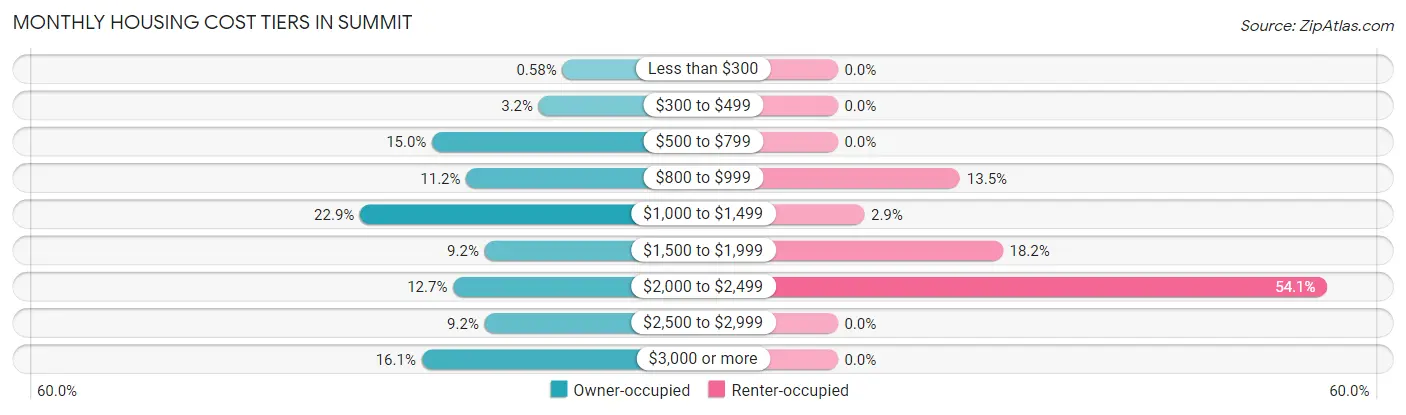
| Monthly Cost | Owner-occupied | Renter-occupied |
| Less than $300 | 10 (0.6%) | 0 (0.0%) |
| $300 to $499 | 55 (3.2%) | 0 (0.0%) |
| $500 to $799 | 258 (15.0%) | 0 (0.0%) |
| $800 to $999 | 193 (11.2%) | 23 (13.5%) |
| $1,000 to $1,499 | 395 (22.9%) | 5 (2.9%) |
| $1,500 to $1,999 | 158 (9.2%) | 31 (18.2%) |
| $2,000 to $2,499 | 218 (12.7%) | 92 (54.1%) |
| $2,500 to $2,999 | 158 (9.2%) | 0 (0.0%) |
| $3,000 or more | 278 (16.1%) | 0 (0.0%) |
| Total | 1,723 (100.0%) | 170 (100.0%) |
Physical Housing Characteristics in Summit
Housing Structures in Summit
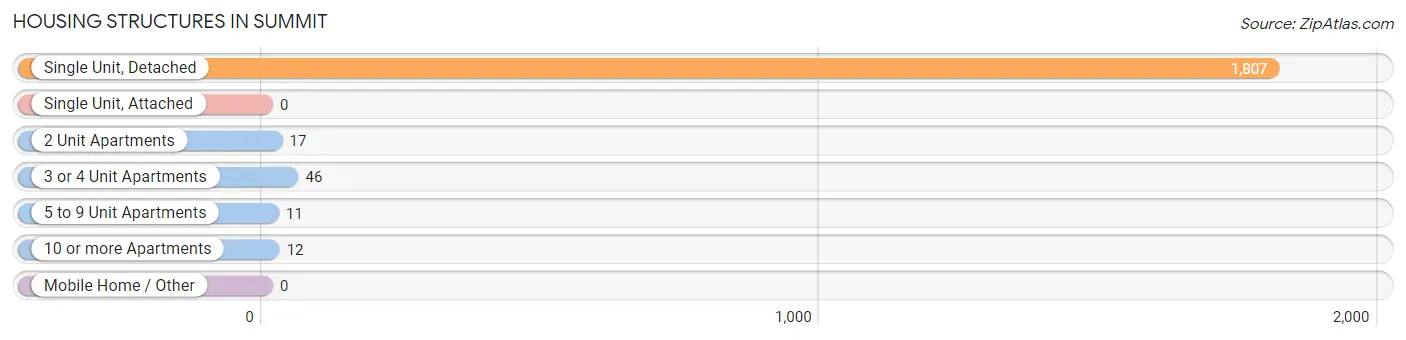
| Structure Type | # Housing Units | % Housing Units |
| Single Unit, Detached | 1,807 | 95.5% |
| Single Unit, Attached | 0 | 0.0% |
| 2 Unit Apartments | 17 | 0.9% |
| 3 or 4 Unit Apartments | 46 | 2.4% |
| 5 to 9 Unit Apartments | 11 | 0.6% |
| 10 or more Apartments | 12 | 0.6% |
| Mobile Home / Other | 0 | 0.0% |
| Total | 1,893 | 100.0% |
Housing Structures by Occupancy in Summit
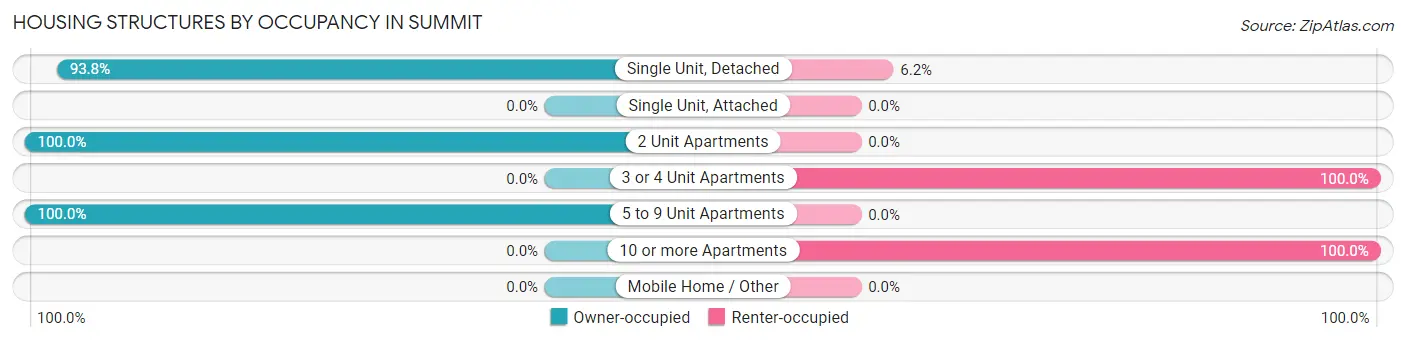
| Structure Type | Owner-occupied | Renter-occupied |
| Single Unit, Detached | 1,695 (93.8%) | 112 (6.2%) |
| Single Unit, Attached | 0 (0.0%) | 0 (0.0%) |
| 2 Unit Apartments | 17 (100.0%) | 0 (0.0%) |
| 3 or 4 Unit Apartments | 0 (0.0%) | 46 (100.0%) |
| 5 to 9 Unit Apartments | 11 (100.0%) | 0 (0.0%) |
| 10 or more Apartments | 0 (0.0%) | 12 (100.0%) |
| Mobile Home / Other | 0 (0.0%) | 0 (0.0%) |
| Total | 1,723 (91.0%) | 170 (9.0%) |
Housing Structures by Number of Rooms in Summit
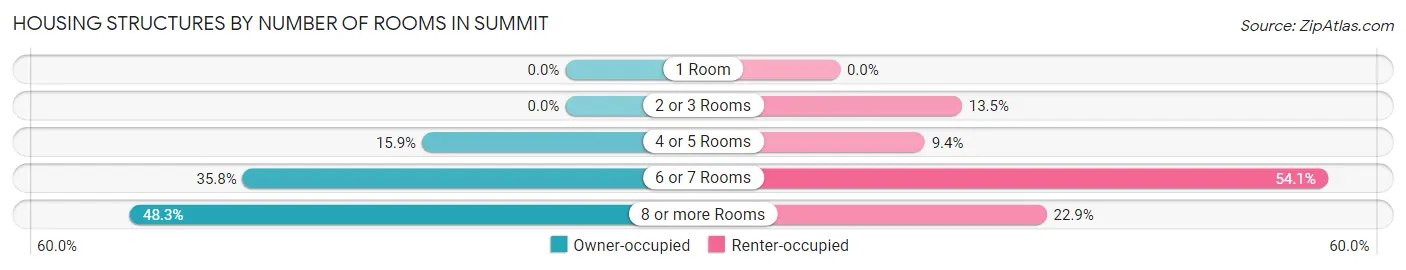
| Number of Rooms | Owner-occupied | Renter-occupied |
| 1 Room | 0 (0.0%) | 0 (0.0%) |
| 2 or 3 Rooms | 0 (0.0%) | 23 (13.5%) |
| 4 or 5 Rooms | 274 (15.9%) | 16 (9.4%) |
| 6 or 7 Rooms | 617 (35.8%) | 92 (54.1%) |
| 8 or more Rooms | 832 (48.3%) | 39 (22.9%) |
| Total | 1,723 (100.0%) | 170 (100.0%) |
Housing Structure by Heating Type in Summit
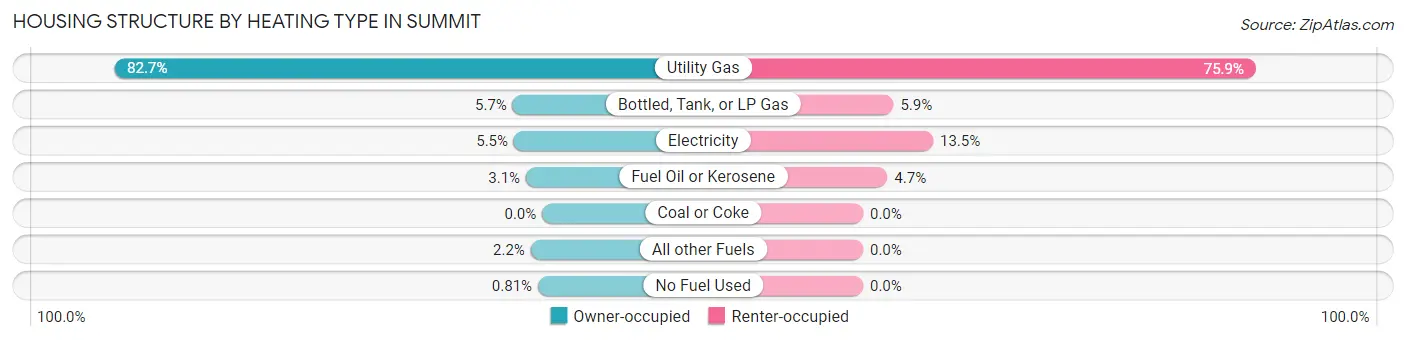
| Heating Type | Owner-occupied | Renter-occupied |
| Utility Gas | 1,425 (82.7%) | 129 (75.9%) |
| Bottled, Tank, or LP Gas | 98 (5.7%) | 10 (5.9%) |
| Electricity | 94 (5.5%) | 23 (13.5%) |
| Fuel Oil or Kerosene | 54 (3.1%) | 8 (4.7%) |
| Coal or Coke | 0 (0.0%) | 0 (0.0%) |
| All other Fuels | 38 (2.2%) | 0 (0.0%) |
| No Fuel Used | 14 (0.8%) | 0 (0.0%) |
| Total | 1,723 (100.0%) | 170 (100.0%) |
Household Vehicle Usage in Summit
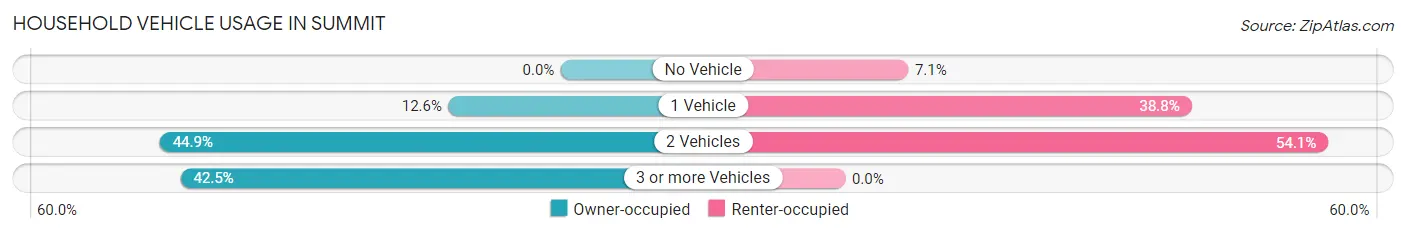
| Vehicles per Household | Owner-occupied | Renter-occupied |
| No Vehicle | 0 (0.0%) | 12 (7.1%) |
| 1 Vehicle | 217 (12.6%) | 66 (38.8%) |
| 2 Vehicles | 773 (44.9%) | 92 (54.1%) |
| 3 or more Vehicles | 733 (42.5%) | 0 (0.0%) |
| Total | 1,723 (100.0%) | 170 (100.0%) |
Real Estate & Mortgages in Summit
Real Estate and Mortgage Overview in Summit
| Characteristic | Without Mortgage | With Mortgage |
| Housing Units | 728 | 995 |
| Median Property Value | $532,300 | $468,500 |
| Median Household Income | $103,816 | $495 |
| Monthly Housing Costs | $926 | $264 |
| Real Estate Taxes | $6,348 | $0 |
Property Value by Mortgage Status in Summit
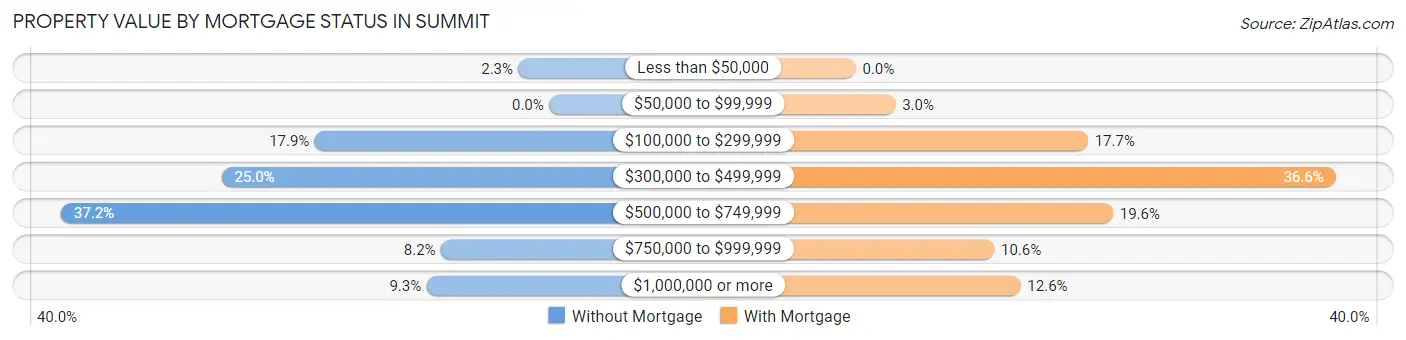
| Property Value | Without Mortgage | With Mortgage |
| Less than $50,000 | 17 (2.3%) | 0 (0.0%) |
| $50,000 to $99,999 | 0 (0.0%) | 30 (3.0%) |
| $100,000 to $299,999 | 130 (17.9%) | 176 (17.7%) |
| $300,000 to $499,999 | 182 (25.0%) | 364 (36.6%) |
| $500,000 to $749,999 | 271 (37.2%) | 195 (19.6%) |
| $750,000 to $999,999 | 60 (8.2%) | 105 (10.5%) |
| $1,000,000 or more | 68 (9.3%) | 125 (12.6%) |
| Total | 728 (100.0%) | 995 (100.0%) |
Household Income by Mortgage Status in Summit
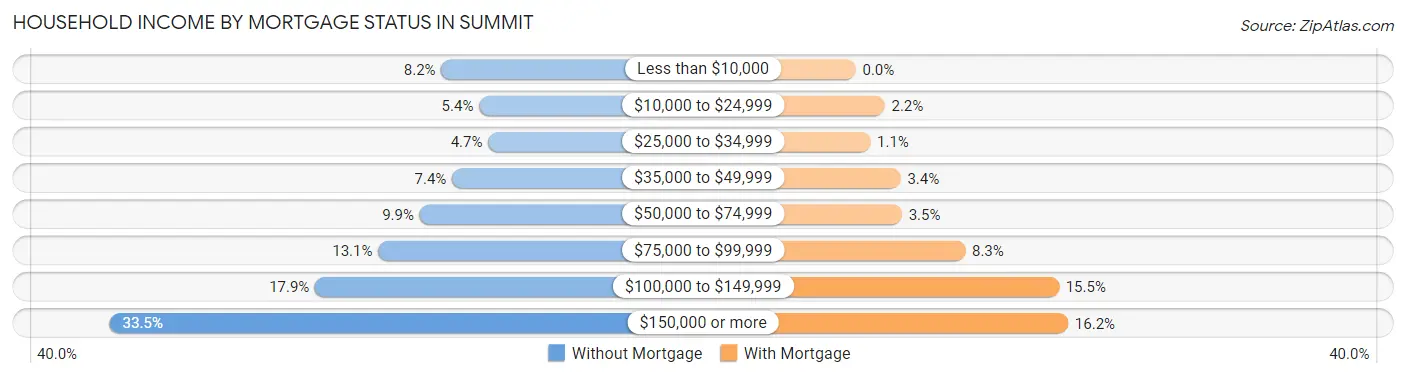
| Household Income | Without Mortgage | With Mortgage |
| Less than $10,000 | 60 (8.2%) | 0 (0.0%) |
| $10,000 to $24,999 | 39 (5.4%) | 22 (2.2%) |
| $25,000 to $34,999 | 34 (4.7%) | 11 (1.1%) |
| $35,000 to $49,999 | 54 (7.4%) | 34 (3.4%) |
| $50,000 to $74,999 | 72 (9.9%) | 35 (3.5%) |
| $75,000 to $99,999 | 95 (13.1%) | 83 (8.3%) |
| $100,000 to $149,999 | 130 (17.9%) | 154 (15.5%) |
| $150,000 or more | 244 (33.5%) | 161 (16.2%) |
| Total | 728 (100.0%) | 995 (100.0%) |
Property Value to Household Income Ratio in Summit
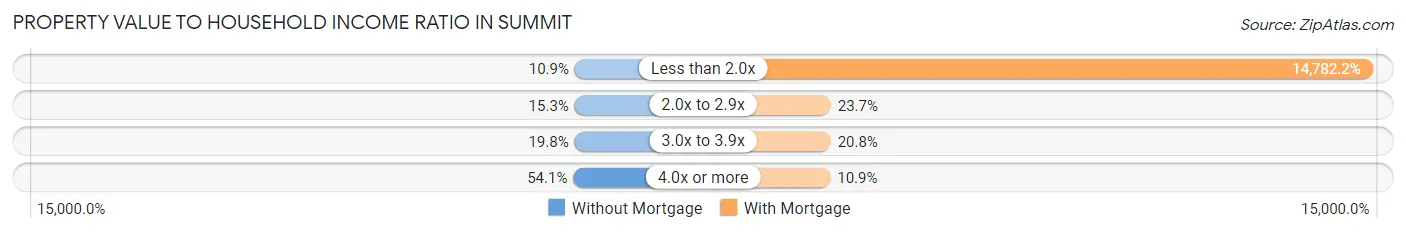
| Value-to-Income Ratio | Without Mortgage | With Mortgage |
| Less than 2.0x | 79 (10.8%) | 147,083 (14,782.2%) |
| 2.0x to 2.9x | 111 (15.2%) | 236 (23.7%) |
| 3.0x to 3.9x | 144 (19.8%) | 207 (20.8%) |
| 4.0x or more | 394 (54.1%) | 108 (10.8%) |
| Total | 728 (100.0%) | 995 (100.0%) |
Real Estate Taxes by Mortgage Status in Summit
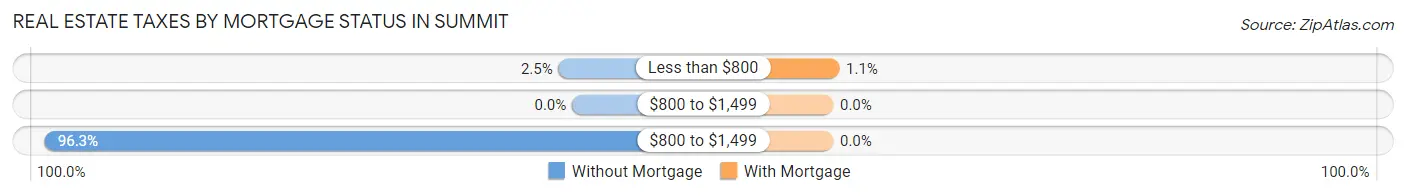
| Property Taxes | Without Mortgage | With Mortgage |
| Less than $800 | 18 (2.5%) | 11 (1.1%) |
| $800 to $1,499 | 0 (0.0%) | 0 (0.0%) |
| $800 to $1,499 | 701 (96.3%) | 0 (0.0%) |
| Total | 728 (100.0%) | 995 (100.0%) |
Health & Disability in Summit
Health Insurance Coverage by Age in Summit
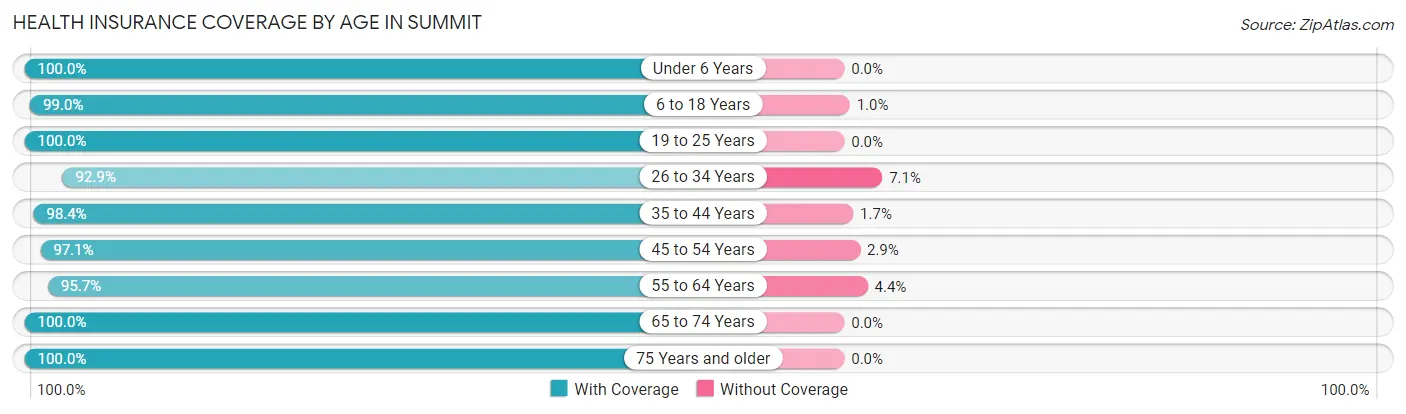
| Age Bracket | With Coverage | Without Coverage |
| Under 6 Years | 286 (100.0%) | 0 (0.0%) |
| 6 to 18 Years | 687 (99.0%) | 7 (1.0%) |
| 19 to 25 Years | 266 (100.0%) | 0 (0.0%) |
| 26 to 34 Years | 184 (92.9%) | 14 (7.1%) |
| 35 to 44 Years | 537 (98.4%) | 9 (1.7%) |
| 45 to 54 Years | 596 (97.1%) | 18 (2.9%) |
| 55 to 64 Years | 1,034 (95.7%) | 47 (4.3%) |
| 65 to 74 Years | 723 (100.0%) | 0 (0.0%) |
| 75 Years and older | 427 (100.0%) | 0 (0.0%) |
| Total | 4,740 (98.0%) | 95 (2.0%) |
Health Insurance Coverage by Citizenship Status in Summit
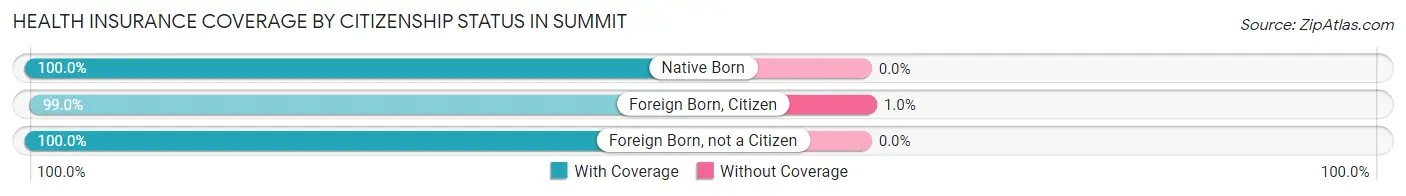
| Citizenship Status | With Coverage | Without Coverage |
| Native Born | 286 (100.0%) | 0 (0.0%) |
| Foreign Born, Citizen | 687 (99.0%) | 7 (1.0%) |
| Foreign Born, not a Citizen | 266 (100.0%) | 0 (0.0%) |
Health Insurance Coverage by Household Income in Summit
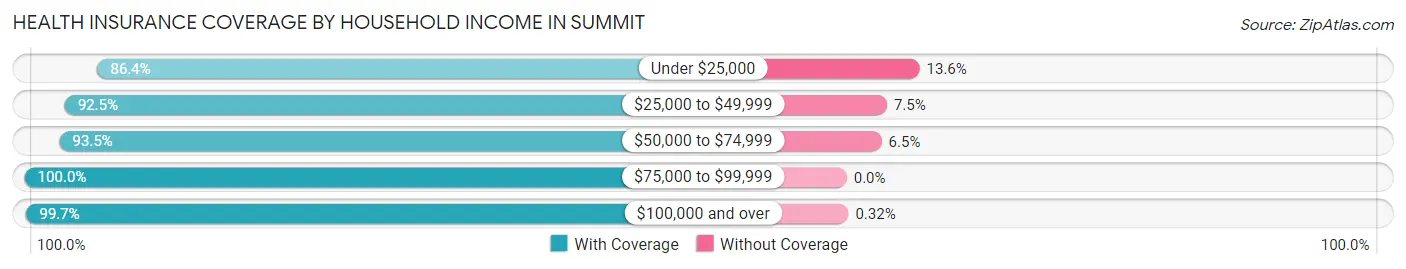
| Household Income | With Coverage | Without Coverage |
| Under $25,000 | 247 (86.4%) | 39 (13.6%) |
| $25,000 to $49,999 | 258 (92.5%) | 21 (7.5%) |
| $50,000 to $74,999 | 329 (93.5%) | 23 (6.5%) |
| $75,000 to $99,999 | 507 (100.0%) | 0 (0.0%) |
| $100,000 and over | 3,394 (99.7%) | 11 (0.3%) |
Public vs Private Health Insurance Coverage by Age in Summit
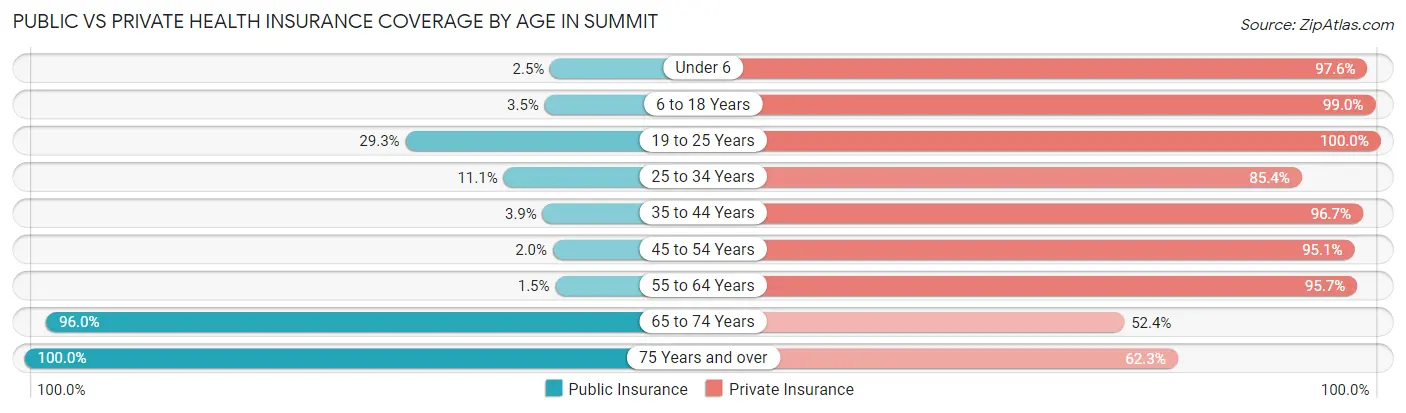
| Age Bracket | Public Insurance | Private Insurance |
| Under 6 | 7 (2.5%) | 279 (97.6%) |
| 6 to 18 Years | 24 (3.5%) | 687 (99.0%) |
| 19 to 25 Years | 78 (29.3%) | 266 (100.0%) |
| 25 to 34 Years | 22 (11.1%) | 169 (85.4%) |
| 35 to 44 Years | 21 (3.8%) | 528 (96.7%) |
| 45 to 54 Years | 12 (1.9%) | 584 (95.1%) |
| 55 to 64 Years | 16 (1.5%) | 1,034 (95.7%) |
| 65 to 74 Years | 694 (96.0%) | 379 (52.4%) |
| 75 Years and over | 427 (100.0%) | 266 (62.3%) |
| Total | 1,301 (26.9%) | 4,192 (86.7%) |
Disability Status by Sex by Age in Summit
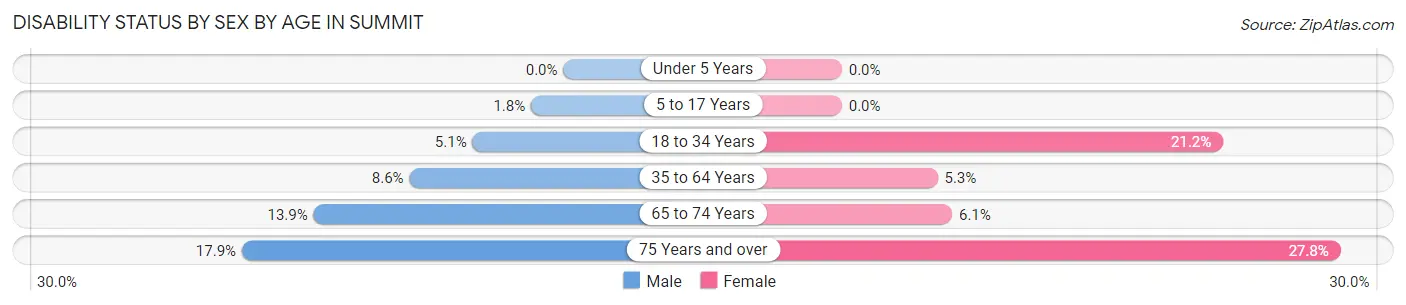
| Age Bracket | Male | Female |
| Under 5 Years | 0 (0.0%) | 0 (0.0%) |
| 5 to 17 Years | 7 (1.8%) | 0 (0.0%) |
| 18 to 34 Years | 20 (5.1%) | 31 (21.2%) |
| 35 to 64 Years | 94 (8.6%) | 61 (5.3%) |
| 65 to 74 Years | 53 (13.9%) | 21 (6.1%) |
| 75 Years and over | 41 (17.9%) | 55 (27.8%) |
Disability Class by Sex by Age in Summit
Disability Class: Hearing Difficulty
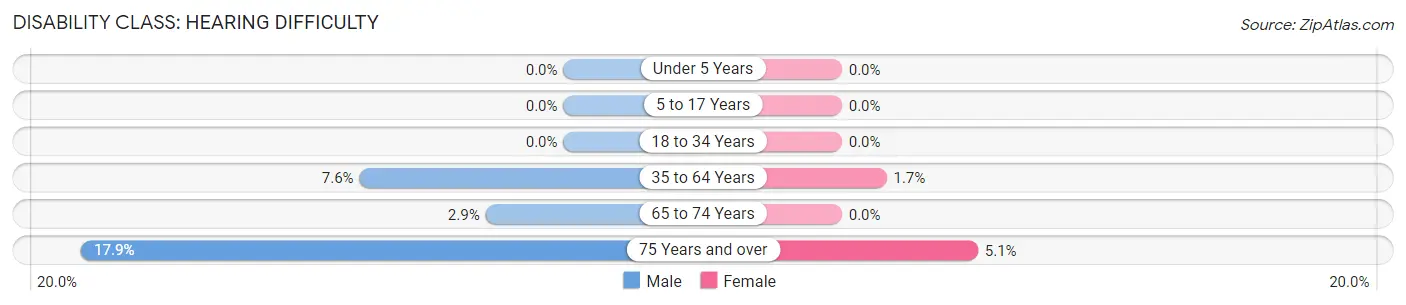
| Age Bracket | Male | Female |
| Under 5 Years | 0 (0.0%) | 0 (0.0%) |
| 5 to 17 Years | 0 (0.0%) | 0 (0.0%) |
| 18 to 34 Years | 0 (0.0%) | 0 (0.0%) |
| 35 to 64 Years | 83 (7.6%) | 19 (1.7%) |
| 65 to 74 Years | 11 (2.9%) | 0 (0.0%) |
| 75 Years and over | 41 (17.9%) | 10 (5.1%) |
Disability Class: Vision Difficulty
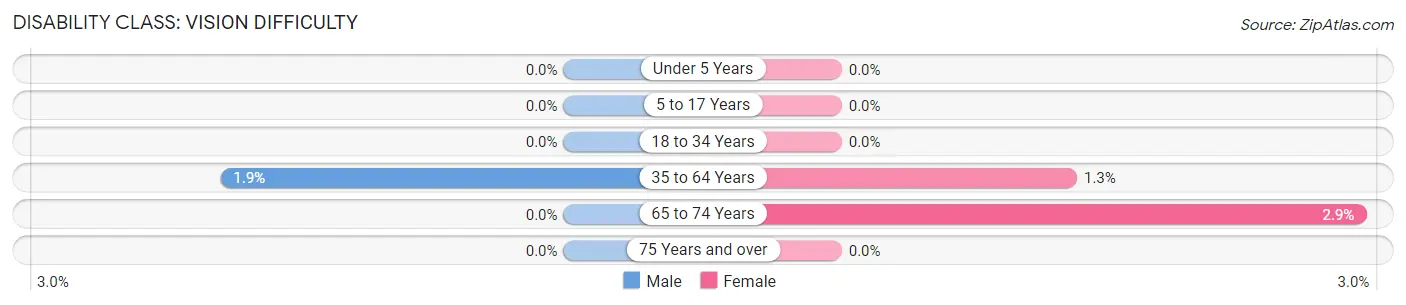
| Age Bracket | Male | Female |
| Under 5 Years | 0 (0.0%) | 0 (0.0%) |
| 5 to 17 Years | 0 (0.0%) | 0 (0.0%) |
| 18 to 34 Years | 0 (0.0%) | 0 (0.0%) |
| 35 to 64 Years | 21 (1.9%) | 15 (1.3%) |
| 65 to 74 Years | 0 (0.0%) | 10 (2.9%) |
| 75 Years and over | 0 (0.0%) | 0 (0.0%) |
Disability Class: Cognitive Difficulty
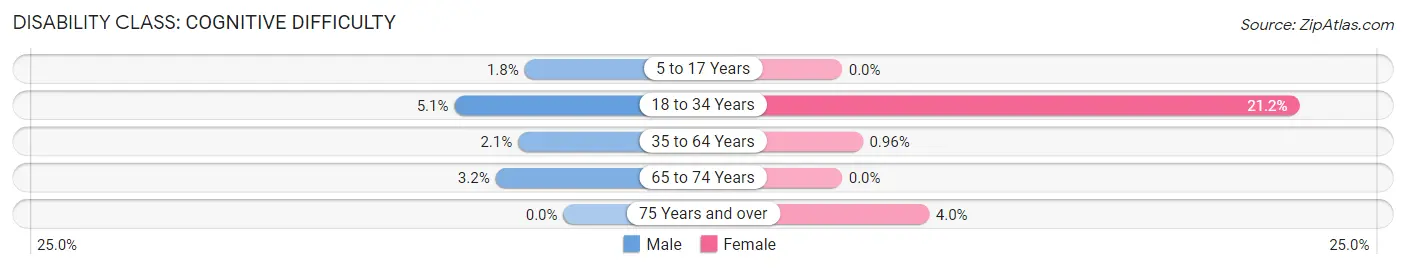
| Age Bracket | Male | Female |
| 5 to 17 Years | 7 (1.8%) | 0 (0.0%) |
| 18 to 34 Years | 20 (5.1%) | 31 (21.2%) |
| 35 to 64 Years | 23 (2.1%) | 11 (1.0%) |
| 65 to 74 Years | 12 (3.2%) | 0 (0.0%) |
| 75 Years and over | 0 (0.0%) | 8 (4.0%) |
Disability Class: Ambulatory Difficulty
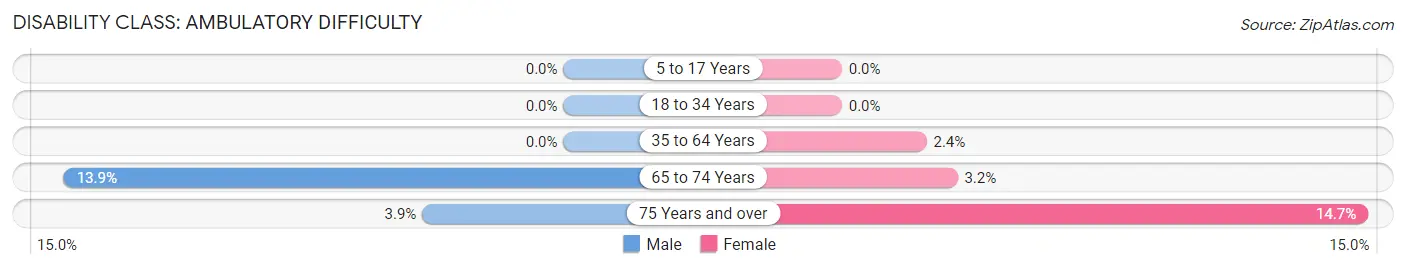
| Age Bracket | Male | Female |
| 5 to 17 Years | 0 (0.0%) | 0 (0.0%) |
| 18 to 34 Years | 0 (0.0%) | 0 (0.0%) |
| 35 to 64 Years | 0 (0.0%) | 27 (2.4%) |
| 65 to 74 Years | 53 (13.9%) | 11 (3.2%) |
| 75 Years and over | 9 (3.9%) | 29 (14.6%) |
Disability Class: Self-Care Difficulty
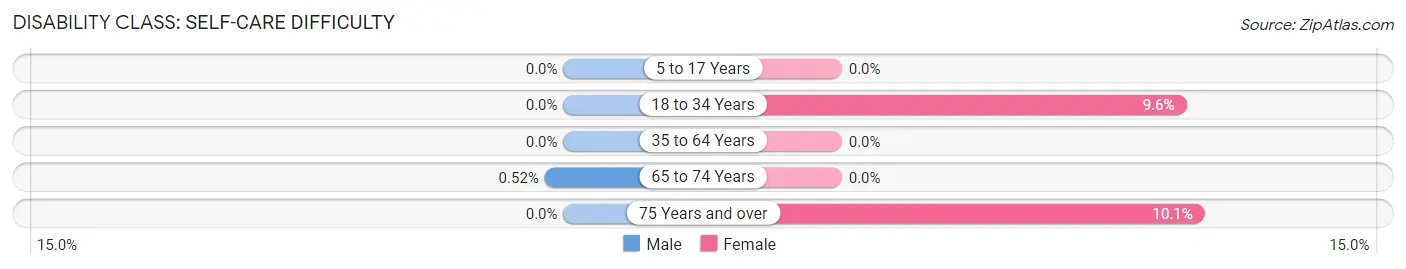
| Age Bracket | Male | Female |
| 5 to 17 Years | 0 (0.0%) | 0 (0.0%) |
| 18 to 34 Years | 0 (0.0%) | 14 (9.6%) |
| 35 to 64 Years | 0 (0.0%) | 0 (0.0%) |
| 65 to 74 Years | 2 (0.5%) | 0 (0.0%) |
| 75 Years and over | 0 (0.0%) | 20 (10.1%) |
Technology Access in Summit
Computing Device Access in Summit
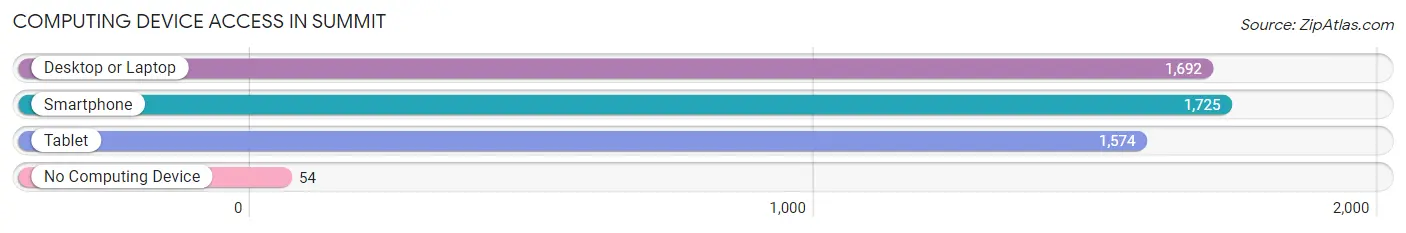
| Device Type | # Households | % Households |
| Desktop or Laptop | 1,692 | 89.4% |
| Smartphone | 1,725 | 91.1% |
| Tablet | 1,574 | 83.2% |
| No Computing Device | 54 | 2.9% |
| Total | 1,893 | 100.0% |
Internet Access in Summit
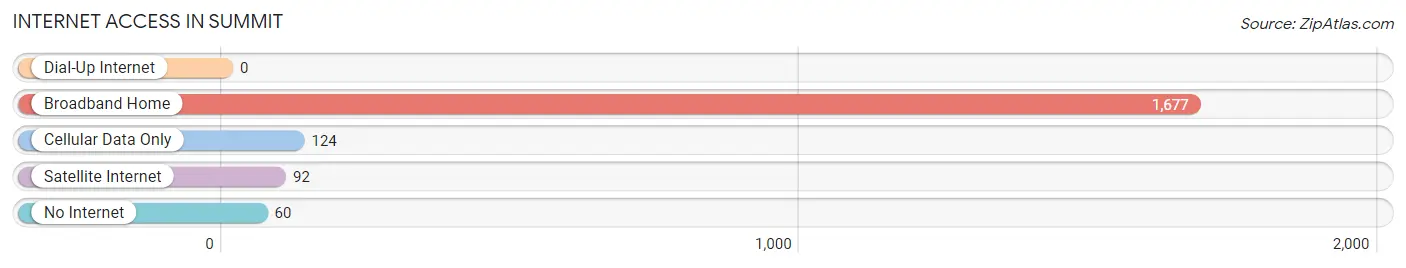
| Internet Type | # Households | % Households |
| Dial-Up Internet | 0 | 0.0% |
| Broadband Home | 1,677 | 88.6% |
| Cellular Data Only | 124 | 6.6% |
| Satellite Internet | 92 | 4.9% |
| No Internet | 60 | 3.2% |
| Total | 1,893 | 100.0% |
Summit Summary
Summit is a small village located in Waukesha County, Wisconsin. It is situated on the western edge of the Kettle Moraine State Forest, about 25 miles west of Milwaukee. The village has a population of approximately 2,500 people and covers an area of 1.7 square miles.
History
The area that is now Summit was first settled in the early 1800s by German immigrants. The village was originally known as “Summit Station” because it was located at the highest point of the Milwaukee and Mississippi Railroad. The village was officially incorporated in 1892.
In the early 1900s, Summit was a thriving agricultural community. The village was home to several dairy farms, as well as a cheese factory and a creamery. The village also had a number of small businesses, including a blacksmith shop, a general store, and a hotel.
Geography
Summit is located in southeastern Wisconsin, about 25 miles west of Milwaukee. The village is situated on the western edge of the Kettle Moraine State Forest, which covers an area of about 30,000 acres. The forest is home to a variety of wildlife, including white-tailed deer, wild turkeys, and a variety of birds.
The village is located on the banks of the Fox River, which flows through the area. The river is a popular destination for fishing, canoeing, and kayaking.
Economy
The economy of Summit is largely based on agriculture and tourism. The village is home to several dairy farms, as well as a number of small businesses. The village also has a number of restaurants, bars, and shops.
The village is also home to a number of manufacturing companies, including a plastics manufacturer and a metal fabrication company. The village is also home to a number of technology companies, including a software development firm and a web design firm.
Demographics
As of the 2010 census, the population of Summit was 2,521. The racial makeup of the village was 94.3% White, 1.2% African American, 0.3% Native American, 0.7% Asian, 0.1% Pacific Islander, 1.2% from other races, and 2.3% from two or more races. Hispanic or Latino of any race were 3.2% of the population.
The median household income in Summit was $60,938, and the median family income was $71,250. The per capita income for the village was $27,945. About 4.3% of families and 5.7% of the population were below the poverty line, including 6.3% of those under age 18 and 4.2% of those age 65 or over.
Summit is a small village with a rich history and a vibrant economy. The village is home to a variety of businesses, including dairy farms, manufacturing companies, and technology firms. The village is also home to a number of restaurants, bars, and shops. The village has a diverse population, with a median household income of $60,938.
Common Questions
What is the Total Population of Summit?
Total Population of Summit is 4,914.
What is the Total Male Population of Summit?
Total Male Population of Summit is 2,685.
What is the Total Female Population of Summit?
Total Female Population of Summit is 2,229.
What is the Ratio of Males per 100 Females in Summit?
There are 120.46 Males per 100 Females in Summit.
What is the Ratio of Females per 100 Males in Summit?
There are 83.02 Females per 100 Males in Summit.
What is the Median Population Age in Summit?
Median Population Age in Summit is 52.7 Years.
What is the Average Family Size in Summit
Average Family Size in Summit is 2.9 People.
What is the Average Household Size in Summit
Average Household Size in Summit is 2.5 People.
What is Per Capita Income in Summit?
Per Capita income in Summit is $62,480.
What is the Median Family Income in Summit?
Median Family Income in Summit is $136,857.
What is the Median Household income in Summit?
Median Household Income in Summit is $125,298.
What is Income or Wage Gap in Summit?
Income or Wage Gap in Summit is 44.0%.
Women in Summit earn 56.0 cents for every dollar earned by a man.
What is Inequality or Gini Index in Summit?
Inequality or Gini Index in Summit is 0.44.
How Large is the Labor Force in Summit?
There are 2,355 People in the Labor Forcein in Summit.
What is the Percentage of People in the Labor Force in Summit?
57.1% of People are in the Labor Force in Summit.
What is the Unemployment Rate in Summit?
Unemployment Rate in Summit is 0.5%.