Custer, SD
Custer Map
Custer Overview
2,043
TOTAL POPULATION
933
MALE POPULATION
1,110
FEMALE POPULATION
84.05
MALES / 100 FEMALES
118.97
FEMALES / 100 MALES
57.6
MEDIAN AGE
2.4
AVG FAMILY SIZE
1.9
AVG HOUSEHOLD SIZE
$41,284
PER CAPITA INCOME
$78,769
AVG FAMILY INCOME
$66,141
AVG HOUSEHOLD INCOME
46.8%
WAGE / INCOME GAP [ % ]
53.2¢/ $1
WAGE / INCOME GAP [ $ ]
0.47
INEQUALITY / GINI INDEX
946
LABOR FORCE [ PEOPLE ]
52.4%
PERCENT IN LABOR FORCE
4.1%
UNEMPLOYMENT RATE
Custer Zip Codes
Custer Area Codes
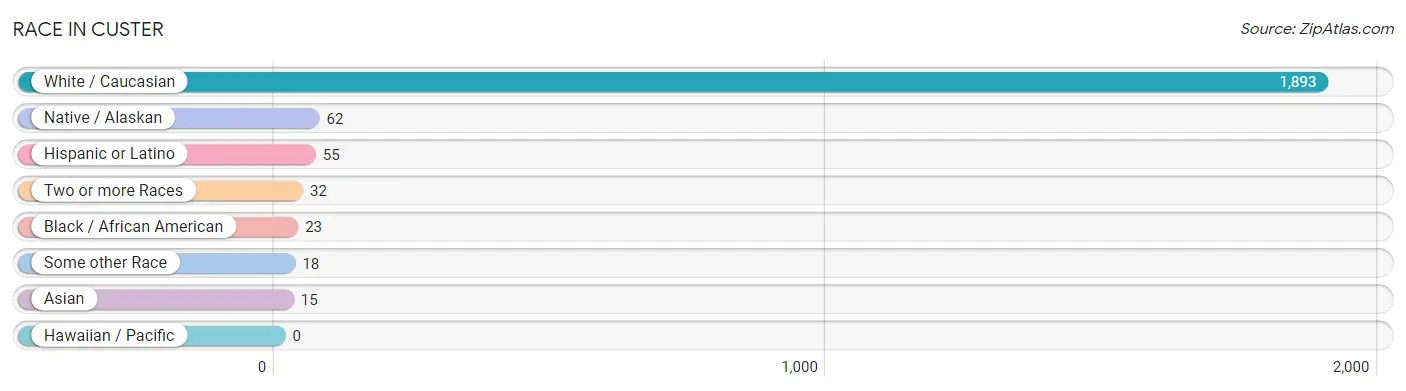
Race in Custer
The most populous races in Custer are White / Caucasian (1,893 | 92.7%), Native / Alaskan (62 | 3.0%), and Hispanic or Latino (55 | 2.7%).
| Race | # Population | % Population |
| Asian | 15 | 0.7% |
| Black / African American | 23 | 1.1% |
| Hawaiian / Pacific | 0 | 0.0% |
| Hispanic or Latino | 55 | 2.7% |
| Native / Alaskan | 62 | 3.0% |
| White / Caucasian | 1,893 | 92.7% |
| Two or more Races | 32 | 1.6% |
| Some other Race | 18 | 0.9% |
| Total | 2,043 | 100.0% |
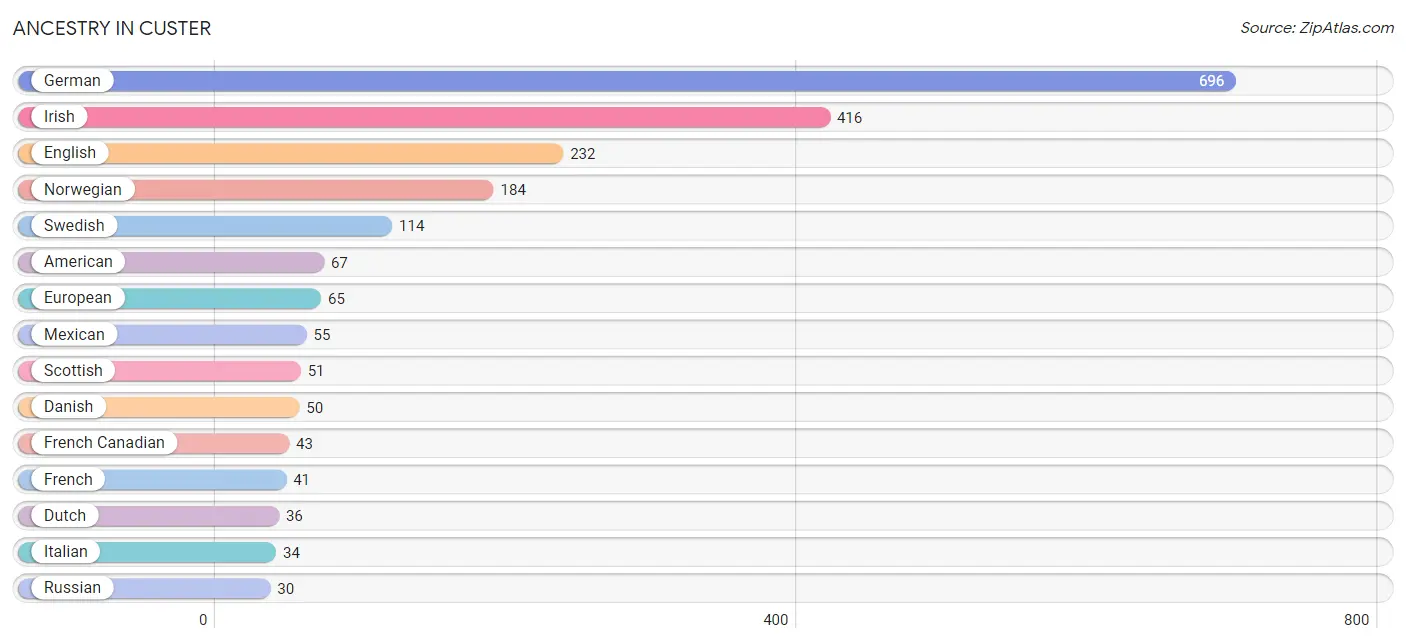
Ancestry in Custer
The most populous ancestries reported in Custer are German (696 | 34.1%), Irish (416 | 20.4%), English (232 | 11.4%), Norwegian (184 | 9.0%), and Swedish (114 | 5.6%), together accounting for 80.4% of all Custer residents.
| Ancestry | # Population | % Population |
| American | 67 | 3.3% |
| Basque | 6 | 0.3% |
| British | 23 | 1.1% |
| Burmese | 3 | 0.2% |
| Canadian | 20 | 1.0% |
| Czech | 13 | 0.6% |
| Danish | 50 | 2.5% |
| Dutch | 36 | 1.8% |
| Eastern European | 4 | 0.2% |
| English | 232 | 11.4% |
| European | 65 | 3.2% |
| Finnish | 17 | 0.8% |
| French | 41 | 2.0% |
| French Canadian | 43 | 2.1% |
| German | 696 | 34.1% |
| Hungarian | 28 | 1.4% |
| Irish | 416 | 20.4% |
| Italian | 34 | 1.7% |
| Korean | 12 | 0.6% |
| Mexican | 55 | 2.7% |
| Norwegian | 184 | 9.0% |
| Polish | 25 | 1.2% |
| Russian | 30 | 1.5% |
| Scotch-Irish | 27 | 1.3% |
| Scottish | 51 | 2.5% |
| Sioux | 12 | 0.6% |
| Slavic | 4 | 0.2% |
| Swedish | 114 | 5.6% |
| Ukrainian | 4 | 0.2% |
| Welsh | 26 | 1.3% | View All 30 Rows |
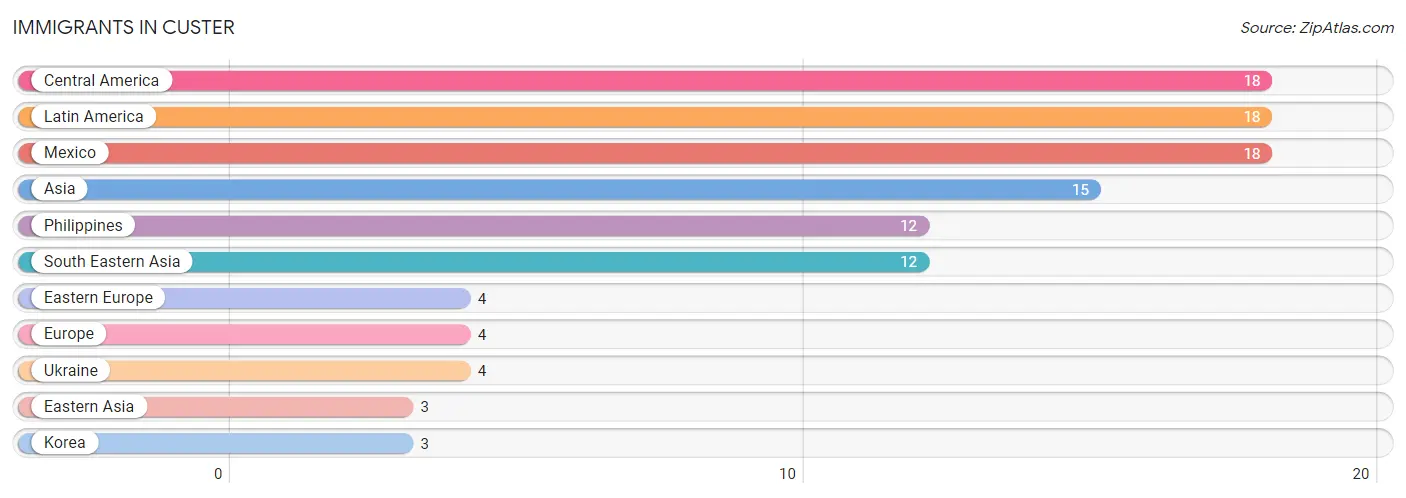
Immigrants in Custer
The most numerous immigrant groups reported in Custer came from Central America (18 | 0.9%), Latin America (18 | 0.9%), Mexico (18 | 0.9%), Asia (15 | 0.7%), and Philippines (12 | 0.6%), together accounting for 4.0% of all Custer residents.
| Immigration Origin | # Population | % Population |
| Asia | 15 | 0.7% |
| Central America | 18 | 0.9% |
| Eastern Asia | 3 | 0.2% |
| Eastern Europe | 4 | 0.2% |
| Europe | 4 | 0.2% |
| Korea | 3 | 0.2% |
| Latin America | 18 | 0.9% |
| Mexico | 18 | 0.9% |
| Philippines | 12 | 0.6% |
| South Eastern Asia | 12 | 0.6% |
| Ukraine | 4 | 0.2% | View All 11 Rows |
Sex and Age in Custer
Sex and Age in Custer
The most populous age groups in Custer are 60 to 64 Years (119 | 12.8%) for men and 65 to 69 Years (127 | 11.4%) for women.
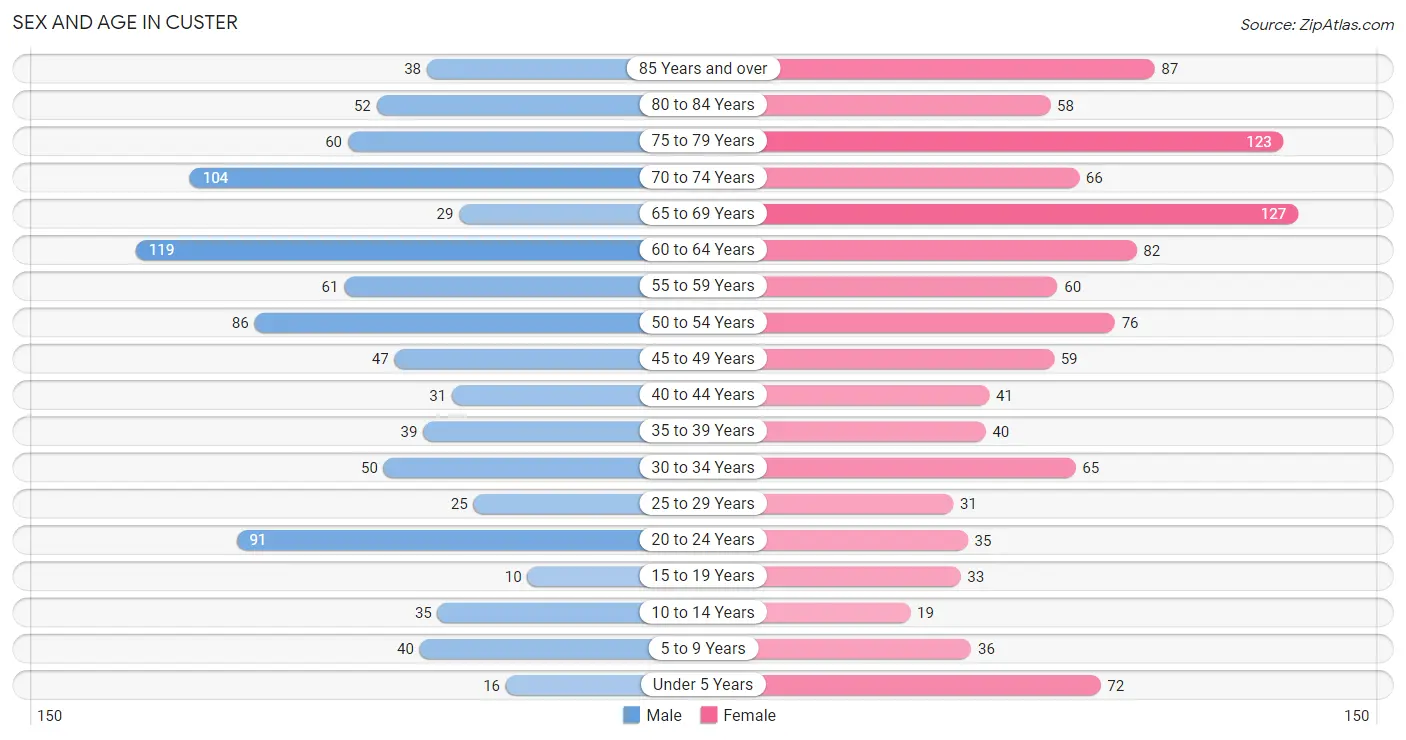
| Age Bracket | Male | Female |
| Under 5 Years | 16 (1.7%) | 72 (6.5%) |
| 5 to 9 Years | 40 (4.3%) | 36 (3.2%) |
| 10 to 14 Years | 35 (3.7%) | 19 (1.7%) |
| 15 to 19 Years | 10 (1.1%) | 33 (3.0%) |
| 20 to 24 Years | 91 (9.8%) | 35 (3.2%) |
| 25 to 29 Years | 25 (2.7%) | 31 (2.8%) |
| 30 to 34 Years | 50 (5.4%) | 65 (5.9%) |
| 35 to 39 Years | 39 (4.2%) | 40 (3.6%) |
| 40 to 44 Years | 31 (3.3%) | 41 (3.7%) |
| 45 to 49 Years | 47 (5.0%) | 59 (5.3%) |
| 50 to 54 Years | 86 (9.2%) | 76 (6.9%) |
| 55 to 59 Years | 61 (6.5%) | 60 (5.4%) |
| 60 to 64 Years | 119 (12.8%) | 82 (7.4%) |
| 65 to 69 Years | 29 (3.1%) | 127 (11.4%) |
| 70 to 74 Years | 104 (11.2%) | 66 (5.9%) |
| 75 to 79 Years | 60 (6.4%) | 123 (11.1%) |
| 80 to 84 Years | 52 (5.6%) | 58 (5.2%) |
| 85 Years and over | 38 (4.1%) | 87 (7.8%) |
| Total | 933 (100.0%) | 1,110 (100.0%) |
Families and Households in Custer
Median Family Size in Custer
The median family size in Custer is 2.36 persons per family, with single female/mother families (85 | 14.2%) accounting for the largest median family size of 2.69 persons per family. On the other hand, single male/father families (66 | 11.0%) represent the smallest median family size with 1.82 persons per family.
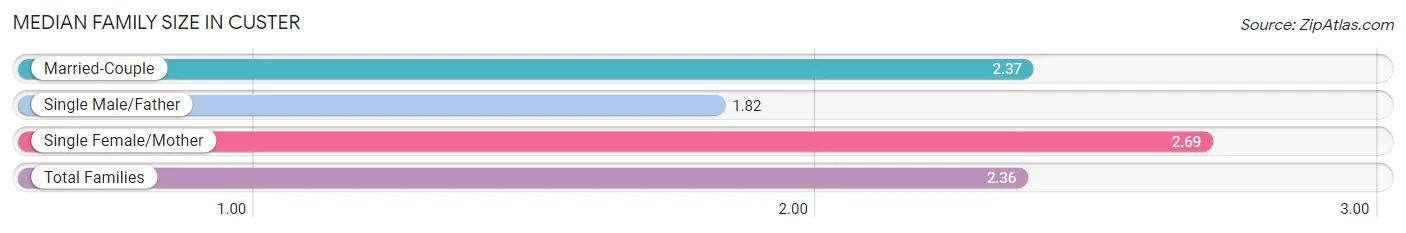
| Family Type | # Families | Family Size |
| Married-Couple | 447 (74.8%) | 2.37 |
| Single Male/Father | 66 (11.0%) | 1.82 |
| Single Female/Mother | 85 (14.2%) | 2.69 |
| Total Families | 598 (100.0%) | 2.36 |
Median Household Size in Custer
The median household size in Custer is 1.93 persons per household, with single female/mother households (85 | 8.6%) accounting for the largest median household size of 3.24 persons per household. non-family households (385 | 39.2%) represent the smallest median household size with 1.08 persons per household.
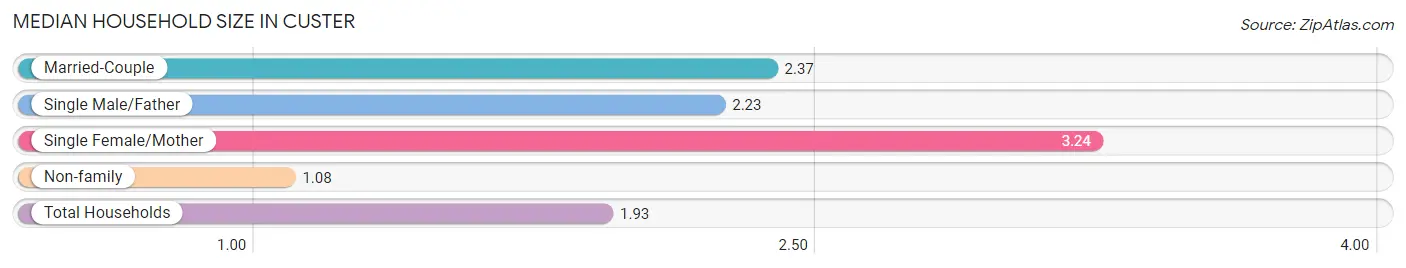
| Household Type | # Households | Household Size |
| Married-Couple | 447 (45.5%) | 2.37 |
| Single Male/Father | 66 (6.7%) | 2.23 |
| Single Female/Mother | 85 (8.6%) | 3.24 |
| Non-family | 385 (39.2%) | 1.08 |
| Total Households | 983 (100.0%) | 1.93 |
Household Size by Marriage Status in Custer
Out of a total of 983 households in Custer, 598 (60.8%) are family households, while 385 (39.2%) are nonfamily households. The most numerous type of family households are 2-person households, comprising 420, and the most common type of nonfamily households are 1-person households, comprising 356.
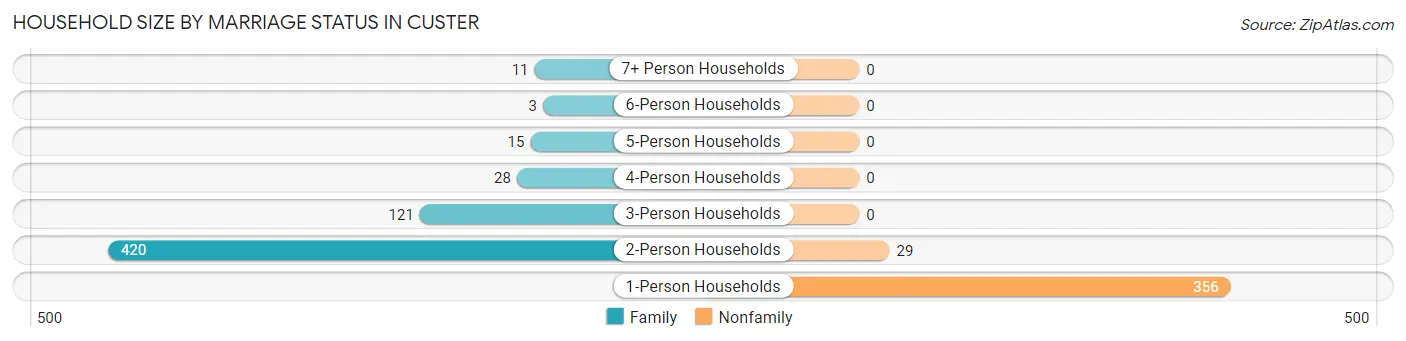
| Household Size | Family Households | Nonfamily Households |
| 1-Person Households | - | 356 (36.2%) |
| 2-Person Households | 420 (42.7%) | 29 (2.9%) |
| 3-Person Households | 121 (12.3%) | 0 (0.0%) |
| 4-Person Households | 28 (2.9%) | 0 (0.0%) |
| 5-Person Households | 15 (1.5%) | 0 (0.0%) |
| 6-Person Households | 3 (0.3%) | 0 (0.0%) |
| 7+ Person Households | 11 (1.1%) | 0 (0.0%) |
| Total | 598 (60.8%) | 385 (39.2%) |
Female Fertility in Custer
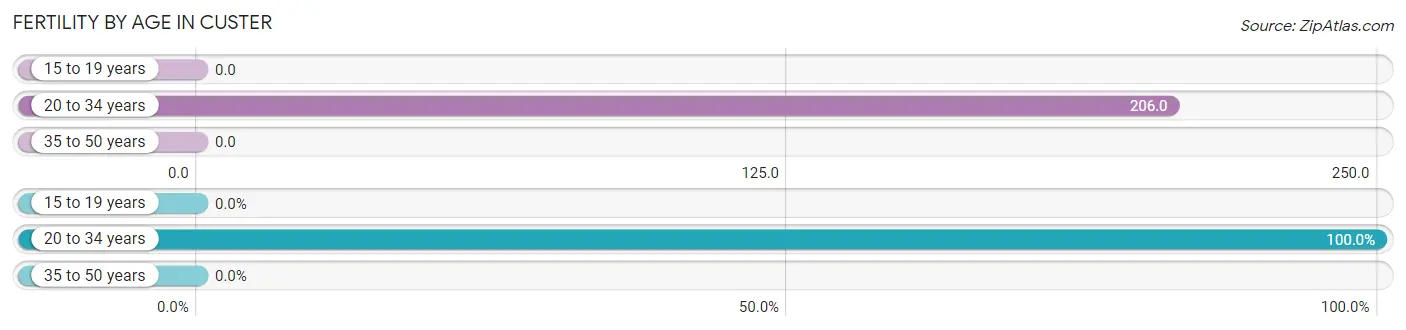
Fertility by Age in Custer
Average fertility rate in Custer is 81.0 births per 1,000 women. Women in the age bracket of 20 to 34 years have the highest fertility rate with 206.0 births per 1,000 women. Women in the age bracket of 20 to 34 years acount for 100.0% of all women with births.
| Age Bracket | Women with Births | Births / 1,000 Women |
| 15 to 19 years | 0 (0.0%) | 0.0 |
| 20 to 34 years | 27 (100.0%) | 206.0 |
| 35 to 50 years | 0 (0.0%) | 0.0 |
| Total | 27 (100.0%) | 81.0 |
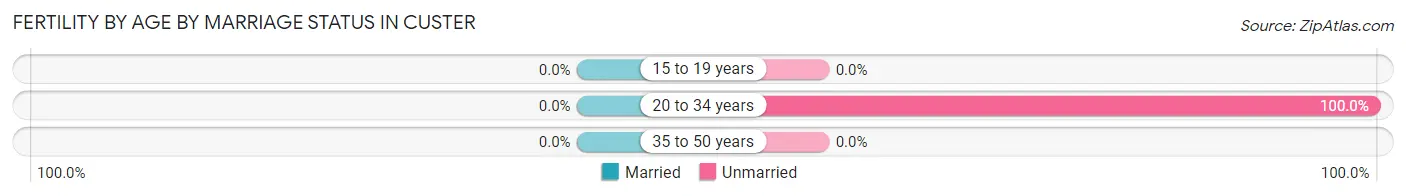
Fertility by Age by Marriage Status in Custer
| Age Bracket | Married | Unmarried |
| 15 to 19 years | 0 (0.0%) | 0 (0.0%) |
| 20 to 34 years | 0 (0.0%) | 27 (100.0%) |
| 35 to 50 years | 0 (0.0%) | 0 (0.0%) |
| Total | 0 (0.0%) | 27 (100.0%) |
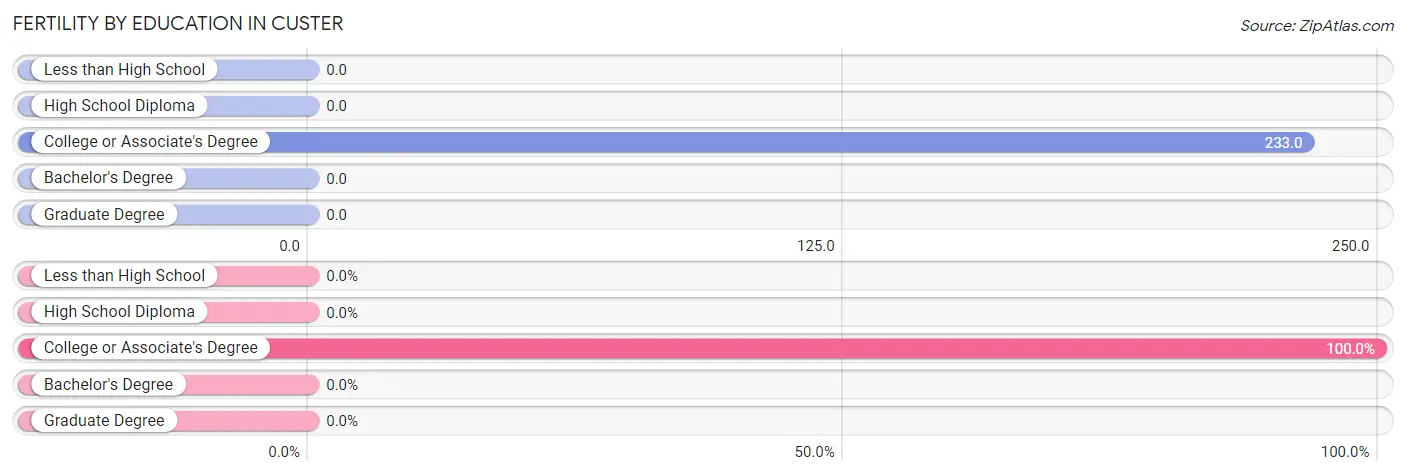
Fertility by Education in Custer
| Educational Attainment | Women with Births | Births / 1,000 Women |
| Less than High School | 0 (0.0%) | 0.0 |
| High School Diploma | 0 (0.0%) | 0.0 |
| College or Associate's Degree | 27 (100.0%) | 233.0 |
| Bachelor's Degree | 0 (0.0%) | 0.0 |
| Graduate Degree | 0 (0.0%) | 0.0 |
| Total | 27 (100.0%) | 81.0 |
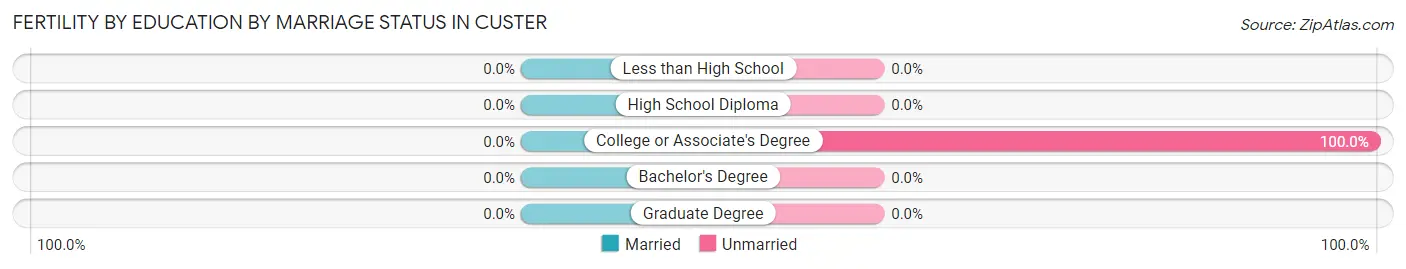
Fertility by Education by Marriage Status in Custer
| Educational Attainment | Married | Unmarried |
| Less than High School | 0 (0.0%) | 0 (0.0%) |
| High School Diploma | 0 (0.0%) | 0 (0.0%) |
| College or Associate's Degree | 0 (0.0%) | 27 (100.0%) |
| Bachelor's Degree | 0 (0.0%) | 0 (0.0%) |
| Graduate Degree | 0 (0.0%) | 0 (0.0%) |
| Total | 0 (0.0%) | 27 (100.0%) |
Income in Custer
Income Overview in Custer
Per Capita Income in Custer is $41,284, while median incomes of families and households are $78,769 and $66,141 respectively.
| Characteristic | Number | Measure |
| Per Capita Income | 2,043 | $41,284 |
| Median Family Income | 598 | $78,769 |
| Mean Family Income | 598 | $103,125 |
| Median Household Income | 983 | $66,141 |
| Mean Household Income | 983 | $82,474 |
| Income Deficit | 598 | $0 |
| Wage / Income Gap (%) | 2,043 | 46.84% |
| Wage / Income Gap ($) | 2,043 | 53.16¢ per $1 |
| Gini / Inequality Index | 2,043 | 0.47 |
Earnings by Sex in Custer
Average Earnings in Custer are $39,844, $53,077 for men and $28,214 for women, a difference of 46.8%.
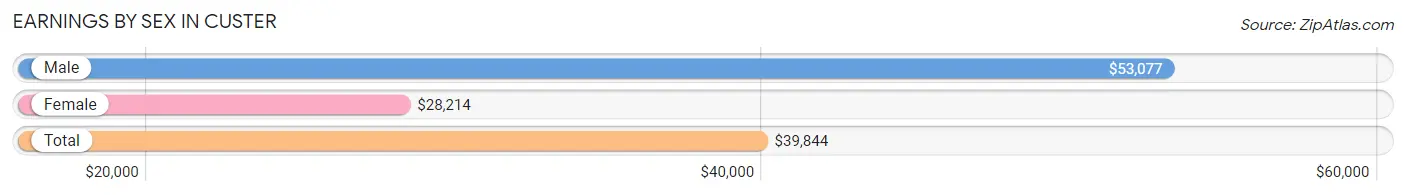
| Sex | Number | Average Earnings |
| Male | 520 (50.8%) | $53,077 |
| Female | 504 (49.2%) | $28,214 |
| Total | 1,024 (100.0%) | $39,844 |
Earnings by Sex by Income Bracket in Custer
The most common earnings brackets in Custer are $75,000 to $99,999 for men (88 | 16.9%) and $2,499 or less for women (59 | 11.7%).
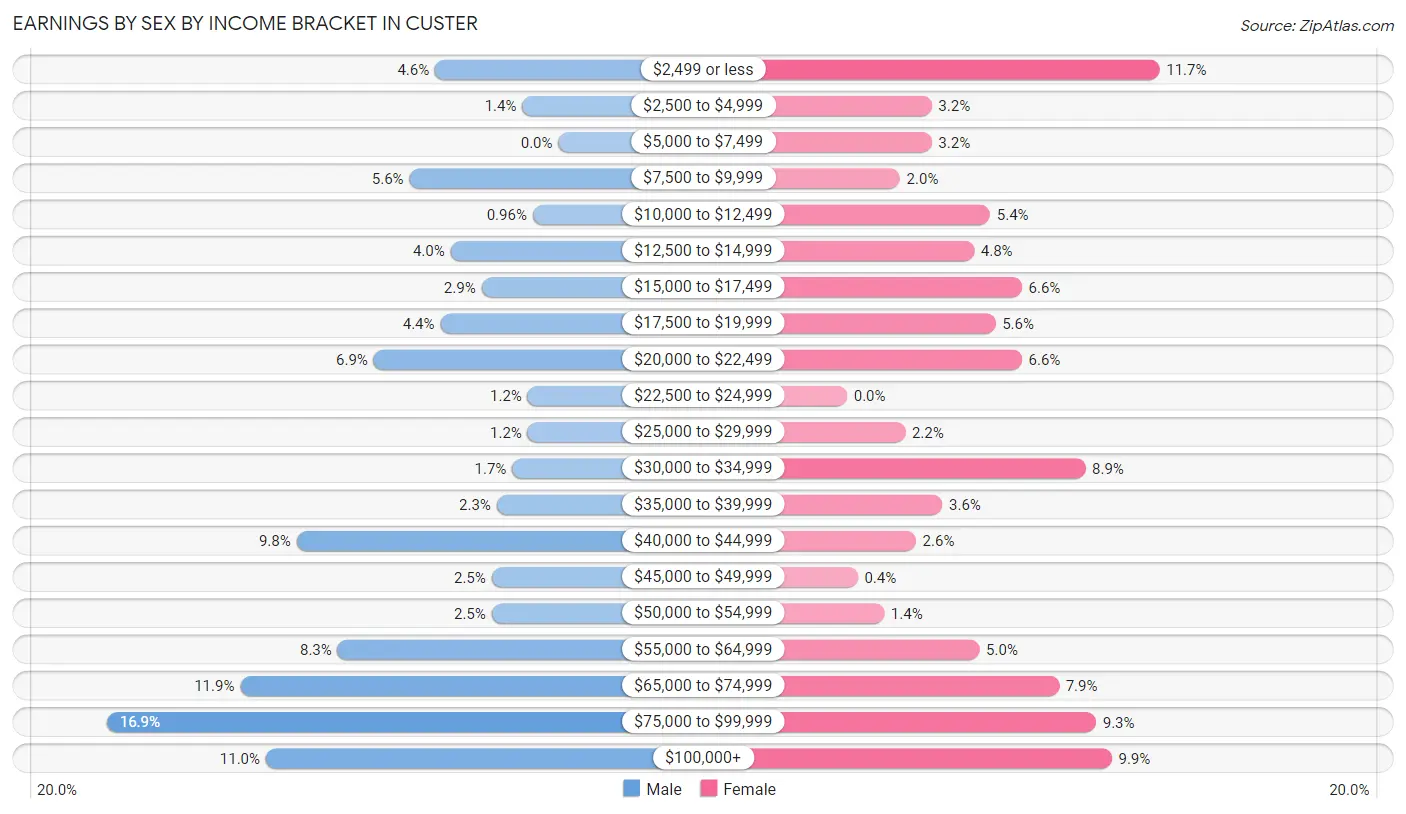
| Income | Male | Female |
| $2,499 or less | 24 (4.6%) | 59 (11.7%) |
| $2,500 to $4,999 | 7 (1.3%) | 16 (3.2%) |
| $5,000 to $7,499 | 0 (0.0%) | 16 (3.2%) |
| $7,500 to $9,999 | 29 (5.6%) | 10 (2.0%) |
| $10,000 to $12,499 | 5 (1.0%) | 27 (5.4%) |
| $12,500 to $14,999 | 21 (4.0%) | 24 (4.8%) |
| $15,000 to $17,499 | 15 (2.9%) | 33 (6.6%) |
| $17,500 to $19,999 | 23 (4.4%) | 28 (5.6%) |
| $20,000 to $22,499 | 36 (6.9%) | 33 (6.6%) |
| $22,500 to $24,999 | 6 (1.1%) | 0 (0.0%) |
| $25,000 to $29,999 | 6 (1.1%) | 11 (2.2%) |
| $30,000 to $34,999 | 9 (1.7%) | 45 (8.9%) |
| $35,000 to $39,999 | 12 (2.3%) | 18 (3.6%) |
| $40,000 to $44,999 | 51 (9.8%) | 13 (2.6%) |
| $45,000 to $49,999 | 13 (2.5%) | 2 (0.4%) |
| $50,000 to $54,999 | 13 (2.5%) | 7 (1.4%) |
| $55,000 to $64,999 | 43 (8.3%) | 25 (5.0%) |
| $65,000 to $74,999 | 62 (11.9%) | 40 (7.9%) |
| $75,000 to $99,999 | 88 (16.9%) | 47 (9.3%) |
| $100,000+ | 57 (11.0%) | 50 (9.9%) |
| Total | 520 (100.0%) | 504 (100.0%) |
Earnings by Sex by Educational Attainment in Custer
Average earnings in Custer are $57,039 for men and $31,028 for women, a difference of 45.6%. Men with an educational attainment of graduate degree enjoy the highest average annual earnings of $77,292, while those with college or associate's degree education earn the least with $24,375. Women with an educational attainment of bachelor's degree earn the most with the average annual earnings of $66,375, while those with high school diploma education have the smallest earnings of $22,321.
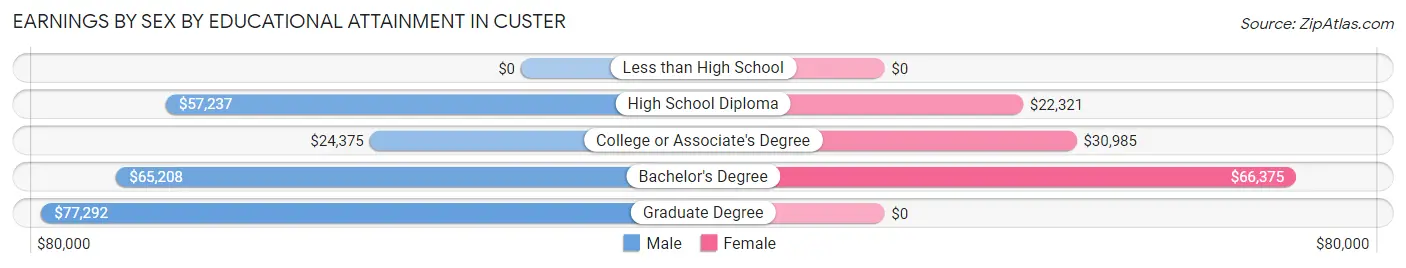
| Educational Attainment | Male Income | Female Income |
| Less than High School | - | - |
| High School Diploma | $57,237 | $22,321 |
| College or Associate's Degree | $24,375 | $30,985 |
| Bachelor's Degree | $65,208 | $66,375 |
| Graduate Degree | $77,292 | $0 |
| Total | $57,039 | $31,028 |
Family Income in Custer
Family Income Brackets in Custer
According to the Custer family income data, there are 177 families falling into the $75,000 to $99,999 income range, which is the most common income bracket and makes up 29.6% of all families. Conversely, the $10,000 to $14,999 income bracket is the least frequent group with only 2 families (0.3%) belonging to this category.
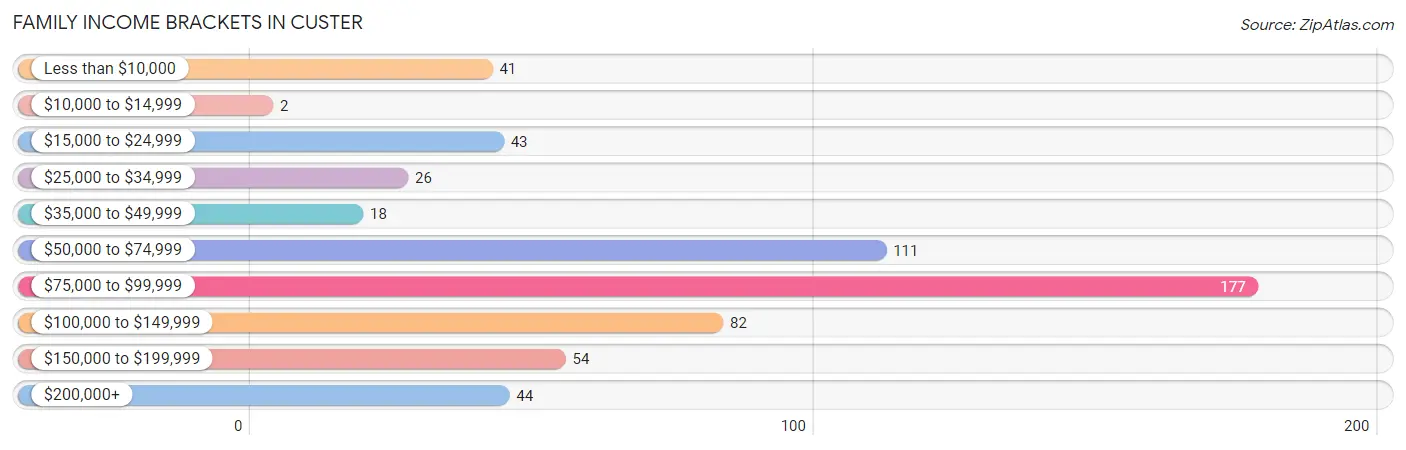
| Income Bracket | # Families | % Families |
| Less than $10,000 | 41 | 6.9% |
| $10,000 to $14,999 | 2 | 0.3% |
| $15,000 to $24,999 | 43 | 7.2% |
| $25,000 to $34,999 | 26 | 4.3% |
| $35,000 to $49,999 | 18 | 3.0% |
| $50,000 to $74,999 | 111 | 18.6% |
| $75,000 to $99,999 | 177 | 29.6% |
| $100,000 to $149,999 | 82 | 13.7% |
| $150,000 to $199,999 | 54 | 9.0% |
| $200,000+ | 44 | 7.4% |
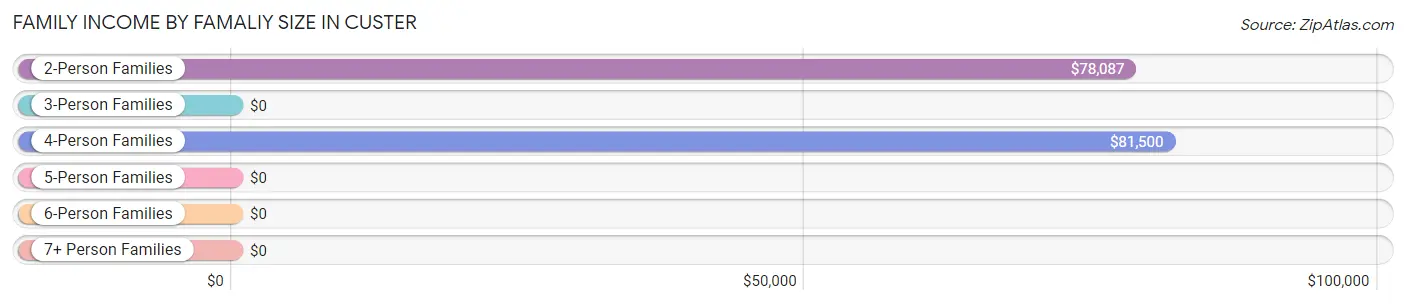
Family Income by Famaliy Size in Custer
4-person families (28 | 4.7%) account for the highest median family income in Custer with $81,500 per family, while 2-person families (463 | 77.4%) have the highest median income of $39,044 per family member.
| Income Bracket | # Families | Median Income |
| 2-Person Families | 463 (77.4%) | $78,087 |
| 3-Person Families | 85 (14.2%) | $0 |
| 4-Person Families | 28 (4.7%) | $81,500 |
| 5-Person Families | 8 (1.3%) | $0 |
| 6-Person Families | 11 (1.8%) | $0 |
| 7+ Person Families | 3 (0.5%) | $0 |
| Total | 598 (100.0%) | $78,769 |
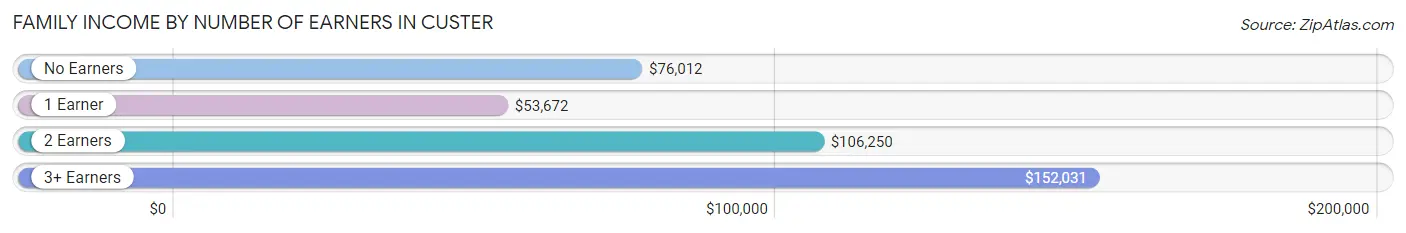
Family Income by Number of Earners in Custer
The median family income in Custer is $78,769, with families comprising 3+ earners (37) having the highest median family income of $152,031, while families with 1 earner (199) have the lowest median family income of $53,672, accounting for 6.2% and 33.3% of families, respectively.
| Number of Earners | # Families | Median Income |
| No Earners | 131 (21.9%) | $76,012 |
| 1 Earner | 199 (33.3%) | $53,672 |
| 2 Earners | 231 (38.6%) | $106,250 |
| 3+ Earners | 37 (6.2%) | $152,031 |
| Total | 598 (100.0%) | $78,769 |
Household Income in Custer
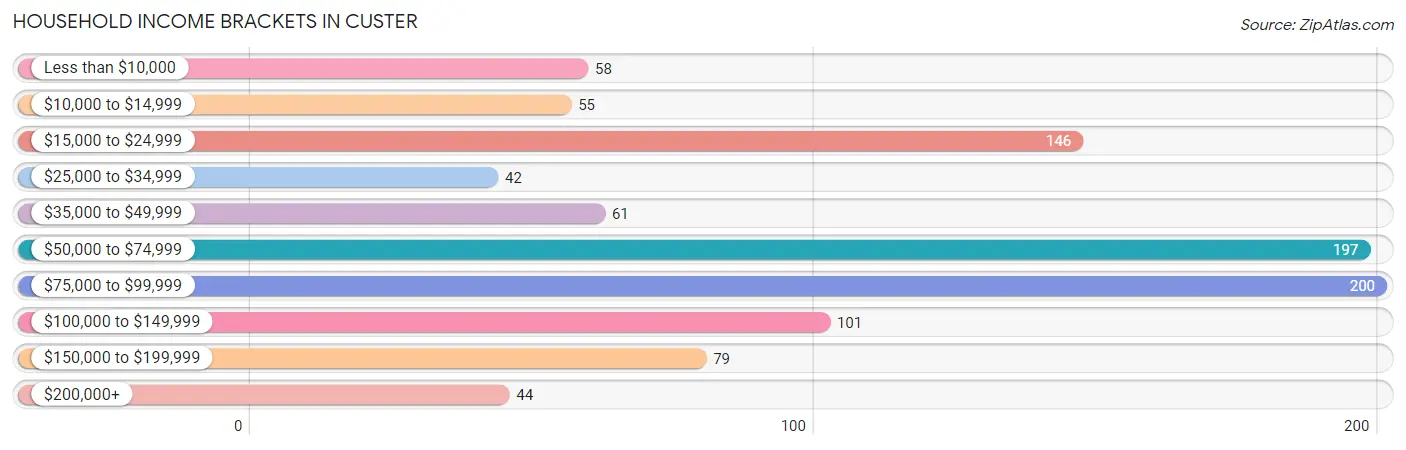
Household Income Brackets in Custer
With 200 households falling in the category, the $75,000 to $99,999 income range is the most frequent in Custer, accounting for 20.3% of all households. In contrast, only 42 households (4.3%) fall into the $25,000 to $34,999 income bracket, making it the least populous group.
| Income Bracket | # Households | % Households |
| Less than $10,000 | 58 | 5.9% |
| $10,000 to $14,999 | 55 | 5.6% |
| $15,000 to $24,999 | 146 | 14.9% |
| $25,000 to $34,999 | 42 | 4.3% |
| $35,000 to $49,999 | 61 | 6.2% |
| $50,000 to $74,999 | 197 | 20.0% |
| $75,000 to $99,999 | 200 | 20.3% |
| $100,000 to $149,999 | 101 | 10.3% |
| $150,000 to $199,999 | 79 | 8.0% |
| $200,000+ | 44 | 4.5% |
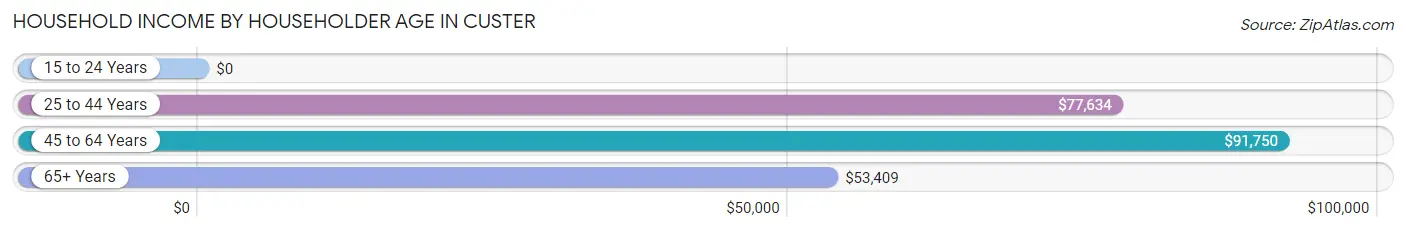
Household Income by Householder Age in Custer
The median household income in Custer is $66,141, with the highest median household income of $91,750 found in the 45 to 64 years age bracket for the primary householder. A total of 344 households (35.0%) fall into this category. Meanwhile, the 15 to 24 years age bracket for the primary householder has the lowest median household income of $0, with 52 households (5.3%) in this group.
| Income Bracket | # Households | Median Income |
| 15 to 24 Years | 52 (5.3%) | $0 |
| 25 to 44 Years | 147 (14.9%) | $77,634 |
| 45 to 64 Years | 344 (35.0%) | $91,750 |
| 65+ Years | 440 (44.8%) | $53,409 |
| Total | 983 (100.0%) | $66,141 |
Poverty in Custer
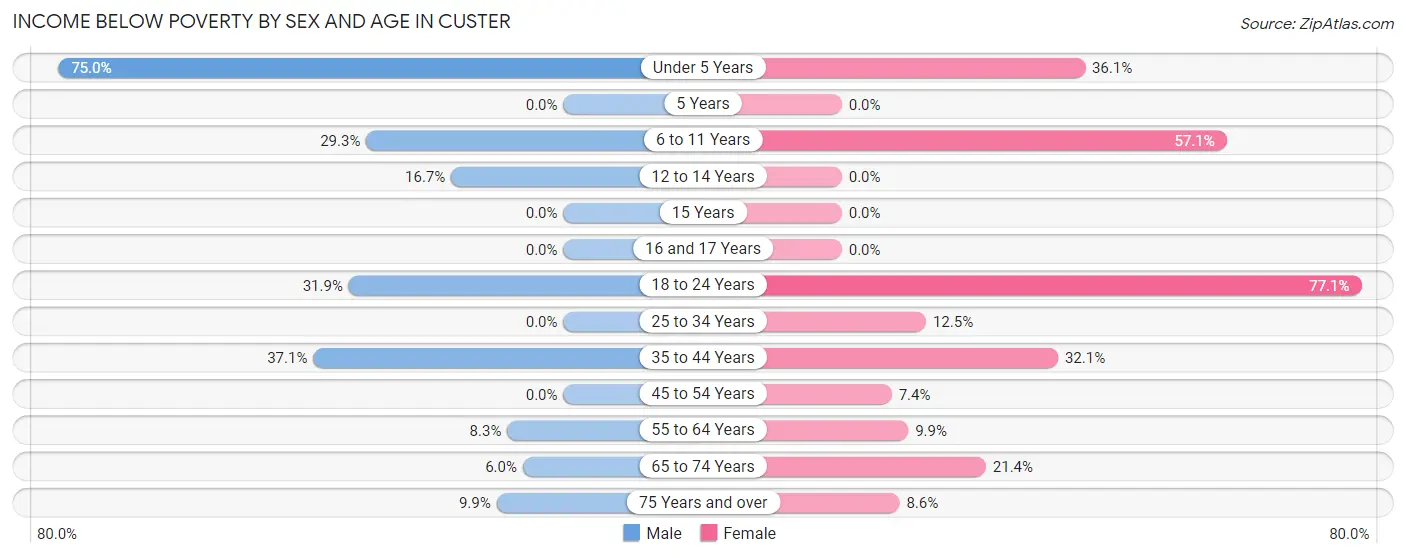
Income Below Poverty by Sex and Age in Custer
With 13.2% poverty level for males and 18.8% for females among the residents of Custer, under 5 year old males and 18 to 24 year old females are the most vulnerable to poverty, with 12 males (75.0%) and 27 females (77.1%) in their respective age groups living below the poverty level.
| Age Bracket | Male | Female |
| Under 5 Years | 12 (75.0%) | 26 (36.1%) |
| 5 Years | 0 (0.0%) | 0 (0.0%) |
| 6 to 11 Years | 12 (29.3%) | 24 (57.1%) |
| 12 to 14 Years | 5 (16.7%) | 0 (0.0%) |
| 15 Years | 0 (0.0%) | 0 (0.0%) |
| 16 and 17 Years | 0 (0.0%) | 0 (0.0%) |
| 18 to 24 Years | 29 (31.9%) | 27 (77.1%) |
| 25 to 34 Years | 0 (0.0%) | 12 (12.5%) |
| 35 to 44 Years | 26 (37.1%) | 26 (32.1%) |
| 45 to 54 Years | 0 (0.0%) | 10 (7.4%) |
| 55 to 64 Years | 15 (8.3%) | 14 (9.9%) |
| 65 to 74 Years | 8 (6.0%) | 37 (21.4%) |
| 75 Years and over | 12 (9.9%) | 18 (8.6%) |
| Total | 119 (13.2%) | 194 (18.8%) |
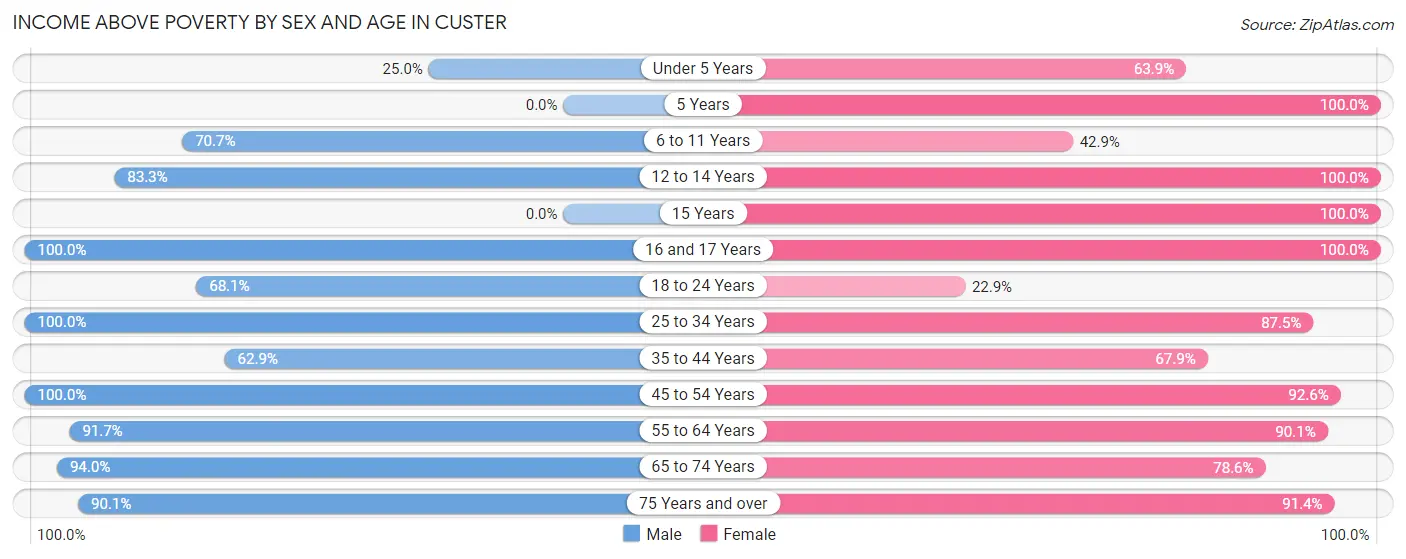
Income Above Poverty by Sex and Age in Custer
According to the poverty statistics in Custer, males aged 16 and 17 years and females aged 5 years are the age groups that are most secure financially, with 100.0% of males and 100.0% of females in these age groups living above the poverty line.
| Age Bracket | Male | Female |
| Under 5 Years | 4 (25.0%) | 46 (63.9%) |
| 5 Years | 0 (0.0%) | 5 (100.0%) |
| 6 to 11 Years | 29 (70.7%) | 18 (42.9%) |
| 12 to 14 Years | 25 (83.3%) | 8 (100.0%) |
| 15 Years | 0 (0.0%) | 20 (100.0%) |
| 16 and 17 Years | 10 (100.0%) | 13 (100.0%) |
| 18 to 24 Years | 62 (68.1%) | 8 (22.9%) |
| 25 to 34 Years | 75 (100.0%) | 84 (87.5%) |
| 35 to 44 Years | 44 (62.9%) | 55 (67.9%) |
| 45 to 54 Years | 133 (100.0%) | 125 (92.6%) |
| 55 to 64 Years | 165 (91.7%) | 128 (90.1%) |
| 65 to 74 Years | 125 (94.0%) | 136 (78.6%) |
| 75 Years and over | 109 (90.1%) | 192 (91.4%) |
| Total | 781 (86.8%) | 838 (81.2%) |
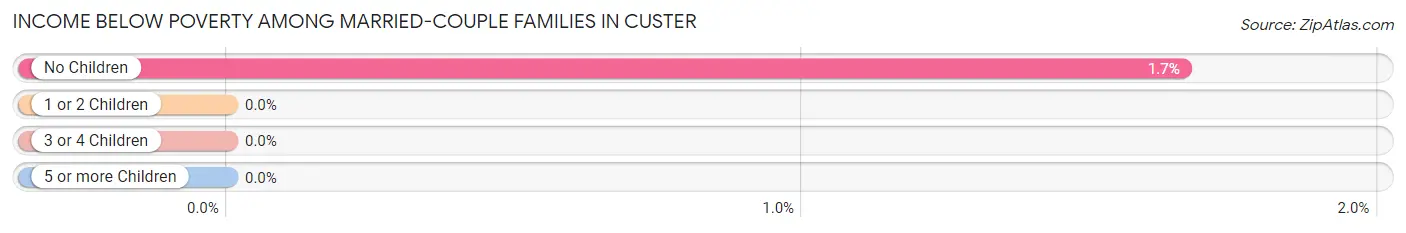
Income Below Poverty Among Married-Couple Families in Custer
The poverty statistics for married-couple families in Custer show that 1.3% or 6 of the total 447 families live below the poverty line. Families with no children have the highest poverty rate of 1.7%, comprising of 6 families. On the other hand, families with 1 or 2 children have the lowest poverty rate of 0.0%, which includes 0 families.
| Children | Above Poverty | Below Poverty |
| No Children | 356 (98.3%) | 6 (1.7%) |
| 1 or 2 Children | 79 (100.0%) | 0 (0.0%) |
| 3 or 4 Children | 6 (100.0%) | 0 (0.0%) |
| 5 or more Children | 0 (0.0%) | 0 (0.0%) |
| Total | 441 (98.7%) | 6 (1.3%) |
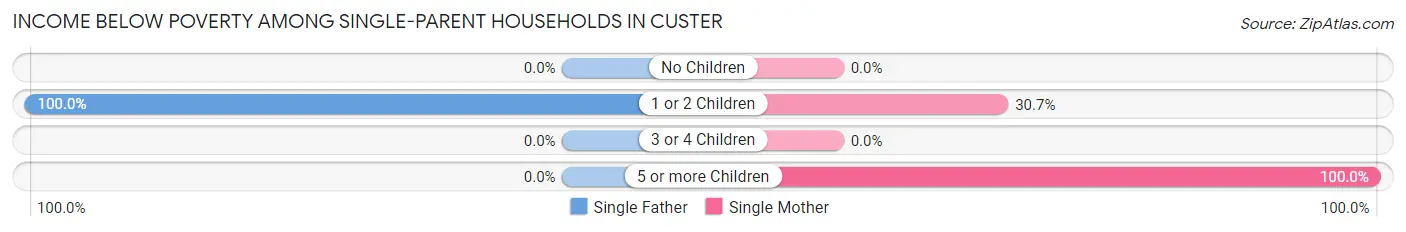
Income Below Poverty Among Single-Parent Households in Custer
According to the poverty data in Custer, 43.9% or 29 single-father households and 31.8% or 27 single-mother households are living below the poverty line. Among single-father households, those with 1 or 2 children have the highest poverty rate, with 29 households (100.0%) experiencing poverty. Likewise, among single-mother households, those with 5 or more children have the highest poverty rate, with 8 households (100.0%) falling below the poverty line.
| Children | Single Father | Single Mother |
| No Children | 0 (0.0%) | 0 (0.0%) |
| 1 or 2 Children | 29 (100.0%) | 19 (30.6%) |
| 3 or 4 Children | 0 (0.0%) | 0 (0.0%) |
| 5 or more Children | 0 (0.0%) | 8 (100.0%) |
| Total | 29 (43.9%) | 27 (31.8%) |
Income Below Poverty Among Married-Couple vs Single-Parent Households in Custer
The poverty data for Custer shows that 6 of the married-couple family households (1.3%) and 56 of the single-parent households (37.1%) are living below the poverty level. Within the married-couple family households, those with no children have the highest poverty rate, with 6 households (1.7%) falling below the poverty line. Among the single-parent households, those with 5 or more children have the highest poverty rate, with 8 household (100.0%) living below poverty.
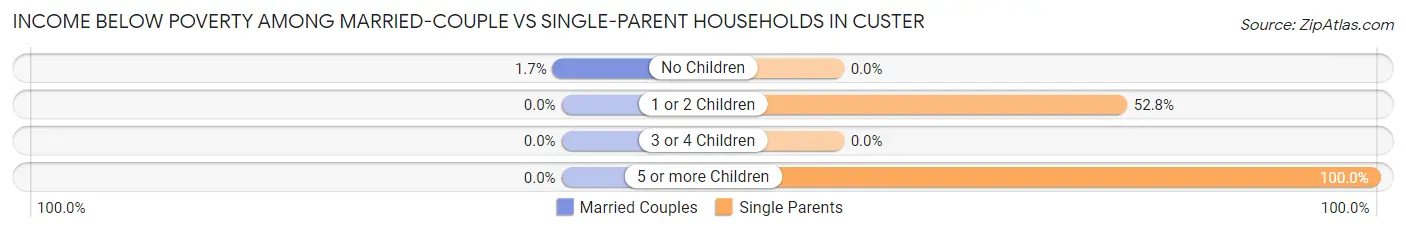
| Children | Married-Couple Families | Single-Parent Households |
| No Children | 6 (1.7%) | 0 (0.0%) |
| 1 or 2 Children | 0 (0.0%) | 48 (52.7%) |
| 3 or 4 Children | 0 (0.0%) | 0 (0.0%) |
| 5 or more Children | 0 (0.0%) | 8 (100.0%) |
| Total | 6 (1.3%) | 56 (37.1%) |
Employment Characteristics in Custer
Employment by Class of Employer in Custer
Among the 906 employed individuals in Custer, private company employees (484 | 53.4%), not-for-profit organizations (86 | 9.5%), and self-employed (not incorporated) (82 | 9.0%) make up the most common classes of employment.
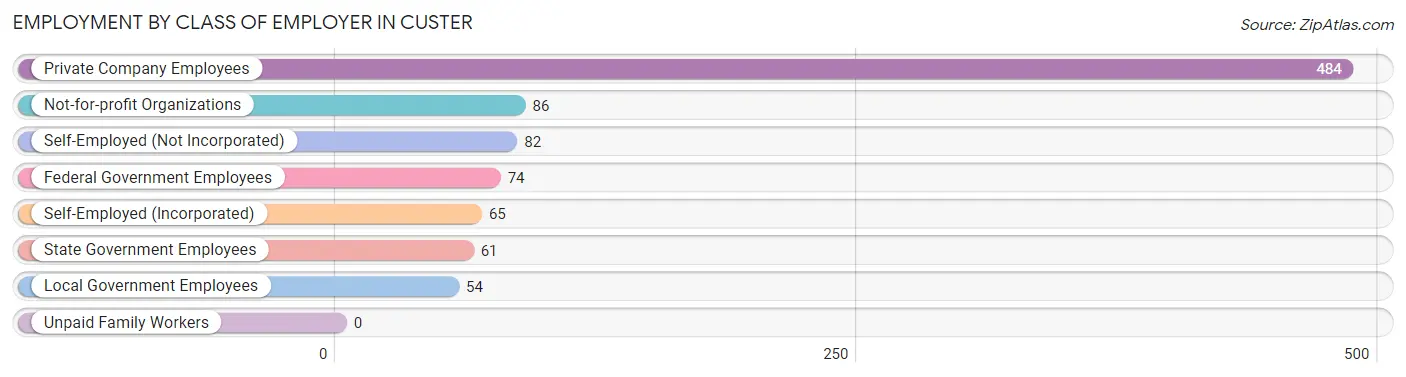
| Employer Class | # Employees | % Employees |
| Private Company Employees | 484 | 53.4% |
| Self-Employed (Incorporated) | 65 | 7.2% |
| Self-Employed (Not Incorporated) | 82 | 9.0% |
| Not-for-profit Organizations | 86 | 9.5% |
| Local Government Employees | 54 | 6.0% |
| State Government Employees | 61 | 6.7% |
| Federal Government Employees | 74 | 8.2% |
| Unpaid Family Workers | 0 | 0.0% |
| Total | 906 | 100.0% |
Employment Status by Age in Custer
According to the labor force statistics for Custer, out of the total population over 16 years of age (1,805), 52.4% or 946 individuals are in the labor force, with 4.1% or 39 of them unemployed. The age group with the highest labor force participation rate is 20 to 24 years, with 100.0% or 126 individuals in the labor force. Within the labor force, the 16 to 19 years age range has the highest percentage of unemployed individuals, with 25.0% or 4 of them being unemployed.
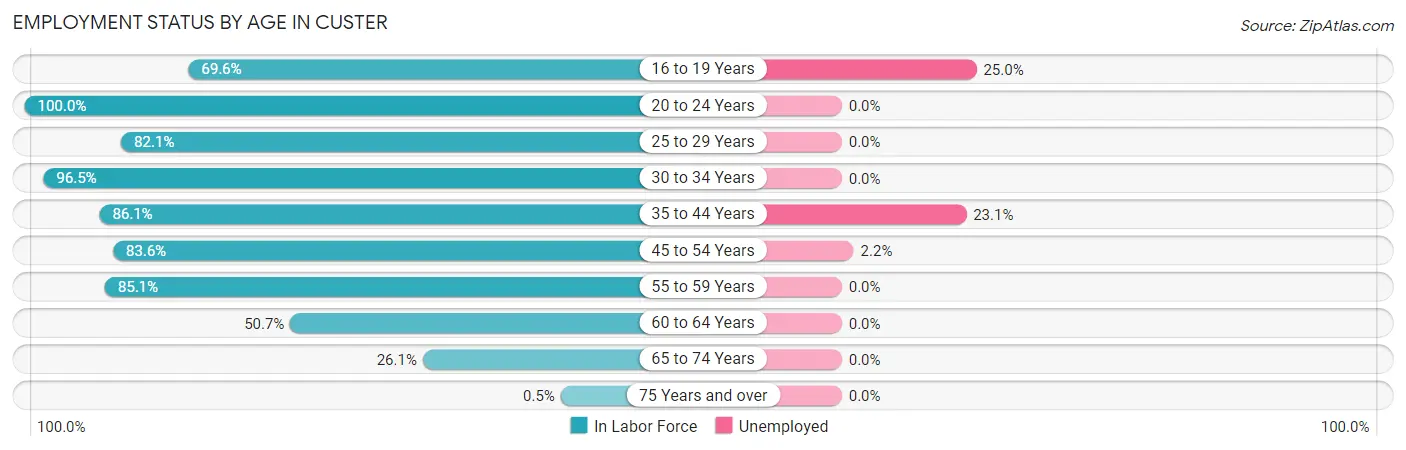
| Age Bracket | In Labor Force | Unemployed |
| 16 to 19 Years | 16 (69.6%) | 4 (25.0%) |
| 20 to 24 Years | 126 (100.0%) | 0 (0.0%) |
| 25 to 29 Years | 46 (82.1%) | 0 (0.0%) |
| 30 to 34 Years | 111 (96.5%) | 0 (0.0%) |
| 35 to 44 Years | 130 (86.1%) | 30 (23.1%) |
| 45 to 54 Years | 224 (83.6%) | 5 (2.2%) |
| 55 to 59 Years | 103 (85.1%) | 0 (0.0%) |
| 60 to 64 Years | 102 (50.7%) | 0 (0.0%) |
| 65 to 74 Years | 85 (26.1%) | 0 (0.0%) |
| 75 Years and over | 2 (0.5%) | 0 (0.0%) |
| Total | 946 (52.4%) | 39 (4.1%) |
Employment Status by Educational Attainment in Custer
According to labor force statistics for Custer, 78.5% of individuals (716) out of the total population between 25 and 64 years of age (912) are in the labor force, with 4.9% or 35 of them being unemployed. The group with the highest labor force participation rate are those with the educational attainment of bachelor's degree or higher, with 94.5% or 242 individuals in the labor force. Within the labor force, individuals with less than high school education have the highest percentage of unemployment, with 71.4% or 15 of them being unemployed.
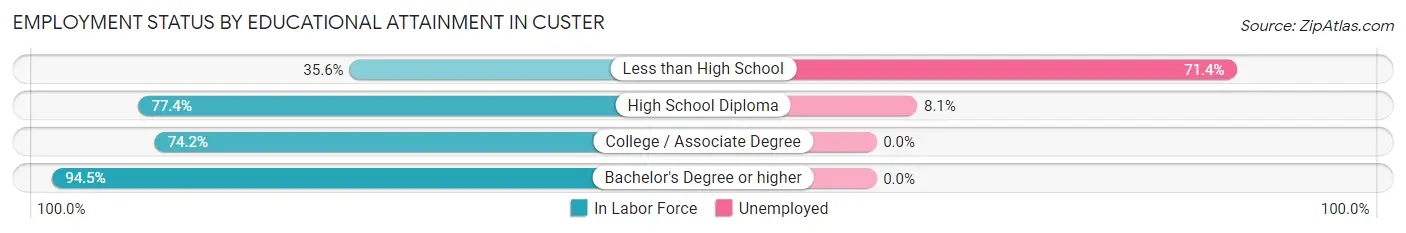
| Educational Attainment | In Labor Force | Unemployed |
| Less than High School | 21 (35.6%) | 42 (71.4%) |
| High School Diploma | 246 (77.4%) | 26 (8.1%) |
| College / Associate Degree | 207 (74.2%) | 0 (0.0%) |
| Bachelor's Degree or higher | 242 (94.5%) | 0 (0.0%) |
| Total | 716 (78.5%) | 45 (4.9%) |
Employment Occupations by Sex in Custer
Management, Business, Science and Arts Occupations
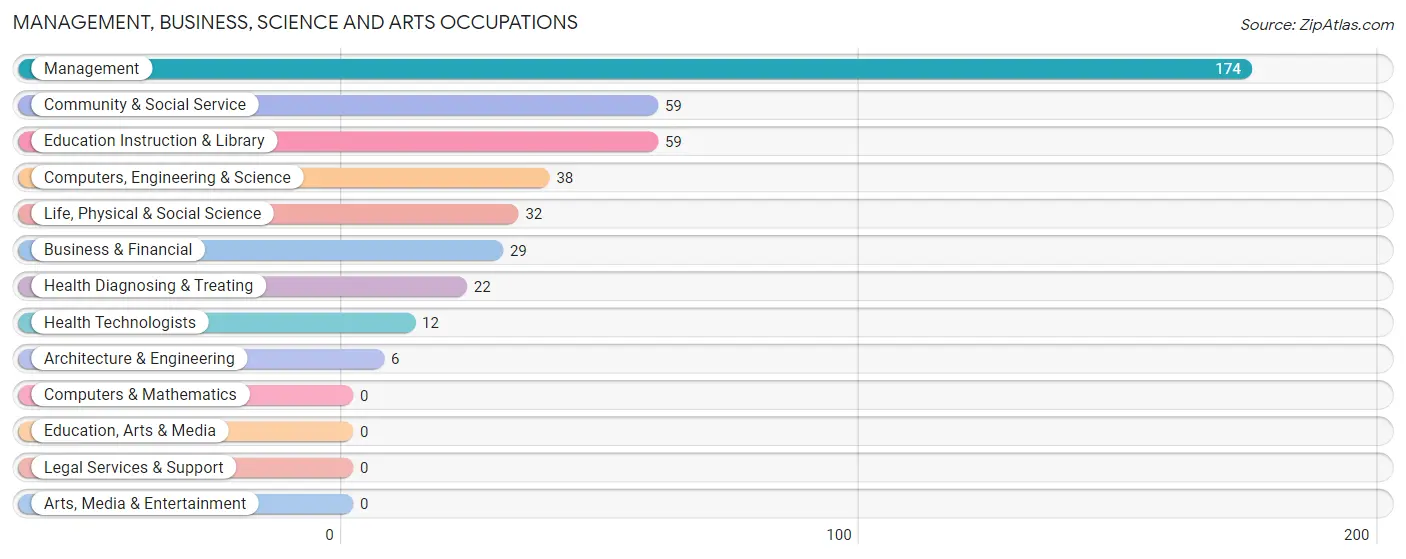
The most common Management, Business, Science and Arts occupations in Custer are Management (174 | 19.2%), Community & Social Service (59 | 6.5%), Education Instruction & Library (59 | 6.5%), Computers, Engineering & Science (38 | 4.2%), and Life, Physical & Social Science (32 | 3.5%).
Management, Business, Science and Arts Occupations by Sex
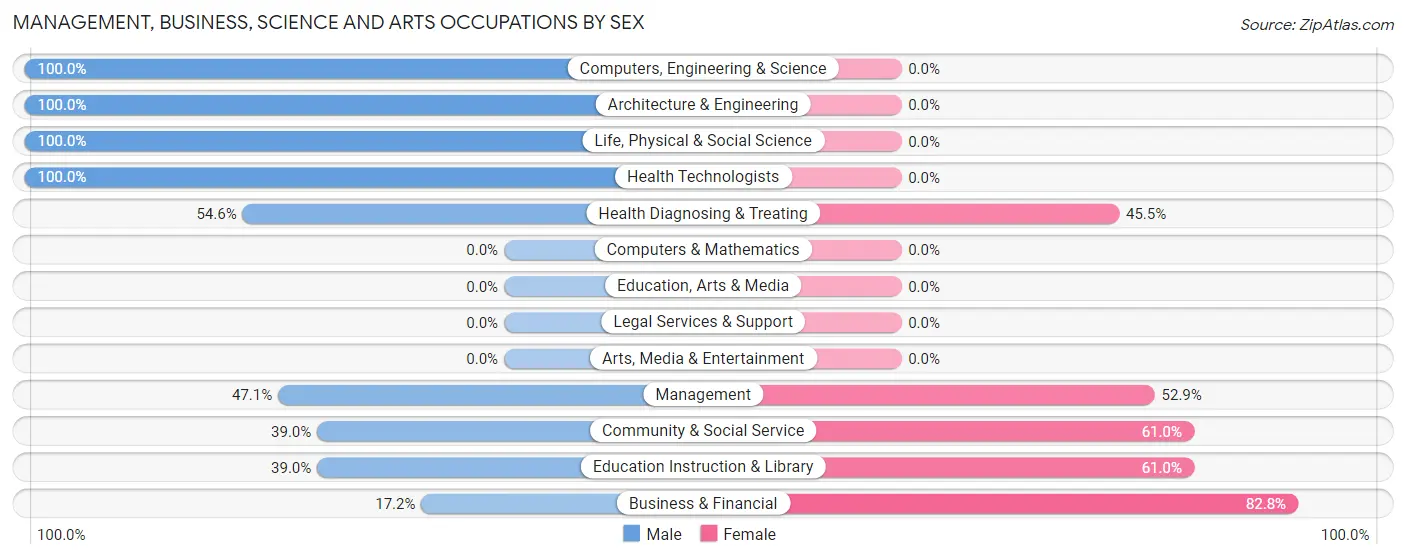
Within the Management, Business, Science and Arts occupations in Custer, the most male-oriented occupations are Computers, Engineering & Science (100.0%), Architecture & Engineering (100.0%), and Life, Physical & Social Science (100.0%), while the most female-oriented occupations are Business & Financial (82.8%), Community & Social Service (61.0%), and Education Instruction & Library (61.0%).
| Occupation | Male | Female |
| Management | 82 (47.1%) | 92 (52.9%) |
| Business & Financial | 5 (17.2%) | 24 (82.8%) |
| Computers, Engineering & Science | 38 (100.0%) | 0 (0.0%) |
| Computers & Mathematics | 0 (0.0%) | 0 (0.0%) |
| Architecture & Engineering | 6 (100.0%) | 0 (0.0%) |
| Life, Physical & Social Science | 32 (100.0%) | 0 (0.0%) |
| Community & Social Service | 23 (39.0%) | 36 (61.0%) |
| Education, Arts & Media | 0 (0.0%) | 0 (0.0%) |
| Legal Services & Support | 0 (0.0%) | 0 (0.0%) |
| Education Instruction & Library | 23 (39.0%) | 36 (61.0%) |
| Arts, Media & Entertainment | 0 (0.0%) | 0 (0.0%) |
| Health Diagnosing & Treating | 12 (54.5%) | 10 (45.5%) |
| Health Technologists | 12 (100.0%) | 0 (0.0%) |
| Total (Category) | 160 (49.7%) | 162 (50.3%) |
| Total (Overall) | 441 (48.7%) | 465 (51.3%) |
Services Occupations
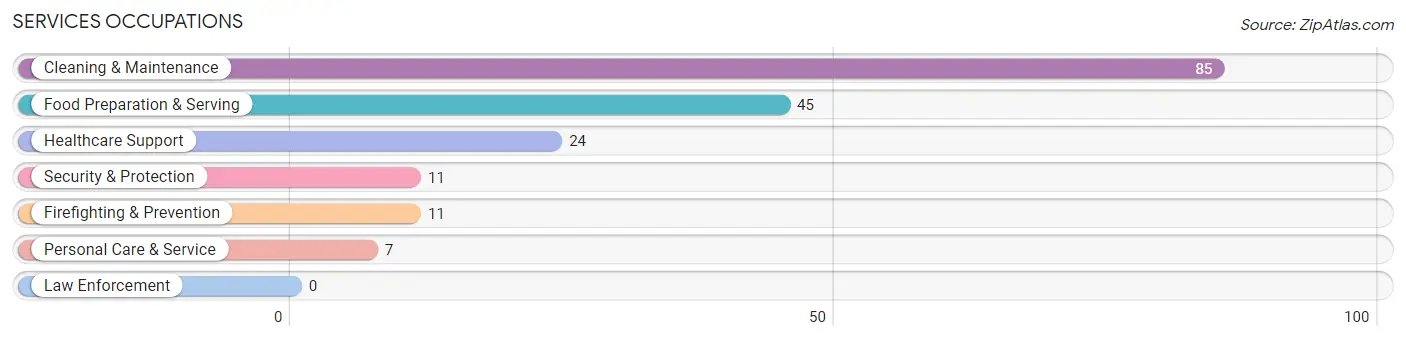
The most common Services occupations in Custer are Cleaning & Maintenance (85 | 9.4%), Food Preparation & Serving (45 | 5.0%), Healthcare Support (24 | 2.6%), Security & Protection (11 | 1.2%), and Firefighting & Prevention (11 | 1.2%).
Services Occupations by Sex
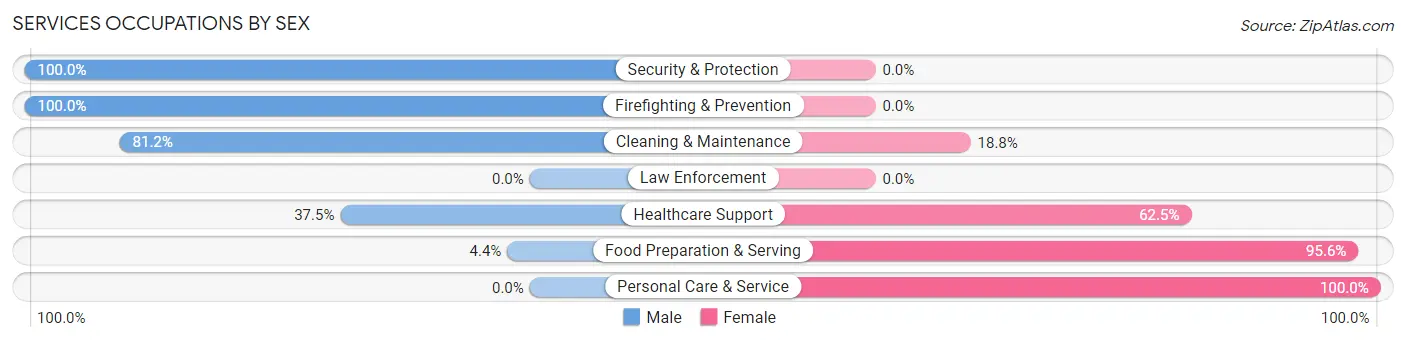
Within the Services occupations in Custer, the most male-oriented occupations are Security & Protection (100.0%), Firefighting & Prevention (100.0%), and Cleaning & Maintenance (81.2%), while the most female-oriented occupations are Personal Care & Service (100.0%), Food Preparation & Serving (95.6%), and Healthcare Support (62.5%).
| Occupation | Male | Female |
| Healthcare Support | 9 (37.5%) | 15 (62.5%) |
| Security & Protection | 11 (100.0%) | 0 (0.0%) |
| Firefighting & Prevention | 11 (100.0%) | 0 (0.0%) |
| Law Enforcement | 0 (0.0%) | 0 (0.0%) |
| Food Preparation & Serving | 2 (4.4%) | 43 (95.6%) |
| Cleaning & Maintenance | 69 (81.2%) | 16 (18.8%) |
| Personal Care & Service | 0 (0.0%) | 7 (100.0%) |
| Total (Category) | 91 (52.9%) | 81 (47.1%) |
| Total (Overall) | 441 (48.7%) | 465 (51.3%) |
Sales and Office Occupations
The most common Sales and Office occupations in Custer are Office & Administration (123 | 13.6%), and Sales & Related (77 | 8.5%).

Sales and Office Occupations by Sex

| Occupation | Male | Female |
| Sales & Related | 22 (28.6%) | 55 (71.4%) |
| Office & Administration | 0 (0.0%) | 123 (100.0%) |
| Total (Category) | 22 (11.0%) | 178 (89.0%) |
| Total (Overall) | 441 (48.7%) | 465 (51.3%) |
Natural Resources, Construction and Maintenance Occupations
The most common Natural Resources, Construction and Maintenance occupations in Custer are Installation, Maintenance & Repair (59 | 6.5%), Construction & Extraction (34 | 3.7%), and Farming, Fishing & Forestry (12 | 1.3%).
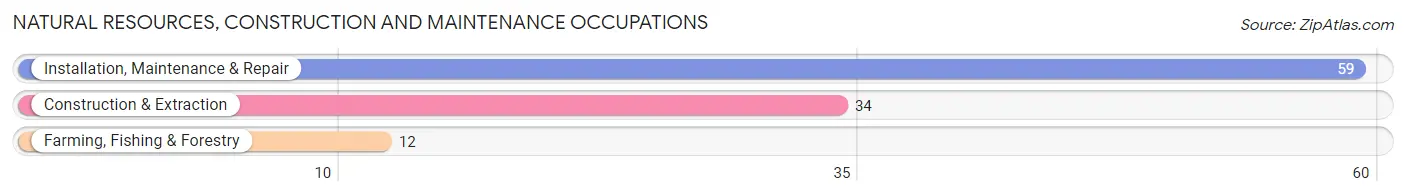
Natural Resources, Construction and Maintenance Occupations by Sex
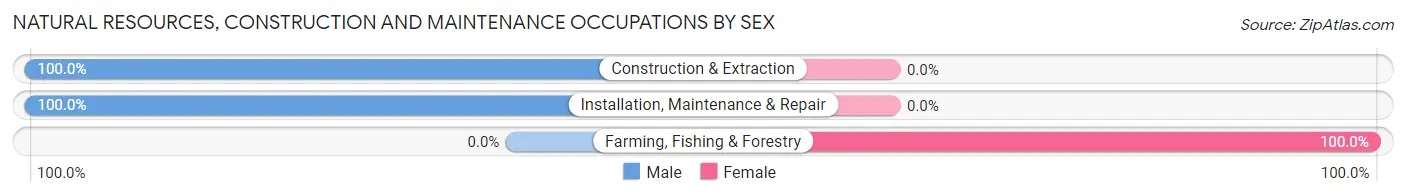
| Occupation | Male | Female |
| Farming, Fishing & Forestry | 0 (0.0%) | 12 (100.0%) |
| Construction & Extraction | 34 (100.0%) | 0 (0.0%) |
| Installation, Maintenance & Repair | 59 (100.0%) | 0 (0.0%) |
| Total (Category) | 93 (88.6%) | 12 (11.4%) |
| Total (Overall) | 441 (48.7%) | 465 (51.3%) |
Production, Transportation and Moving Occupations
The most common Production, Transportation and Moving occupations in Custer are Production (58 | 6.4%), Transportation (31 | 3.4%), and Material Moving (18 | 2.0%).
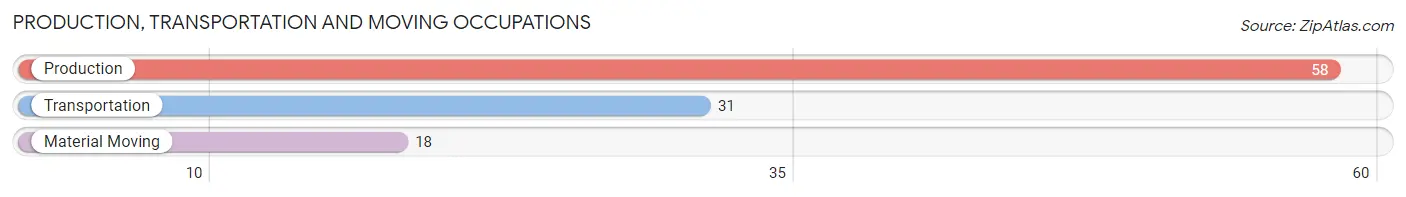
Production, Transportation and Moving Occupations by Sex
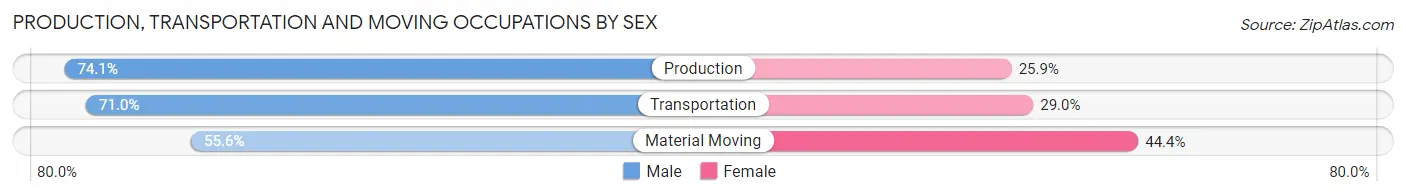
| Occupation | Male | Female |
| Production | 43 (74.1%) | 15 (25.9%) |
| Transportation | 22 (71.0%) | 9 (29.0%) |
| Material Moving | 10 (55.6%) | 8 (44.4%) |
| Total (Category) | 75 (70.1%) | 32 (29.9%) |
| Total (Overall) | 441 (48.7%) | 465 (51.3%) |
Employment Industries by Sex in Custer
Employment Industries in Custer
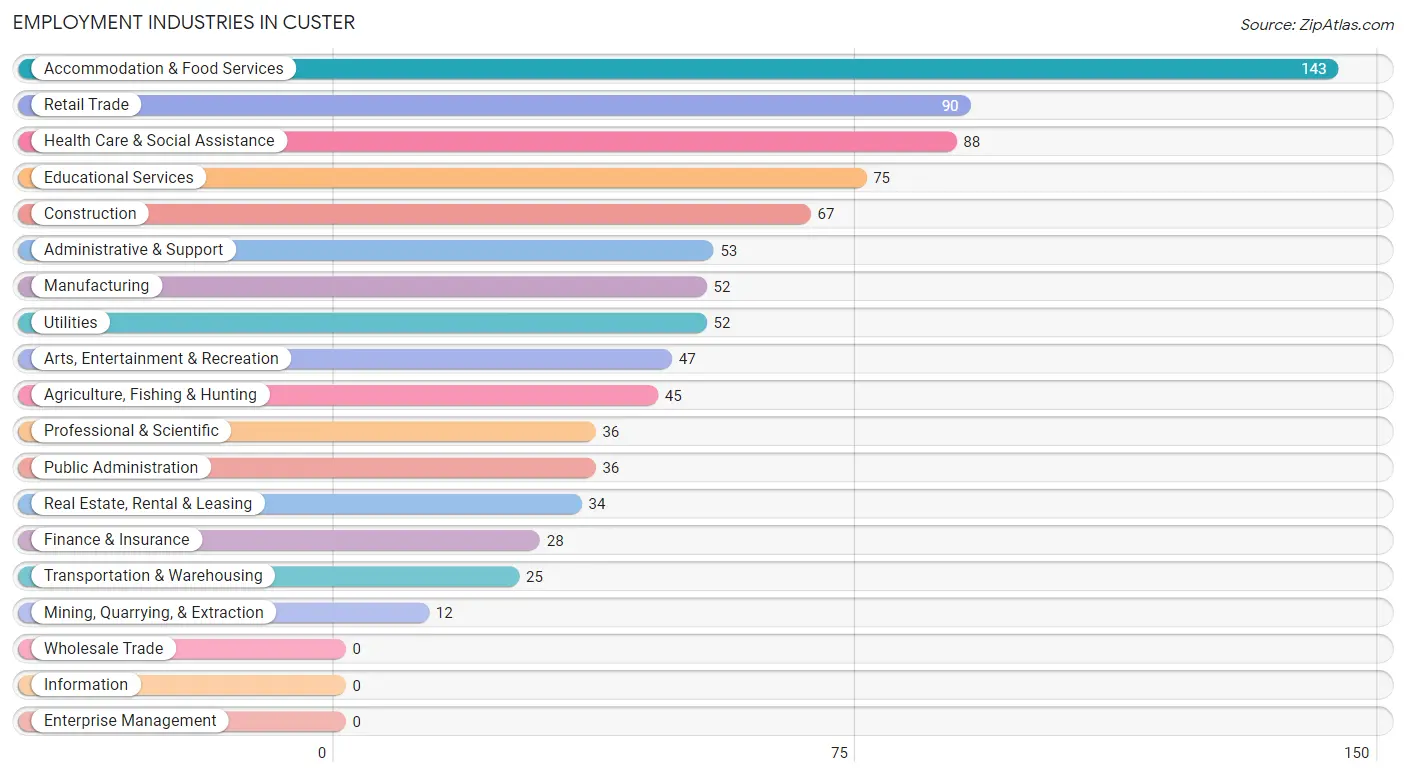
The major employment industries in Custer include Accommodation & Food Services (143 | 15.8%), Retail Trade (90 | 9.9%), Health Care & Social Assistance (88 | 9.7%), Educational Services (75 | 8.3%), and Construction (67 | 7.4%).
Employment Industries by Sex in Custer
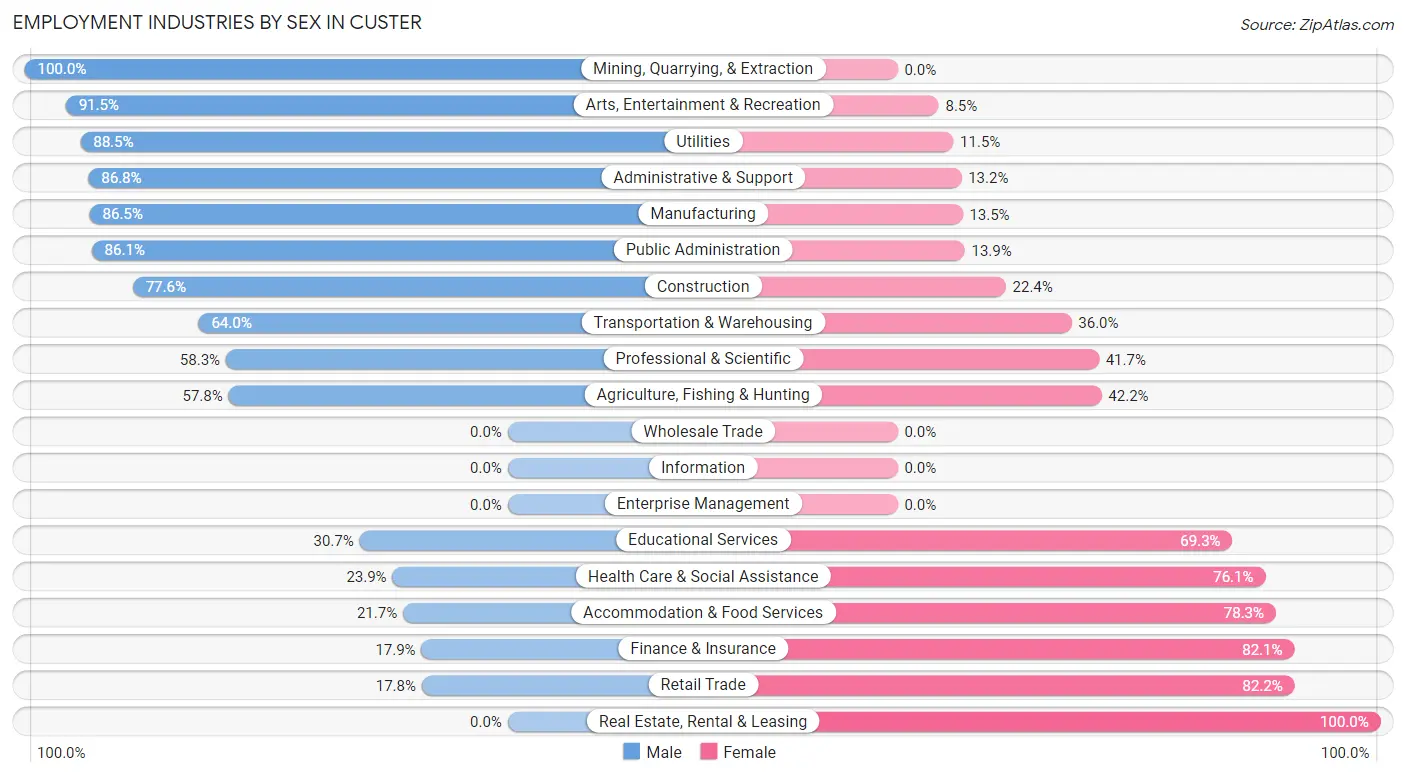
The Custer industries that see more men than women are Mining, Quarrying, & Extraction (100.0%), Arts, Entertainment & Recreation (91.5%), and Utilities (88.5%), whereas the industries that tend to have a higher number of women are Real Estate, Rental & Leasing (100.0%), Retail Trade (82.2%), and Finance & Insurance (82.1%).
| Industry | Male | Female |
| Agriculture, Fishing & Hunting | 26 (57.8%) | 19 (42.2%) |
| Mining, Quarrying, & Extraction | 12 (100.0%) | 0 (0.0%) |
| Construction | 52 (77.6%) | 15 (22.4%) |
| Manufacturing | 45 (86.5%) | 7 (13.5%) |
| Wholesale Trade | 0 (0.0%) | 0 (0.0%) |
| Retail Trade | 16 (17.8%) | 74 (82.2%) |
| Transportation & Warehousing | 16 (64.0%) | 9 (36.0%) |
| Utilities | 46 (88.5%) | 6 (11.5%) |
| Information | 0 (0.0%) | 0 (0.0%) |
| Finance & Insurance | 5 (17.9%) | 23 (82.1%) |
| Real Estate, Rental & Leasing | 0 (0.0%) | 34 (100.0%) |
| Professional & Scientific | 21 (58.3%) | 15 (41.7%) |
| Enterprise Management | 0 (0.0%) | 0 (0.0%) |
| Administrative & Support | 46 (86.8%) | 7 (13.2%) |
| Educational Services | 23 (30.7%) | 52 (69.3%) |
| Health Care & Social Assistance | 21 (23.9%) | 67 (76.1%) |
| Arts, Entertainment & Recreation | 43 (91.5%) | 4 (8.5%) |
| Accommodation & Food Services | 31 (21.7%) | 112 (78.3%) |
| Public Administration | 31 (86.1%) | 5 (13.9%) |
| Total | 441 (48.7%) | 465 (51.3%) |
Education in Custer
School Enrollment in Custer
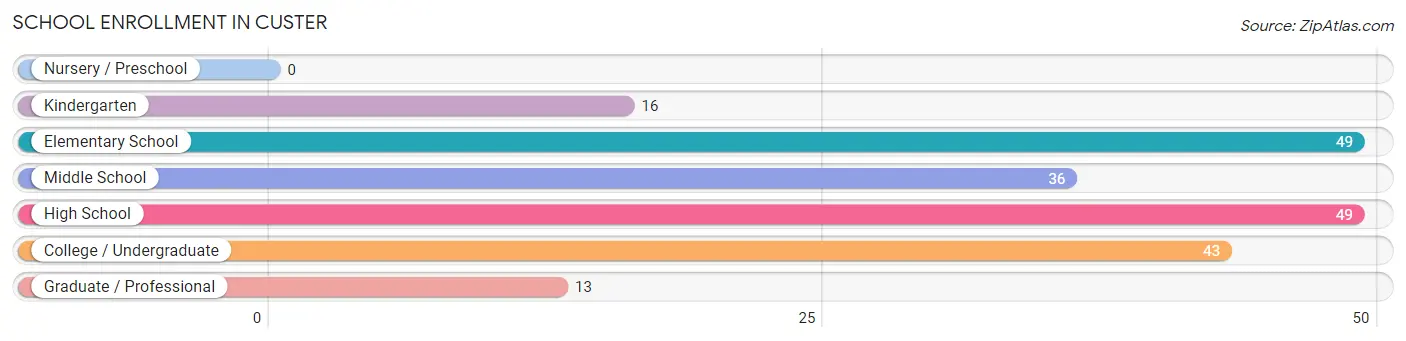
The most common levels of schooling among the 206 students in Custer are elementary school (49 | 23.8%), high school (49 | 23.8%), and college / undergraduate (43 | 20.9%).
| School Level | # Students | % Students |
| Nursery / Preschool | 0 | 0.0% |
| Kindergarten | 16 | 7.8% |
| Elementary School | 49 | 23.8% |
| Middle School | 36 | 17.5% |
| High School | 49 | 23.8% |
| College / Undergraduate | 43 | 20.9% |
| Graduate / Professional | 13 | 6.3% |
| Total | 206 | 100.0% |
School Enrollment by Age by Funding Source in Custer
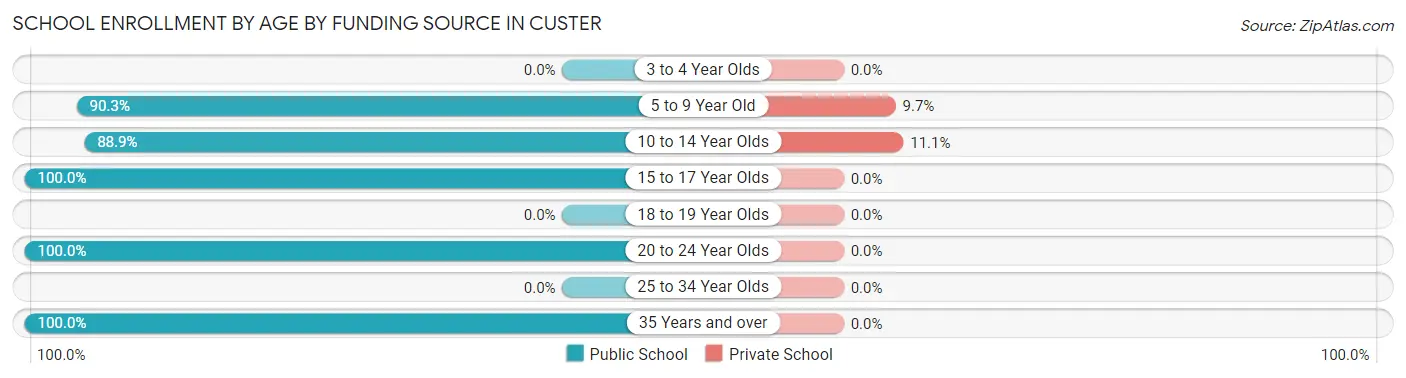
Out of a total of 206 students who are enrolled in schools in Custer, 11 (5.3%) attend a private institution, while the remaining 195 (94.7%) are enrolled in public schools. The age group of 10 to 14 year olds has the highest likelihood of being enrolled in private schools, with 5 (11.1% in the age bracket) enrolled. Conversely, the age group of 15 to 17 year olds has the lowest likelihood of being enrolled in a private school, with 43 (100.0% in the age bracket) attending a public institution.
| Age Bracket | Public School | Private School |
| 3 to 4 Year Olds | 0 (0.0%) | 0 (0.0%) |
| 5 to 9 Year Old | 56 (90.3%) | 6 (9.7%) |
| 10 to 14 Year Olds | 40 (88.9%) | 5 (11.1%) |
| 15 to 17 Year Olds | 43 (100.0%) | 0 (0.0%) |
| 18 to 19 Year Olds | 0 (0.0%) | 0 (0.0%) |
| 20 to 24 Year Olds | 31 (100.0%) | 0 (0.0%) |
| 25 to 34 Year Olds | 0 (0.0%) | 0 (0.0%) |
| 35 Years and over | 25 (100.0%) | 0 (0.0%) |
| Total | 195 (94.7%) | 11 (5.3%) |
Educational Attainment by Field of Study in Custer
Education (134 | 27.1%), bio, nature & agricultural (92 | 18.6%), business (46 | 9.3%), science & technology (40 | 8.1%), and arts & humanities (36 | 7.3%) are the most common fields of study among 494 individuals in Custer who have obtained a bachelor's degree or higher.
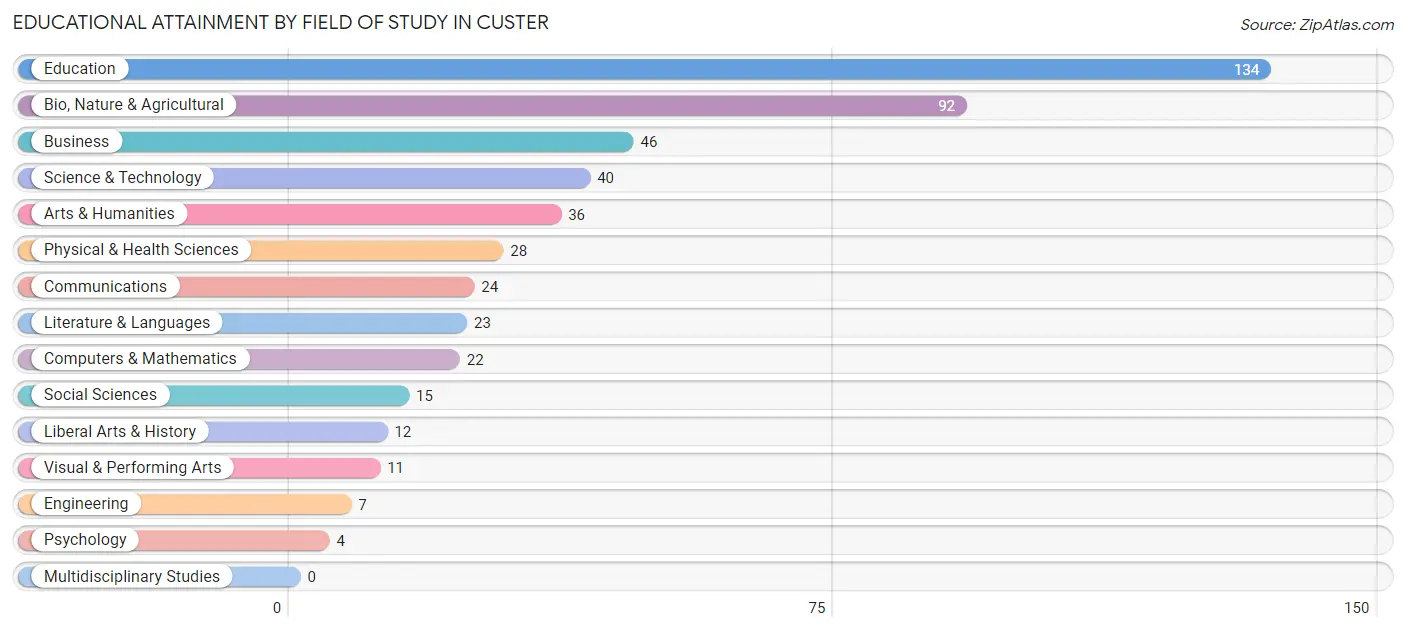
| Field of Study | # Graduates | % Graduates |
| Computers & Mathematics | 22 | 4.4% |
| Bio, Nature & Agricultural | 92 | 18.6% |
| Physical & Health Sciences | 28 | 5.7% |
| Psychology | 4 | 0.8% |
| Social Sciences | 15 | 3.0% |
| Engineering | 7 | 1.4% |
| Multidisciplinary Studies | 0 | 0.0% |
| Science & Technology | 40 | 8.1% |
| Business | 46 | 9.3% |
| Education | 134 | 27.1% |
| Literature & Languages | 23 | 4.7% |
| Liberal Arts & History | 12 | 2.4% |
| Visual & Performing Arts | 11 | 2.2% |
| Communications | 24 | 4.9% |
| Arts & Humanities | 36 | 7.3% |
| Total | 494 | 100.0% |
Transportation & Commute in Custer
Vehicle Availability by Sex in Custer
The most prevalent vehicle ownership categories in Custer are males with 2 vehicles (227, accounting for 51.5%) and females with 2 vehicles (212, making up 50.1%).
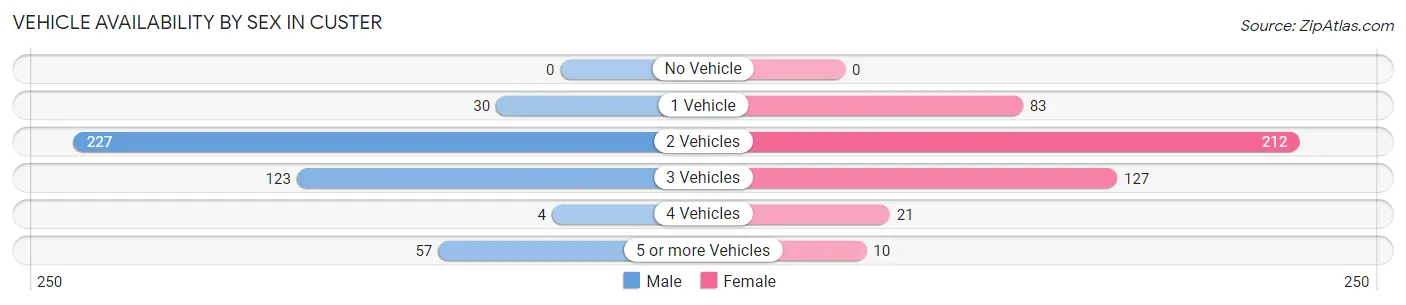
| Vehicles Available | Male | Female |
| No Vehicle | 0 (0.0%) | 0 (0.0%) |
| 1 Vehicle | 30 (6.8%) | 83 (18.3%) |
| 2 Vehicles | 227 (51.5%) | 212 (46.8%) |
| 3 Vehicles | 123 (27.9%) | 127 (28.0%) |
| 4 Vehicles | 4 (0.9%) | 21 (4.6%) |
| 5 or more Vehicles | 57 (12.9%) | 10 (2.2%) |
| Total | 441 (100.0%) | 453 (100.0%) |
Commute Time in Custer
The most frequently occuring commute durations in Custer are 5 to 9 minutes (275 commuters, 33.2%), less than 5 minutes (156 commuters, 18.8%), and 10 to 14 minutes (83 commuters, 10.0%).
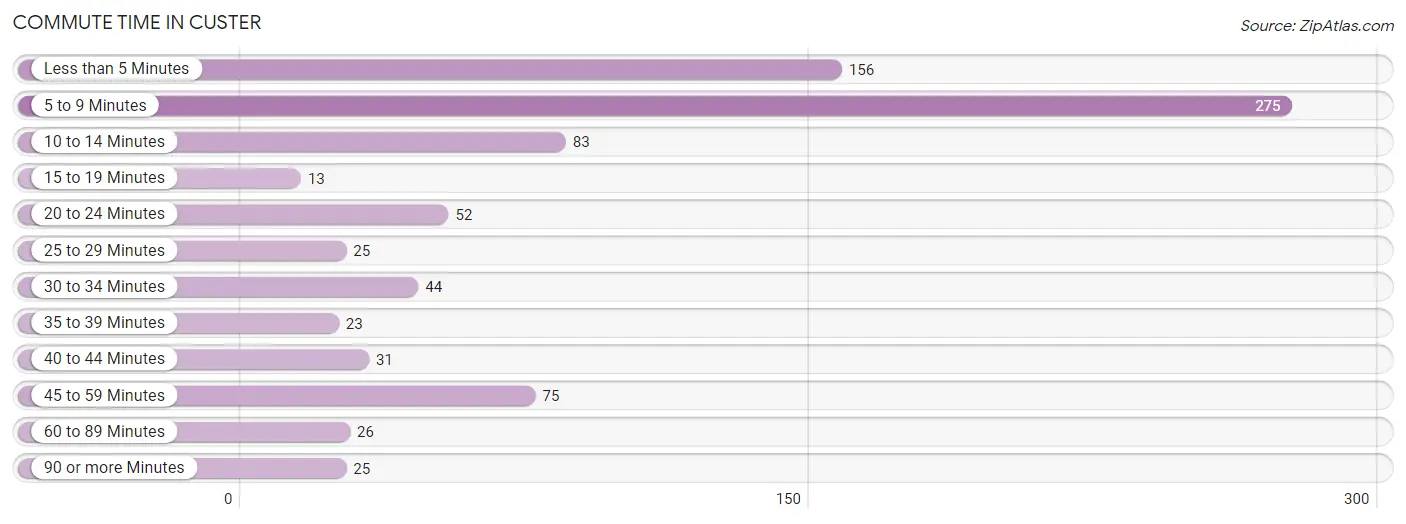
| Commute Time | # Commuters | % Commuters |
| Less than 5 Minutes | 156 | 18.8% |
| 5 to 9 Minutes | 275 | 33.2% |
| 10 to 14 Minutes | 83 | 10.0% |
| 15 to 19 Minutes | 13 | 1.6% |
| 20 to 24 Minutes | 52 | 6.3% |
| 25 to 29 Minutes | 25 | 3.0% |
| 30 to 34 Minutes | 44 | 5.3% |
| 35 to 39 Minutes | 23 | 2.8% |
| 40 to 44 Minutes | 31 | 3.7% |
| 45 to 59 Minutes | 75 | 9.1% |
| 60 to 89 Minutes | 26 | 3.1% |
| 90 or more Minutes | 25 | 3.0% |
Commute Time by Sex in Custer
The most common commute times in Custer are 5 to 9 minutes (105 commuters, 25.2%) for males and 5 to 9 minutes (170 commuters, 41.3%) for females.
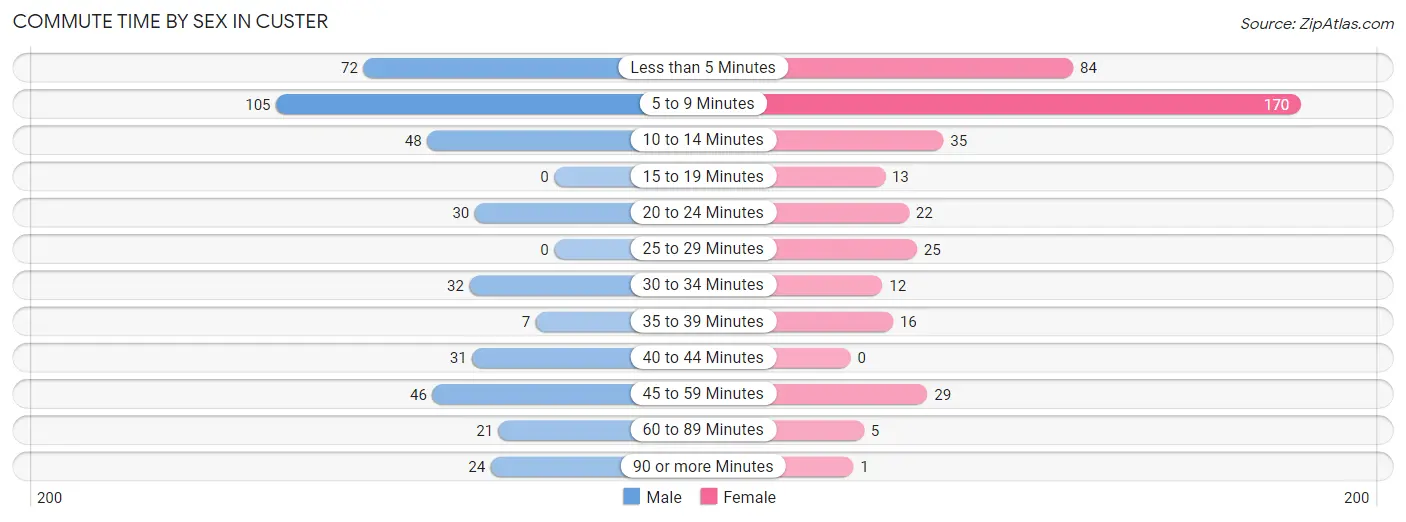
| Commute Time | Male | Female |
| Less than 5 Minutes | 72 (17.3%) | 84 (20.4%) |
| 5 to 9 Minutes | 105 (25.2%) | 170 (41.3%) |
| 10 to 14 Minutes | 48 (11.5%) | 35 (8.5%) |
| 15 to 19 Minutes | 0 (0.0%) | 13 (3.2%) |
| 20 to 24 Minutes | 30 (7.2%) | 22 (5.3%) |
| 25 to 29 Minutes | 0 (0.0%) | 25 (6.1%) |
| 30 to 34 Minutes | 32 (7.7%) | 12 (2.9%) |
| 35 to 39 Minutes | 7 (1.7%) | 16 (3.9%) |
| 40 to 44 Minutes | 31 (7.4%) | 0 (0.0%) |
| 45 to 59 Minutes | 46 (11.1%) | 29 (7.0%) |
| 60 to 89 Minutes | 21 (5.1%) | 5 (1.2%) |
| 90 or more Minutes | 24 (5.8%) | 1 (0.2%) |
Time of Departure to Work by Sex in Custer
The most frequent times of departure to work in Custer are 7:30 AM to 7:59 AM (77, 18.5%) for males and 7:00 AM to 7:29 AM (87, 21.1%) for females.
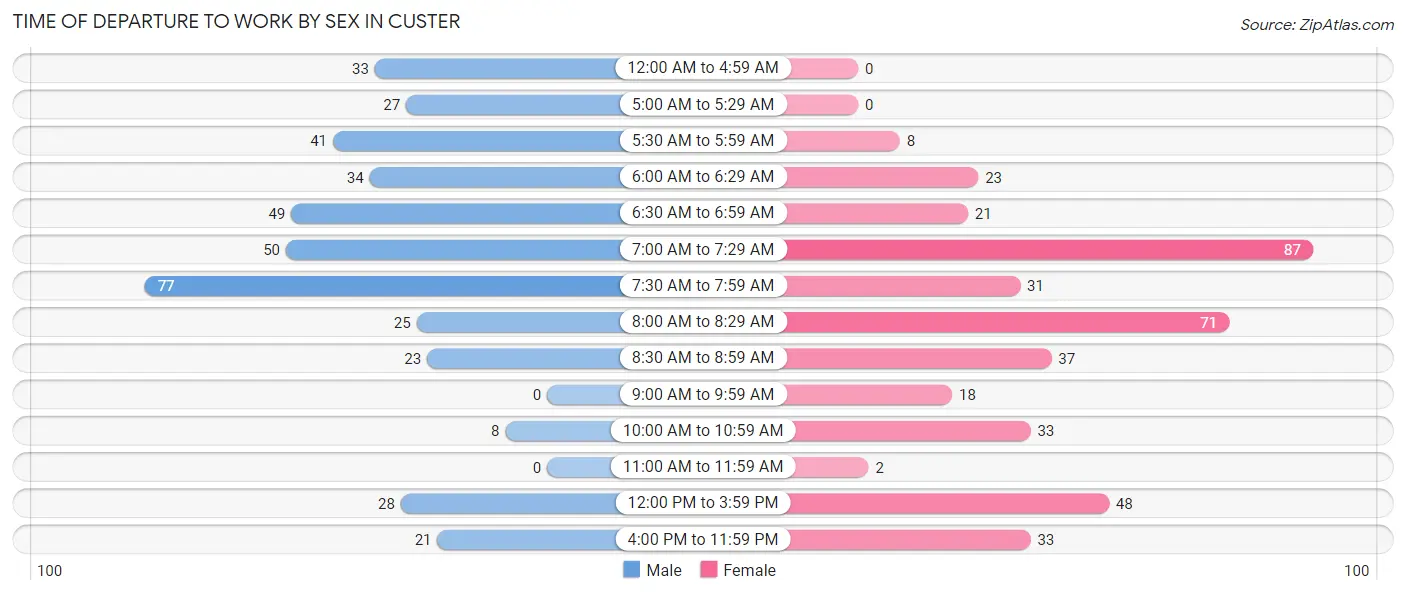
| Time of Departure | Male | Female |
| 12:00 AM to 4:59 AM | 33 (7.9%) | 0 (0.0%) |
| 5:00 AM to 5:29 AM | 27 (6.5%) | 0 (0.0%) |
| 5:30 AM to 5:59 AM | 41 (9.9%) | 8 (1.9%) |
| 6:00 AM to 6:29 AM | 34 (8.2%) | 23 (5.6%) |
| 6:30 AM to 6:59 AM | 49 (11.8%) | 21 (5.1%) |
| 7:00 AM to 7:29 AM | 50 (12.0%) | 87 (21.1%) |
| 7:30 AM to 7:59 AM | 77 (18.5%) | 31 (7.5%) |
| 8:00 AM to 8:29 AM | 25 (6.0%) | 71 (17.2%) |
| 8:30 AM to 8:59 AM | 23 (5.5%) | 37 (9.0%) |
| 9:00 AM to 9:59 AM | 0 (0.0%) | 18 (4.4%) |
| 10:00 AM to 10:59 AM | 8 (1.9%) | 33 (8.0%) |
| 11:00 AM to 11:59 AM | 0 (0.0%) | 2 (0.5%) |
| 12:00 PM to 3:59 PM | 28 (6.7%) | 48 (11.7%) |
| 4:00 PM to 11:59 PM | 21 (5.1%) | 33 (8.0%) |
| Total | 416 (100.0%) | 412 (100.0%) |
Housing Occupancy in Custer
Occupancy by Ownership in Custer
Of the total 983 dwellings in Custer, owner-occupied units account for 639 (65.0%), while renter-occupied units make up 344 (35.0%).
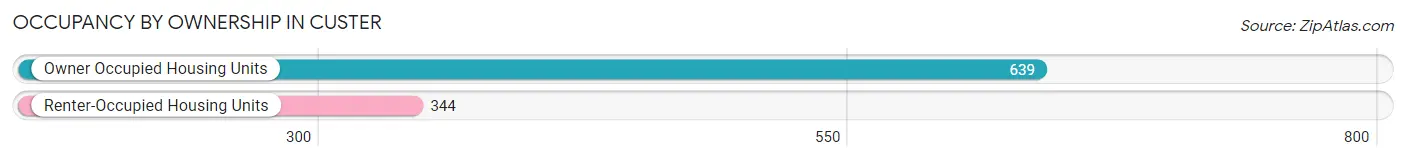
| Occupancy | # Housing Units | % Housing Units |
| Owner Occupied Housing Units | 639 | 65.0% |
| Renter-Occupied Housing Units | 344 | 35.0% |
| Total Occupied Housing Units | 983 | 100.0% |
Occupancy by Household Size in Custer
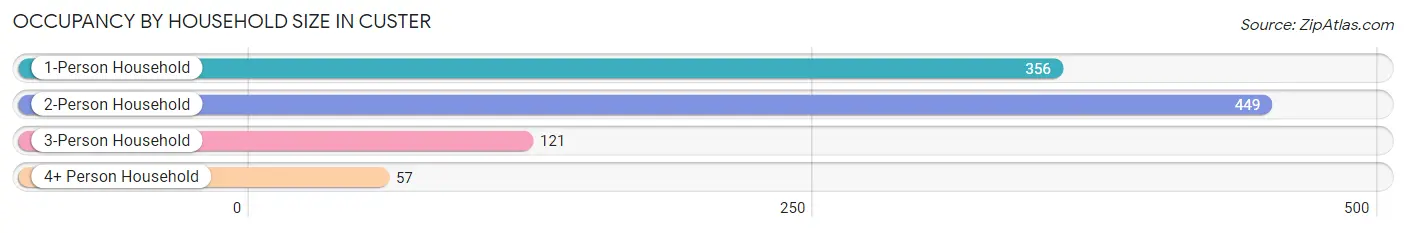
| Household Size | # Housing Units | % Housing Units |
| 1-Person Household | 356 | 36.2% |
| 2-Person Household | 449 | 45.7% |
| 3-Person Household | 121 | 12.3% |
| 4+ Person Household | 57 | 5.8% |
| Total Housing Units | 983 | 100.0% |
Occupancy by Ownership by Household Size in Custer
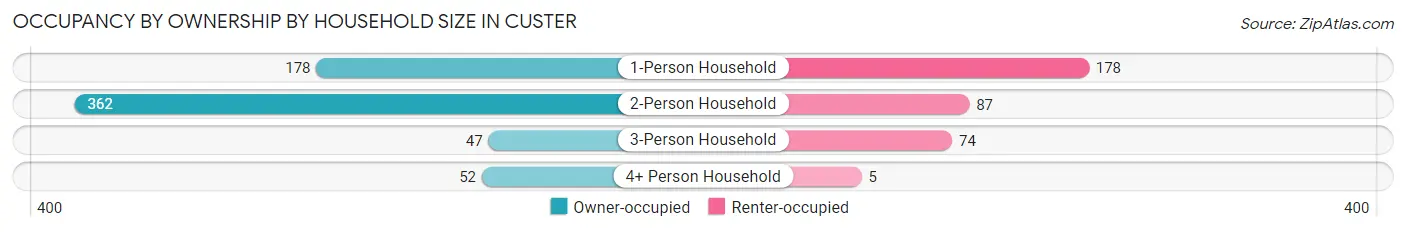
| Household Size | Owner-occupied | Renter-occupied |
| 1-Person Household | 178 (50.0%) | 178 (50.0%) |
| 2-Person Household | 362 (80.6%) | 87 (19.4%) |
| 3-Person Household | 47 (38.8%) | 74 (61.2%) |
| 4+ Person Household | 52 (91.2%) | 5 (8.8%) |
| Total Housing Units | 639 (65.0%) | 344 (35.0%) |
Occupancy by Educational Attainment in Custer
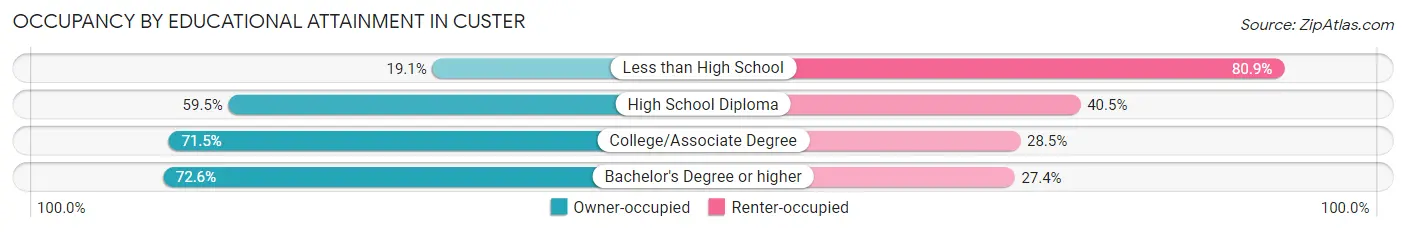
| Household Size | Owner-occupied | Renter-occupied |
| Less than High School | 13 (19.1%) | 55 (80.9%) |
| High School Diploma | 156 (59.5%) | 106 (40.5%) |
| College/Associate Degree | 253 (71.5%) | 101 (28.5%) |
| Bachelor's Degree or higher | 217 (72.6%) | 82 (27.4%) |
Occupancy by Age of Householder in Custer
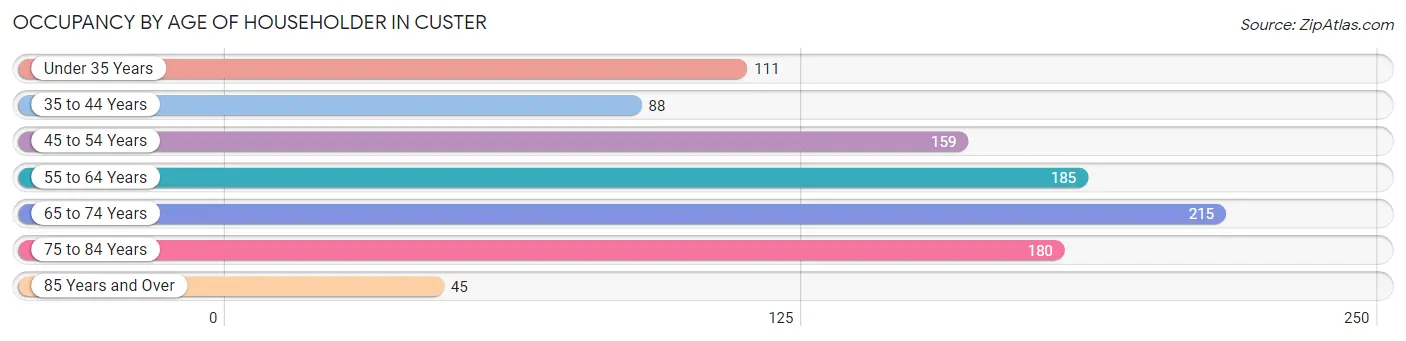
| Age Bracket | # Households | % Households |
| Under 35 Years | 111 | 11.3% |
| 35 to 44 Years | 88 | 8.9% |
| 45 to 54 Years | 159 | 16.2% |
| 55 to 64 Years | 185 | 18.8% |
| 65 to 74 Years | 215 | 21.9% |
| 75 to 84 Years | 180 | 18.3% |
| 85 Years and Over | 45 | 4.6% |
| Total | 983 | 100.0% |
Housing Finances in Custer
Median Income by Occupancy in Custer
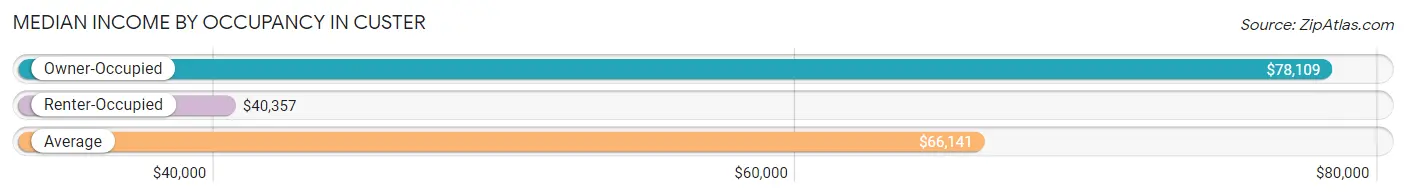
| Occupancy Type | # Households | Median Income |
| Owner-Occupied | 639 (65.0%) | $78,109 |
| Renter-Occupied | 344 (35.0%) | $40,357 |
| Average | 983 (100.0%) | $66,141 |
Occupancy by Householder Income Bracket in Custer
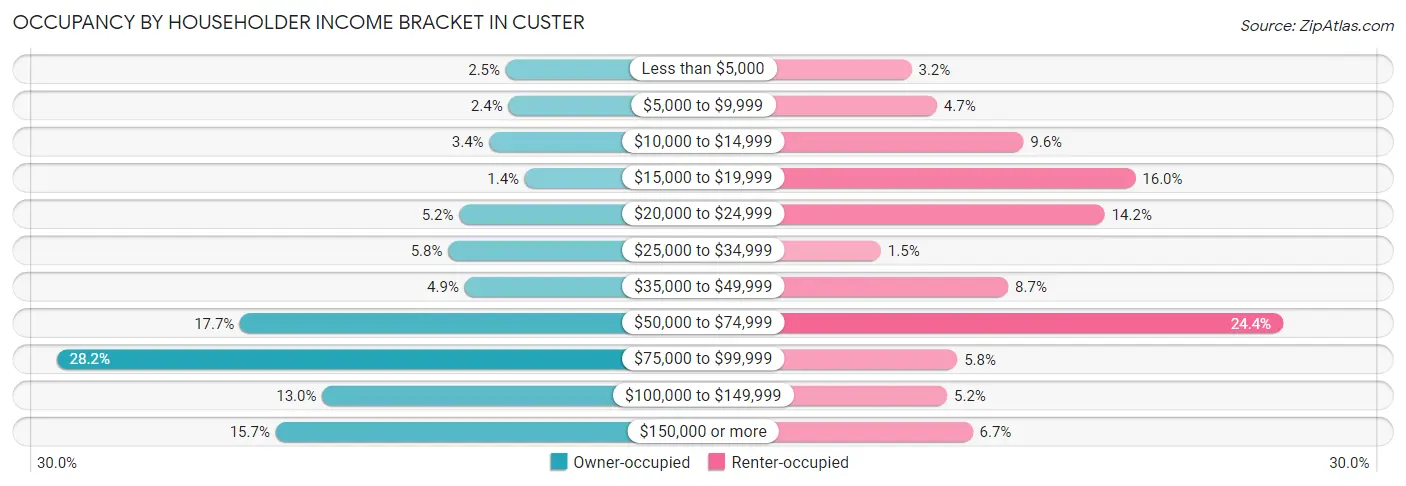
| Income Bracket | Owner-occupied | Renter-occupied |
| Less than $5,000 | 16 (2.5%) | 11 (3.2%) |
| $5,000 to $9,999 | 15 (2.4%) | 16 (4.6%) |
| $10,000 to $14,999 | 22 (3.4%) | 33 (9.6%) |
| $15,000 to $19,999 | 9 (1.4%) | 55 (16.0%) |
| $20,000 to $24,999 | 33 (5.2%) | 49 (14.2%) |
| $25,000 to $34,999 | 37 (5.8%) | 5 (1.5%) |
| $35,000 to $49,999 | 31 (4.9%) | 30 (8.7%) |
| $50,000 to $74,999 | 113 (17.7%) | 84 (24.4%) |
| $75,000 to $99,999 | 180 (28.2%) | 20 (5.8%) |
| $100,000 to $149,999 | 83 (13.0%) | 18 (5.2%) |
| $150,000 or more | 100 (15.7%) | 23 (6.7%) |
| Total | 639 (100.0%) | 344 (100.0%) |
Monthly Housing Cost Tiers in Custer
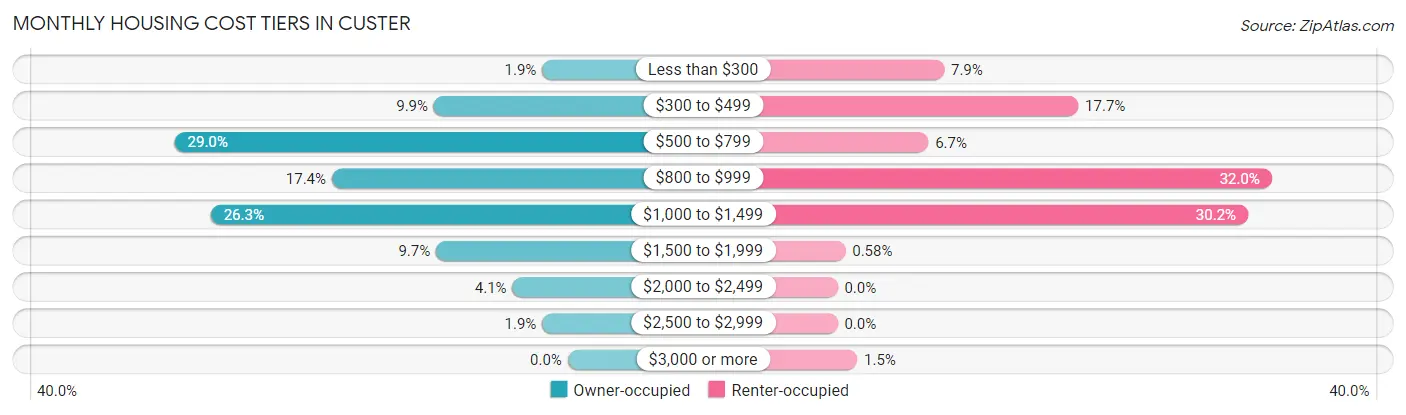
| Monthly Cost | Owner-occupied | Renter-occupied |
| Less than $300 | 12 (1.9%) | 27 (7.9%) |
| $300 to $499 | 63 (9.9%) | 61 (17.7%) |
| $500 to $799 | 185 (28.9%) | 23 (6.7%) |
| $800 to $999 | 111 (17.4%) | 110 (32.0%) |
| $1,000 to $1,499 | 168 (26.3%) | 104 (30.2%) |
| $1,500 to $1,999 | 62 (9.7%) | 2 (0.6%) |
| $2,000 to $2,499 | 26 (4.1%) | 0 (0.0%) |
| $2,500 to $2,999 | 12 (1.9%) | 0 (0.0%) |
| $3,000 or more | 0 (0.0%) | 5 (1.5%) |
| Total | 639 (100.0%) | 344 (100.0%) |
Physical Housing Characteristics in Custer
Housing Structures in Custer
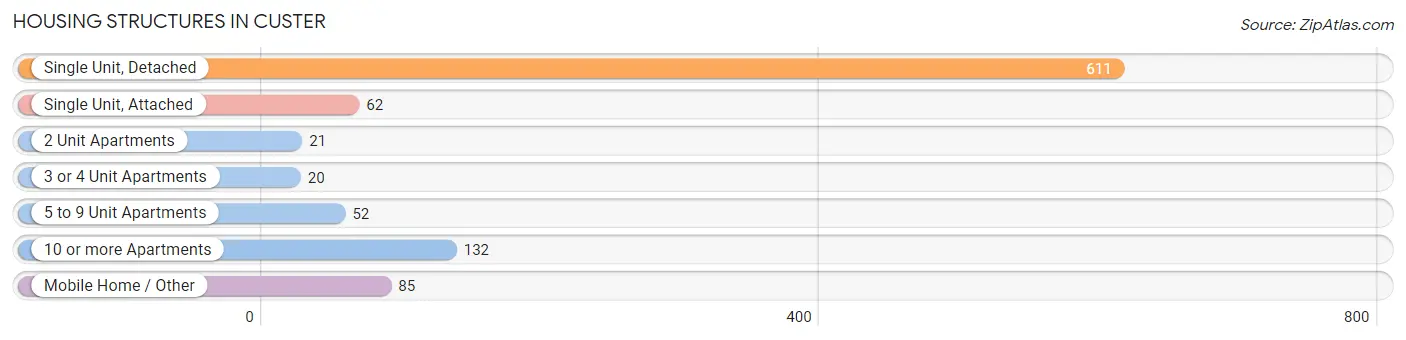
| Structure Type | # Housing Units | % Housing Units |
| Single Unit, Detached | 611 | 62.2% |
| Single Unit, Attached | 62 | 6.3% |
| 2 Unit Apartments | 21 | 2.1% |
| 3 or 4 Unit Apartments | 20 | 2.0% |
| 5 to 9 Unit Apartments | 52 | 5.3% |
| 10 or more Apartments | 132 | 13.4% |
| Mobile Home / Other | 85 | 8.6% |
| Total | 983 | 100.0% |
Housing Structures by Occupancy in Custer
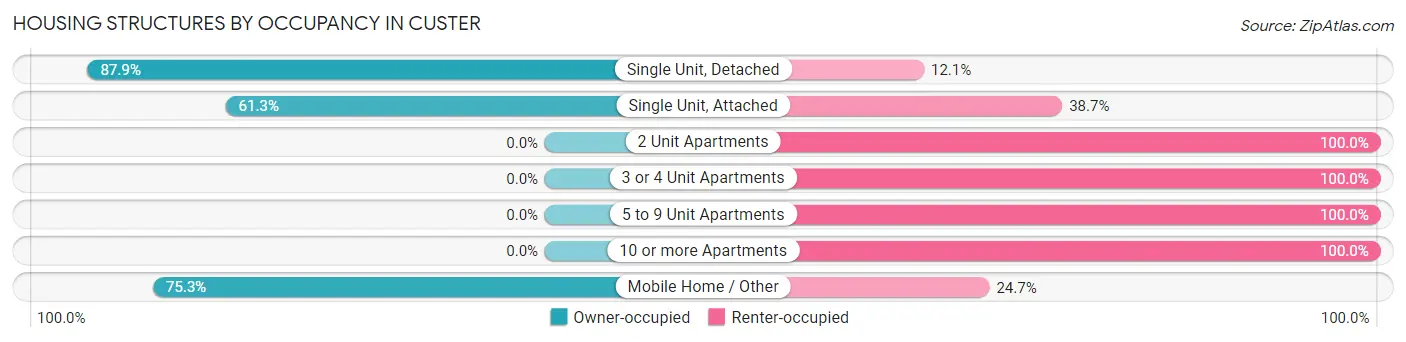
| Structure Type | Owner-occupied | Renter-occupied |
| Single Unit, Detached | 537 (87.9%) | 74 (12.1%) |
| Single Unit, Attached | 38 (61.3%) | 24 (38.7%) |
| 2 Unit Apartments | 0 (0.0%) | 21 (100.0%) |
| 3 or 4 Unit Apartments | 0 (0.0%) | 20 (100.0%) |
| 5 to 9 Unit Apartments | 0 (0.0%) | 52 (100.0%) |
| 10 or more Apartments | 0 (0.0%) | 132 (100.0%) |
| Mobile Home / Other | 64 (75.3%) | 21 (24.7%) |
| Total | 639 (65.0%) | 344 (35.0%) |
Housing Structures by Number of Rooms in Custer
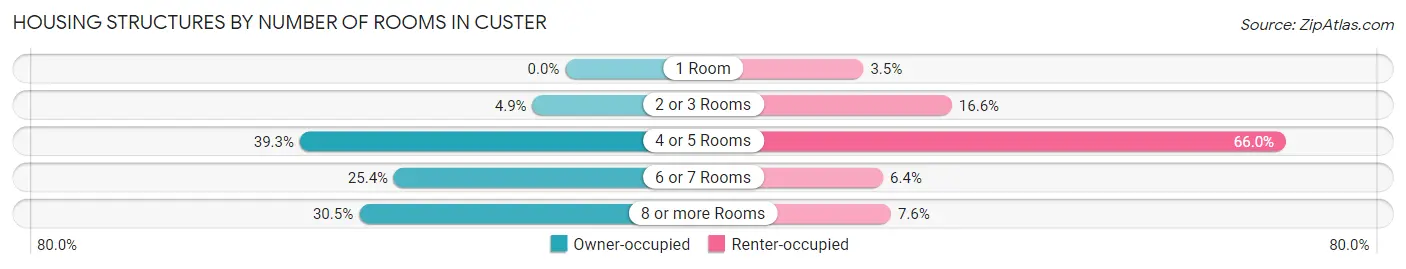
| Number of Rooms | Owner-occupied | Renter-occupied |
| 1 Room | 0 (0.0%) | 12 (3.5%) |
| 2 or 3 Rooms | 31 (4.9%) | 57 (16.6%) |
| 4 or 5 Rooms | 251 (39.3%) | 227 (66.0%) |
| 6 or 7 Rooms | 162 (25.4%) | 22 (6.4%) |
| 8 or more Rooms | 195 (30.5%) | 26 (7.6%) |
| Total | 639 (100.0%) | 344 (100.0%) |
Housing Structure by Heating Type in Custer
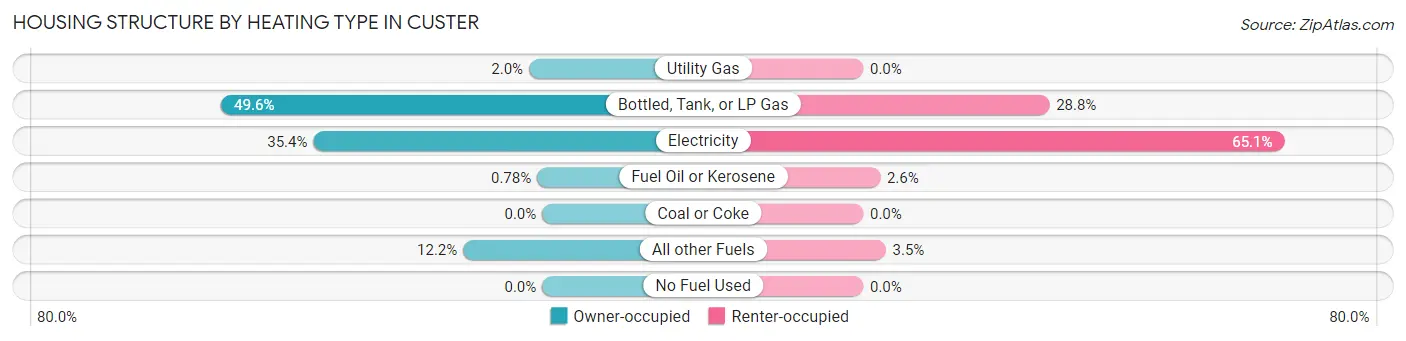
| Heating Type | Owner-occupied | Renter-occupied |
| Utility Gas | 13 (2.0%) | 0 (0.0%) |
| Bottled, Tank, or LP Gas | 317 (49.6%) | 99 (28.8%) |
| Electricity | 226 (35.4%) | 224 (65.1%) |
| Fuel Oil or Kerosene | 5 (0.8%) | 9 (2.6%) |
| Coal or Coke | 0 (0.0%) | 0 (0.0%) |
| All other Fuels | 78 (12.2%) | 12 (3.5%) |
| No Fuel Used | 0 (0.0%) | 0 (0.0%) |
| Total | 639 (100.0%) | 344 (100.0%) |
Household Vehicle Usage in Custer
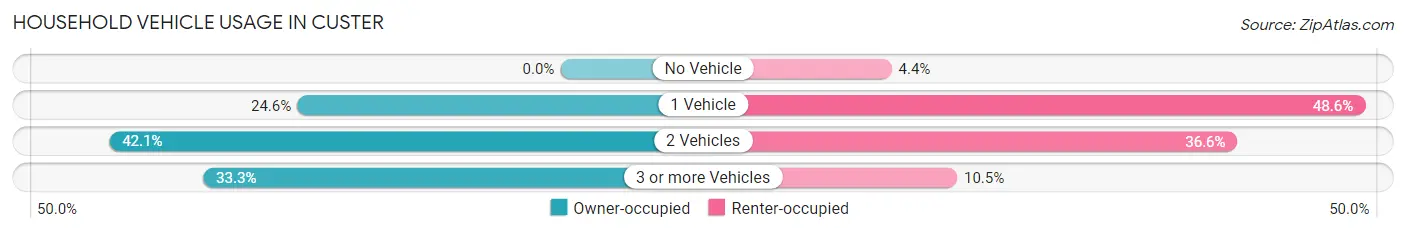
| Vehicles per Household | Owner-occupied | Renter-occupied |
| No Vehicle | 0 (0.0%) | 15 (4.4%) |
| 1 Vehicle | 157 (24.6%) | 167 (48.5%) |
| 2 Vehicles | 269 (42.1%) | 126 (36.6%) |
| 3 or more Vehicles | 213 (33.3%) | 36 (10.5%) |
| Total | 639 (100.0%) | 344 (100.0%) |
Real Estate & Mortgages in Custer
Real Estate and Mortgage Overview in Custer
| Characteristic | Without Mortgage | With Mortgage |
| Housing Units | 339 | 300 |
| Median Property Value | $176,900 | $196,000 |
| Median Household Income | $59,886 | $83 |
| Monthly Housing Costs | $666 | $0 |
| Real Estate Taxes | $2,119 | $6 |
Property Value by Mortgage Status in Custer
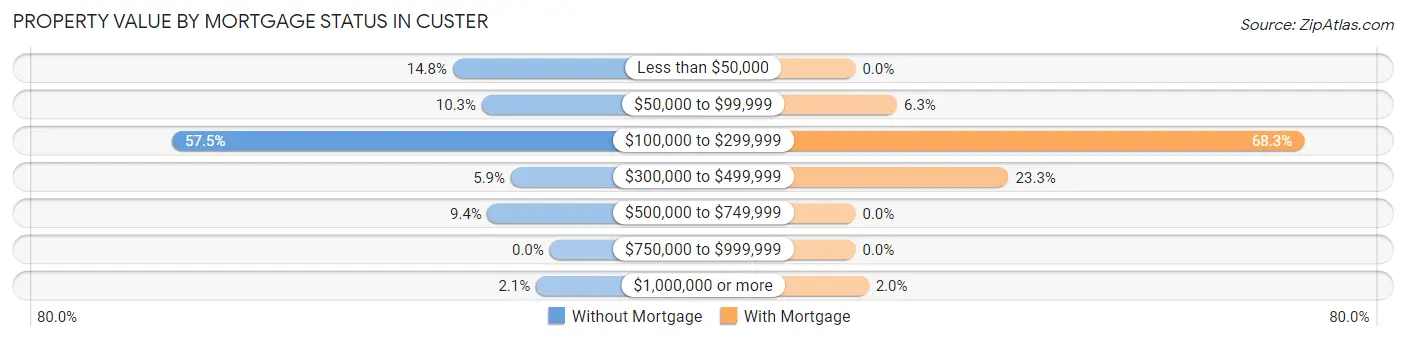
| Property Value | Without Mortgage | With Mortgage |
| Less than $50,000 | 50 (14.7%) | 0 (0.0%) |
| $50,000 to $99,999 | 35 (10.3%) | 19 (6.3%) |
| $100,000 to $299,999 | 195 (57.5%) | 205 (68.3%) |
| $300,000 to $499,999 | 20 (5.9%) | 70 (23.3%) |
| $500,000 to $749,999 | 32 (9.4%) | 0 (0.0%) |
| $750,000 to $999,999 | 0 (0.0%) | 0 (0.0%) |
| $1,000,000 or more | 7 (2.1%) | 6 (2.0%) |
| Total | 339 (100.0%) | 300 (100.0%) |
Household Income by Mortgage Status in Custer
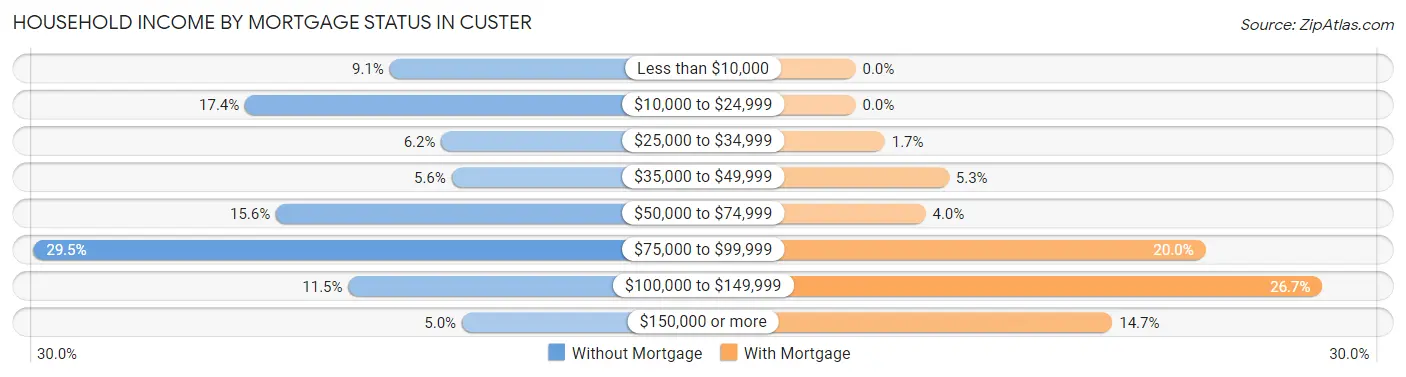
| Household Income | Without Mortgage | With Mortgage |
| Less than $10,000 | 31 (9.1%) | 0 (0.0%) |
| $10,000 to $24,999 | 59 (17.4%) | 0 (0.0%) |
| $25,000 to $34,999 | 21 (6.2%) | 5 (1.7%) |
| $35,000 to $49,999 | 19 (5.6%) | 16 (5.3%) |
| $50,000 to $74,999 | 53 (15.6%) | 12 (4.0%) |
| $75,000 to $99,999 | 100 (29.5%) | 60 (20.0%) |
| $100,000 to $149,999 | 39 (11.5%) | 80 (26.7%) |
| $150,000 or more | 17 (5.0%) | 44 (14.7%) |
| Total | 339 (100.0%) | 300 (100.0%) |
Property Value to Household Income Ratio in Custer
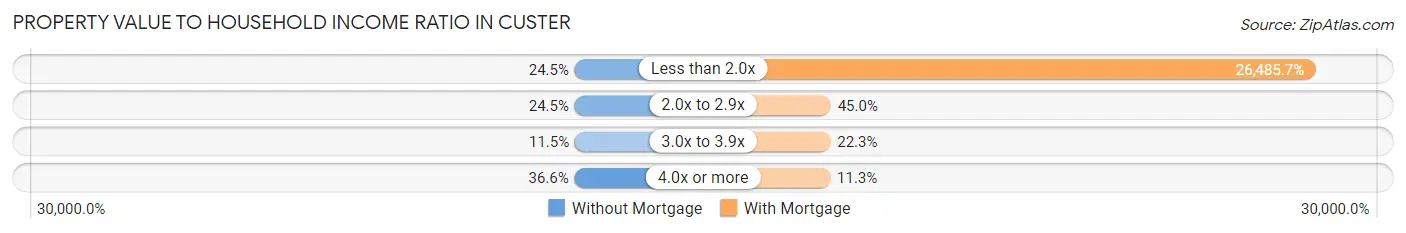
| Value-to-Income Ratio | Without Mortgage | With Mortgage |
| Less than 2.0x | 83 (24.5%) | 79,457 (26,485.7%) |
| 2.0x to 2.9x | 83 (24.5%) | 135 (45.0%) |
| 3.0x to 3.9x | 39 (11.5%) | 67 (22.3%) |
| 4.0x or more | 124 (36.6%) | 34 (11.3%) |
| Total | 339 (100.0%) | 300 (100.0%) |
Real Estate Taxes by Mortgage Status in Custer
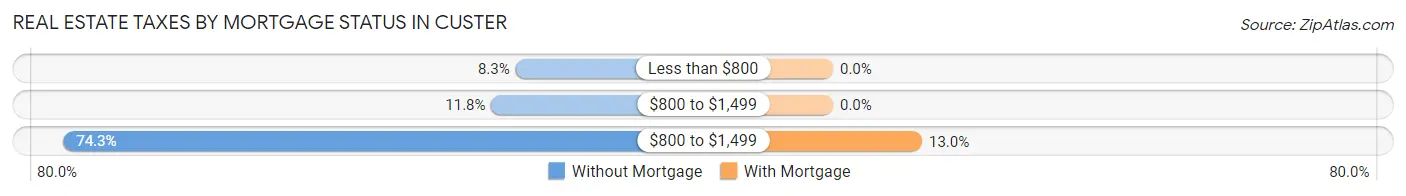
| Property Taxes | Without Mortgage | With Mortgage |
| Less than $800 | 28 (8.3%) | 0 (0.0%) |
| $800 to $1,499 | 40 (11.8%) | 0 (0.0%) |
| $800 to $1,499 | 252 (74.3%) | 39 (13.0%) |
| Total | 339 (100.0%) | 300 (100.0%) |
Health & Disability in Custer
Health Insurance Coverage by Age in Custer
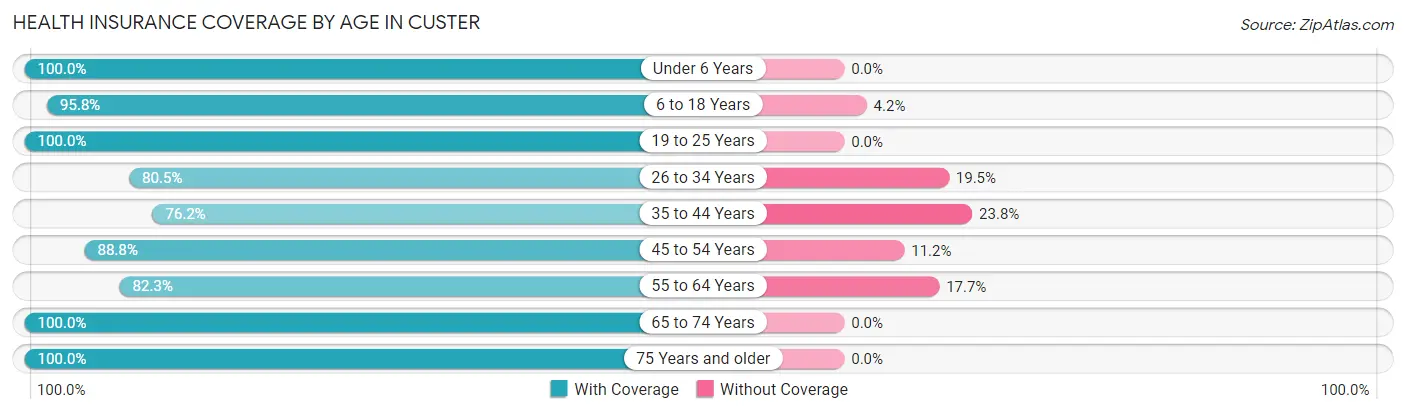
| Age Bracket | With Coverage | Without Coverage |
| Under 6 Years | 93 (100.0%) | 0 (0.0%) |
| 6 to 18 Years | 161 (95.8%) | 7 (4.2%) |
| 19 to 25 Years | 138 (100.0%) | 0 (0.0%) |
| 26 to 34 Years | 128 (80.5%) | 31 (19.5%) |
| 35 to 44 Years | 115 (76.2%) | 36 (23.8%) |
| 45 to 54 Years | 238 (88.8%) | 30 (11.2%) |
| 55 to 64 Years | 265 (82.3%) | 57 (17.7%) |
| 65 to 74 Years | 306 (100.0%) | 0 (0.0%) |
| 75 Years and older | 331 (100.0%) | 0 (0.0%) |
| Total | 1,775 (91.7%) | 161 (8.3%) |
Health Insurance Coverage by Citizenship Status in Custer

| Citizenship Status | With Coverage | Without Coverage |
| Native Born | 93 (100.0%) | 0 (0.0%) |
| Foreign Born, Citizen | 161 (95.8%) | 7 (4.2%) |
| Foreign Born, not a Citizen | 138 (100.0%) | 0 (0.0%) |
Health Insurance Coverage by Household Income in Custer
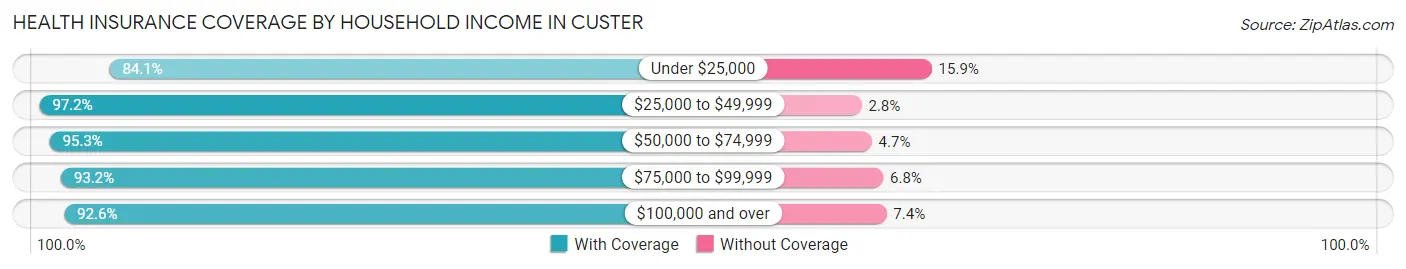
| Household Income | With Coverage | Without Coverage |
| Under $25,000 | 349 (84.1%) | 66 (15.9%) |
| $25,000 to $49,999 | 141 (97.2%) | 4 (2.8%) |
| $50,000 to $74,999 | 327 (95.3%) | 16 (4.7%) |
| $75,000 to $99,999 | 452 (93.2%) | 33 (6.8%) |
| $100,000 and over | 474 (92.6%) | 38 (7.4%) |
Public vs Private Health Insurance Coverage by Age in Custer
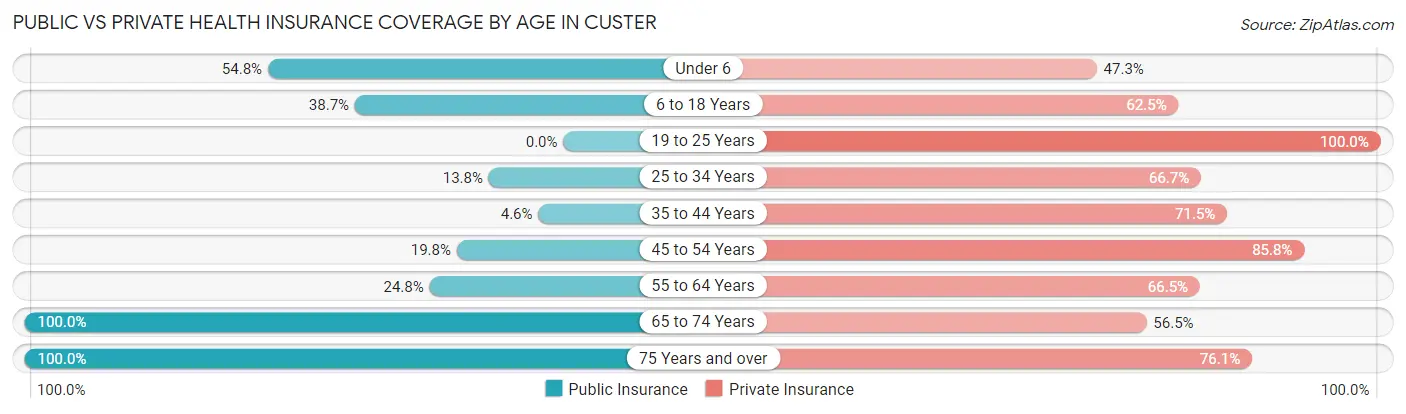
| Age Bracket | Public Insurance | Private Insurance |
| Under 6 | 51 (54.8%) | 44 (47.3%) |
| 6 to 18 Years | 65 (38.7%) | 105 (62.5%) |
| 19 to 25 Years | 0 (0.0%) | 138 (100.0%) |
| 25 to 34 Years | 22 (13.8%) | 106 (66.7%) |
| 35 to 44 Years | 7 (4.6%) | 108 (71.5%) |
| 45 to 54 Years | 53 (19.8%) | 230 (85.8%) |
| 55 to 64 Years | 80 (24.8%) | 214 (66.5%) |
| 65 to 74 Years | 306 (100.0%) | 173 (56.5%) |
| 75 Years and over | 331 (100.0%) | 252 (76.1%) |
| Total | 915 (47.3%) | 1,370 (70.8%) |
Disability Status by Sex by Age in Custer
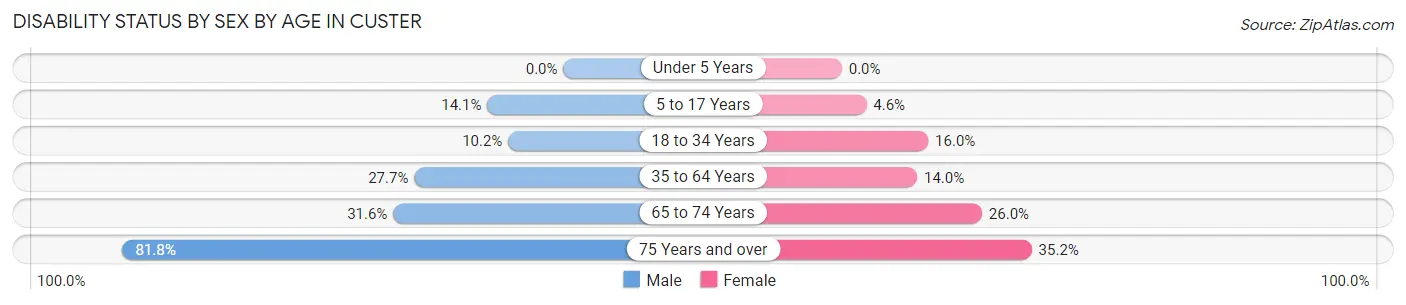
| Age Bracket | Male | Female |
| Under 5 Years | 0 (0.0%) | 0 (0.0%) |
| 5 to 17 Years | 12 (14.1%) | 4 (4.5%) |
| 18 to 34 Years | 17 (10.2%) | 21 (16.0%) |
| 35 to 64 Years | 106 (27.7%) | 50 (14.0%) |
| 65 to 74 Years | 42 (31.6%) | 45 (26.0%) |
| 75 Years and over | 99 (81.8%) | 74 (35.2%) |
Disability Class by Sex by Age in Custer
Disability Class: Hearing Difficulty
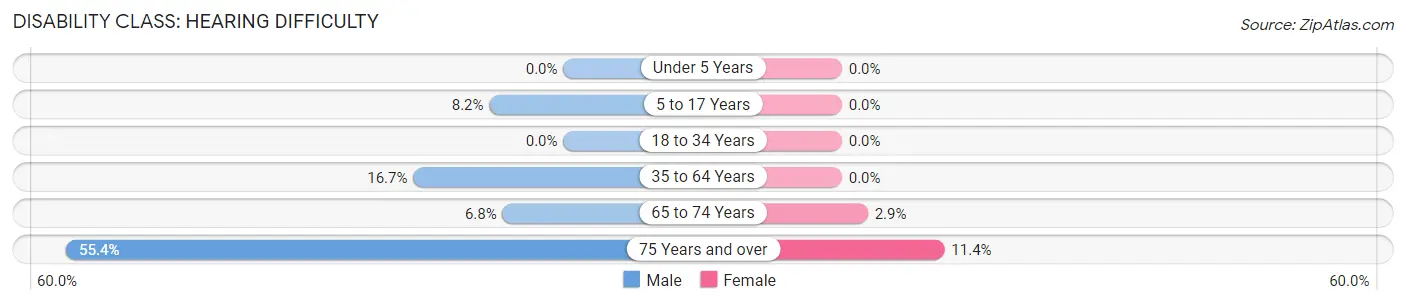
| Age Bracket | Male | Female |
| Under 5 Years | 0 (0.0%) | 0 (0.0%) |
| 5 to 17 Years | 7 (8.2%) | 0 (0.0%) |
| 18 to 34 Years | 0 (0.0%) | 0 (0.0%) |
| 35 to 64 Years | 64 (16.7%) | 0 (0.0%) |
| 65 to 74 Years | 9 (6.8%) | 5 (2.9%) |
| 75 Years and over | 67 (55.4%) | 24 (11.4%) |
Disability Class: Vision Difficulty
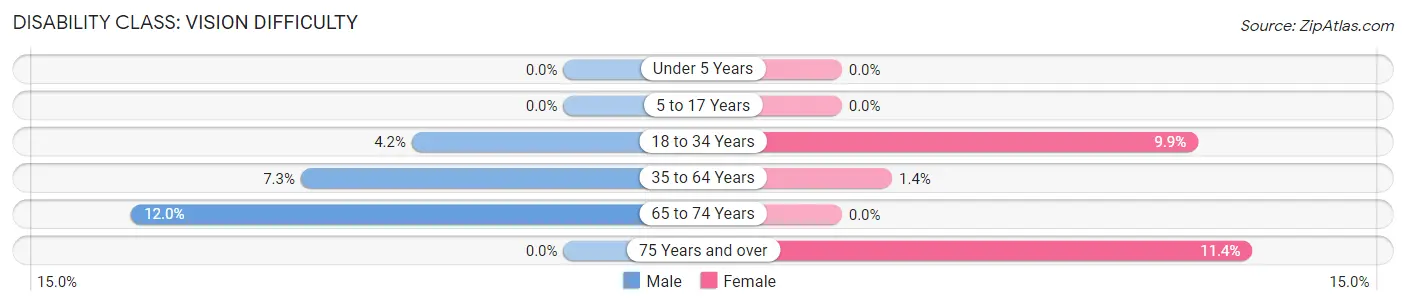
| Age Bracket | Male | Female |
| Under 5 Years | 0 (0.0%) | 0 (0.0%) |
| 5 to 17 Years | 0 (0.0%) | 0 (0.0%) |
| 18 to 34 Years | 7 (4.2%) | 13 (9.9%) |
| 35 to 64 Years | 28 (7.3%) | 5 (1.4%) |
| 65 to 74 Years | 16 (12.0%) | 0 (0.0%) |
| 75 Years and over | 0 (0.0%) | 24 (11.4%) |
Disability Class: Cognitive Difficulty
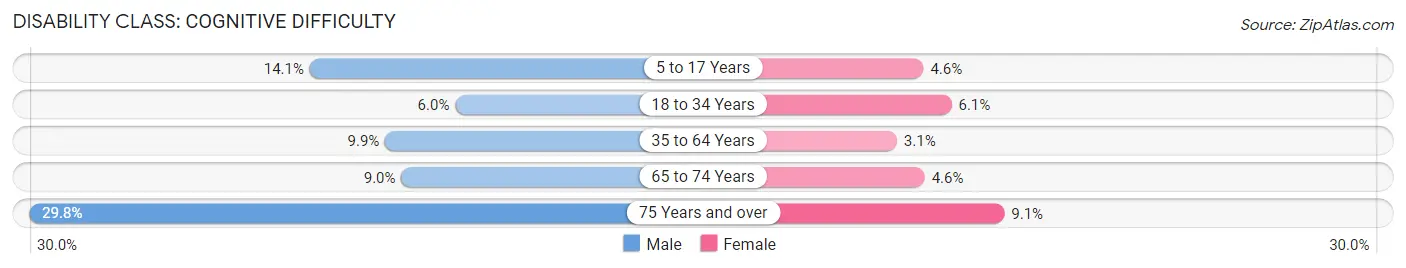
| Age Bracket | Male | Female |
| 5 to 17 Years | 12 (14.1%) | 4 (4.5%) |
| 18 to 34 Years | 10 (6.0%) | 8 (6.1%) |
| 35 to 64 Years | 38 (9.9%) | 11 (3.1%) |
| 65 to 74 Years | 12 (9.0%) | 8 (4.6%) |
| 75 Years and over | 36 (29.7%) | 19 (9.0%) |
Disability Class: Ambulatory Difficulty
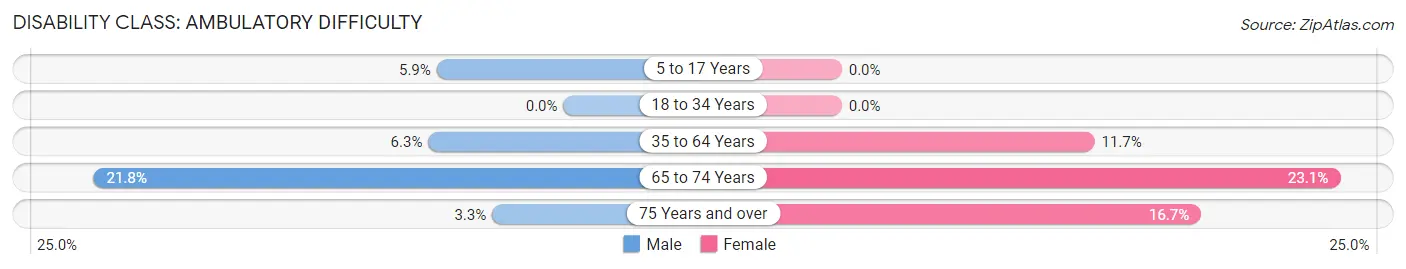
| Age Bracket | Male | Female |
| 5 to 17 Years | 5 (5.9%) | 0 (0.0%) |
| 18 to 34 Years | 0 (0.0%) | 0 (0.0%) |
| 35 to 64 Years | 24 (6.3%) | 42 (11.7%) |
| 65 to 74 Years | 29 (21.8%) | 40 (23.1%) |
| 75 Years and over | 4 (3.3%) | 35 (16.7%) |
Disability Class: Self-Care Difficulty
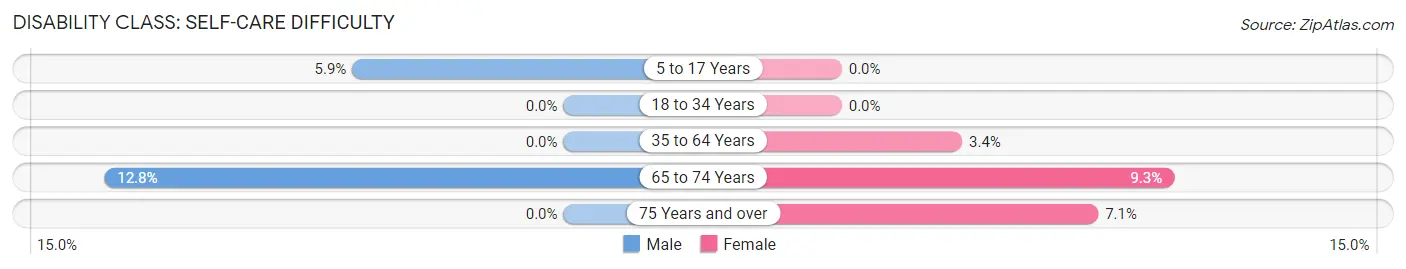
| Age Bracket | Male | Female |
| 5 to 17 Years | 5 (5.9%) | 0 (0.0%) |
| 18 to 34 Years | 0 (0.0%) | 0 (0.0%) |
| 35 to 64 Years | 0 (0.0%) | 12 (3.4%) |
| 65 to 74 Years | 17 (12.8%) | 16 (9.2%) |
| 75 Years and over | 0 (0.0%) | 15 (7.1%) |
Technology Access in Custer
Computing Device Access in Custer
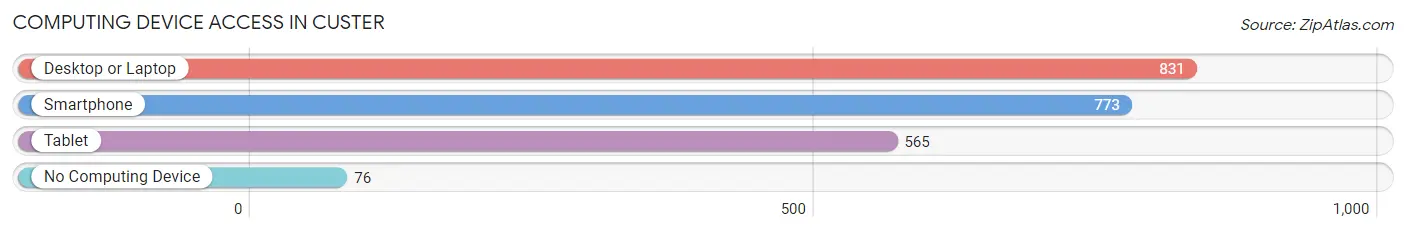
| Device Type | # Households | % Households |
| Desktop or Laptop | 831 | 84.5% |
| Smartphone | 773 | 78.6% |
| Tablet | 565 | 57.5% |
| No Computing Device | 76 | 7.7% |
| Total | 983 | 100.0% |
Internet Access in Custer
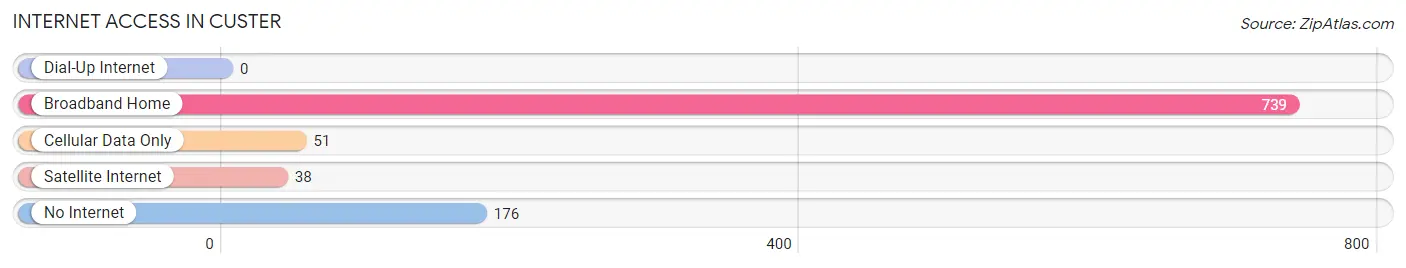
| Internet Type | # Households | % Households |
| Dial-Up Internet | 0 | 0.0% |
| Broadband Home | 739 | 75.2% |
| Cellular Data Only | 51 | 5.2% |
| Satellite Internet | 38 | 3.9% |
| No Internet | 176 | 17.9% |
| Total | 983 | 100.0% |
Custer Summary
Custer, South Dakota is a small town located in the Black Hills of South Dakota. It is the county seat of Custer County and is home to a population of approximately 2,000 people. The town was founded in 1875 and is named after General George Armstrong Custer, who was killed at the Battle of Little Bighorn in 1876.
Geography
Custer is located in the Black Hills of South Dakota, which is a mountain range that stretches from Wyoming to South Dakota. The town is situated at an elevation of 4,890 feet and is surrounded by the Black Hills National Forest. The town is located in the center of the Black Hills and is surrounded by the towns of Hill City, Keystone, and Hermosa. The town is located on the banks of the Little Big Horn River and is home to a variety of wildlife, including deer, elk, and bighorn sheep.
Economy
Custer is a small town with a diverse economy. The town is home to a variety of businesses, including restaurants, retail stores, and hotels. The town is also home to a variety of tourist attractions, including Mount Rushmore National Memorial, Crazy Horse Memorial, and Custer State Park. The town is also home to a variety of outdoor activities, including hiking, camping, fishing, and hunting.
Demographics
As of the 2010 census, Custer had a population of 2,067 people. The racial makeup of the town was 95.3% White, 0.3% African American, 0.7% Native American, 0.3% Asian, 0.1% Pacific Islander, 1.2% from other races, and 2.3% from two or more races. The median household income in Custer was $37,917, and the median family income was $45,938. The per capita income in Custer was $20,945.
Conclusion
Custer, South Dakota is a small town located in the Black Hills of South Dakota. It is the county seat of Custer County and is home to a population of approximately 2,000 people. The town was founded in 1875 and is named after General George Armstrong Custer, who was killed at the Battle of Little Bighorn in 1876. The town is located in the center of the Black Hills and is surrounded by the towns of Hill City, Keystone, and Hermosa. The town is home to a variety of businesses, tourist attractions, and outdoor activities. As of the 2010 census, Custer had a population of 2,067 people. The racial makeup of the town was 95.3% White, 0.3% African American, 0.7% Native American, 0.3% Asian, 0.1% Pacific Islander, 1.2% from other races, and 2.3% from two or more races. The median household income in Custer was $37,917, and the median family income was $45,938. The per capita income in Custer was $20,945.
Common Questions
What is the Total Population of Custer?
Total Population of Custer is 2,043.
What is the Total Male Population of Custer?
Total Male Population of Custer is 933.
What is the Total Female Population of Custer?
Total Female Population of Custer is 1,110.
What is the Ratio of Males per 100 Females in Custer?
There are 84.05 Males per 100 Females in Custer.
What is the Ratio of Females per 100 Males in Custer?
There are 118.97 Females per 100 Males in Custer.
What is the Median Population Age in Custer?
Median Population Age in Custer is 57.6 Years.
What is the Average Family Size in Custer
Average Family Size in Custer is 2.4 People.
What is the Average Household Size in Custer
Average Household Size in Custer is 1.9 People.
What is Per Capita Income in Custer?
Per Capita income in Custer is $41,284.
What is the Median Family Income in Custer?
Median Family Income in Custer is $78,769.
What is the Median Household income in Custer?
Median Household Income in Custer is $66,141.
What is Income or Wage Gap in Custer?
Income or Wage Gap in Custer is 46.8%.
Women in Custer earn 53.2 cents for every dollar earned by a man.
What is Inequality or Gini Index in Custer?
Inequality or Gini Index in Custer is 0.47.
How Large is the Labor Force in Custer?
There are 946 People in the Labor Forcein in Custer.
What is the Percentage of People in the Labor Force in Custer?
52.4% of People are in the Labor Force in Custer.
What is the Unemployment Rate in Custer?
Unemployment Rate in Custer is 4.1%.