Lake Madison, SD
Lake Madison Map
Lake Madison Overview
850
TOTAL POPULATION
449
MALE POPULATION
401
FEMALE POPULATION
111.97
MALES / 100 FEMALES
89.31
FEMALES / 100 MALES
61.7
MEDIAN AGE
2.3
AVG FAMILY SIZE
2.0
AVG HOUSEHOLD SIZE
$130,431
PER CAPITA INCOME
$120,882
AVG FAMILY INCOME
$114,250
AVG HOUSEHOLD INCOME
48.5%
WAGE / INCOME GAP [ % ]
51.5¢/ $1
WAGE / INCOME GAP [ $ ]
0.59
INEQUALITY / GINI INDEX
454
LABOR FORCE [ PEOPLE ]
58.0%
PERCENT IN LABOR FORCE
4.4%
UNEMPLOYMENT RATE
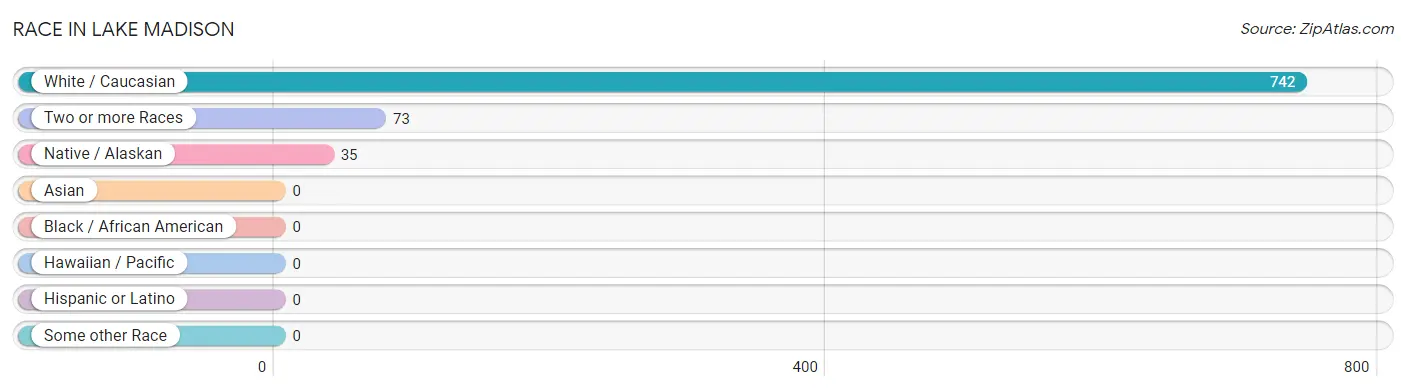
Race in Lake Madison
The most populous races in Lake Madison are White / Caucasian (742 | 87.3%), Two or more Races (73 | 8.6%), and Native / Alaskan (35 | 4.1%).
| Race | # Population | % Population |
| Asian | 0 | 0.0% |
| Black / African American | 0 | 0.0% |
| Hawaiian / Pacific | 0 | 0.0% |
| Hispanic or Latino | 0 | 0.0% |
| Native / Alaskan | 35 | 4.1% |
| White / Caucasian | 742 | 87.3% |
| Two or more Races | 73 | 8.6% |
| Some other Race | 0 | 0.0% |
| Total | 850 | 100.0% |
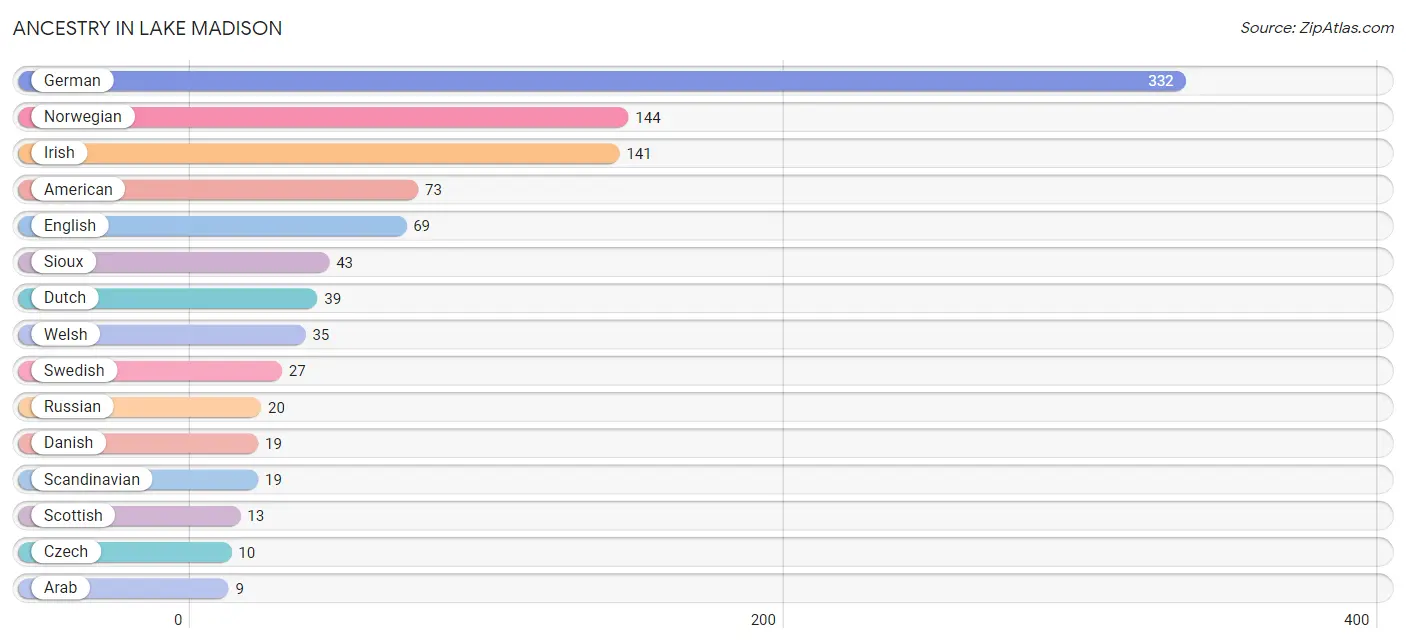
Ancestry in Lake Madison
The most populous ancestries reported in Lake Madison are German (332 | 39.1%), Norwegian (144 | 16.9%), Irish (141 | 16.6%), American (73 | 8.6%), and English (69 | 8.1%), together accounting for 89.3% of all Lake Madison residents.
| Ancestry | # Population | % Population |
| American | 73 | 8.6% |
| Arab | 9 | 1.1% |
| Czech | 10 | 1.2% |
| Czechoslovakian | 3 | 0.4% |
| Danish | 19 | 2.2% |
| Dutch | 39 | 4.6% |
| Eastern European | 3 | 0.4% |
| English | 69 | 8.1% |
| European | 9 | 1.1% |
| French | 8 | 0.9% |
| German | 332 | 39.1% |
| Irish | 141 | 16.6% |
| Lebanese | 9 | 1.1% |
| Norwegian | 144 | 16.9% |
| Polish | 6 | 0.7% |
| Russian | 20 | 2.4% |
| Scandinavian | 19 | 2.2% |
| Scotch-Irish | 8 | 0.9% |
| Scottish | 13 | 1.5% |
| Sioux | 43 | 5.1% |
| Swedish | 27 | 3.2% |
| Swiss | 3 | 0.4% |
| Thai | 8 | 0.9% |
| Welsh | 35 | 4.1% | View All 24 Rows |
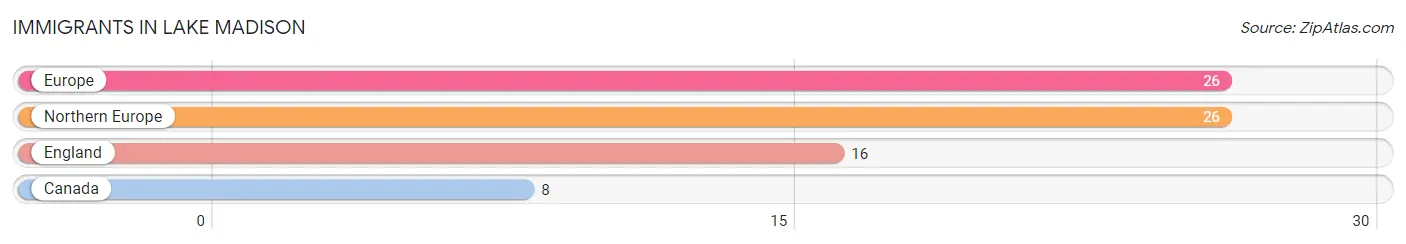
Immigrants in Lake Madison
The most numerous immigrant groups reported in Lake Madison came from Europe (26 | 3.1%), Northern Europe (26 | 3.1%), England (16 | 1.9%), and Canada (8 | 0.9%), together accounting for 8.9% of all Lake Madison residents.
| Immigration Origin | # Population | % Population |
| Canada | 8 | 0.9% |
| England | 16 | 1.9% |
| Europe | 26 | 3.1% |
| Northern Europe | 26 | 3.1% | View All 4 Rows |
Sex and Age in Lake Madison
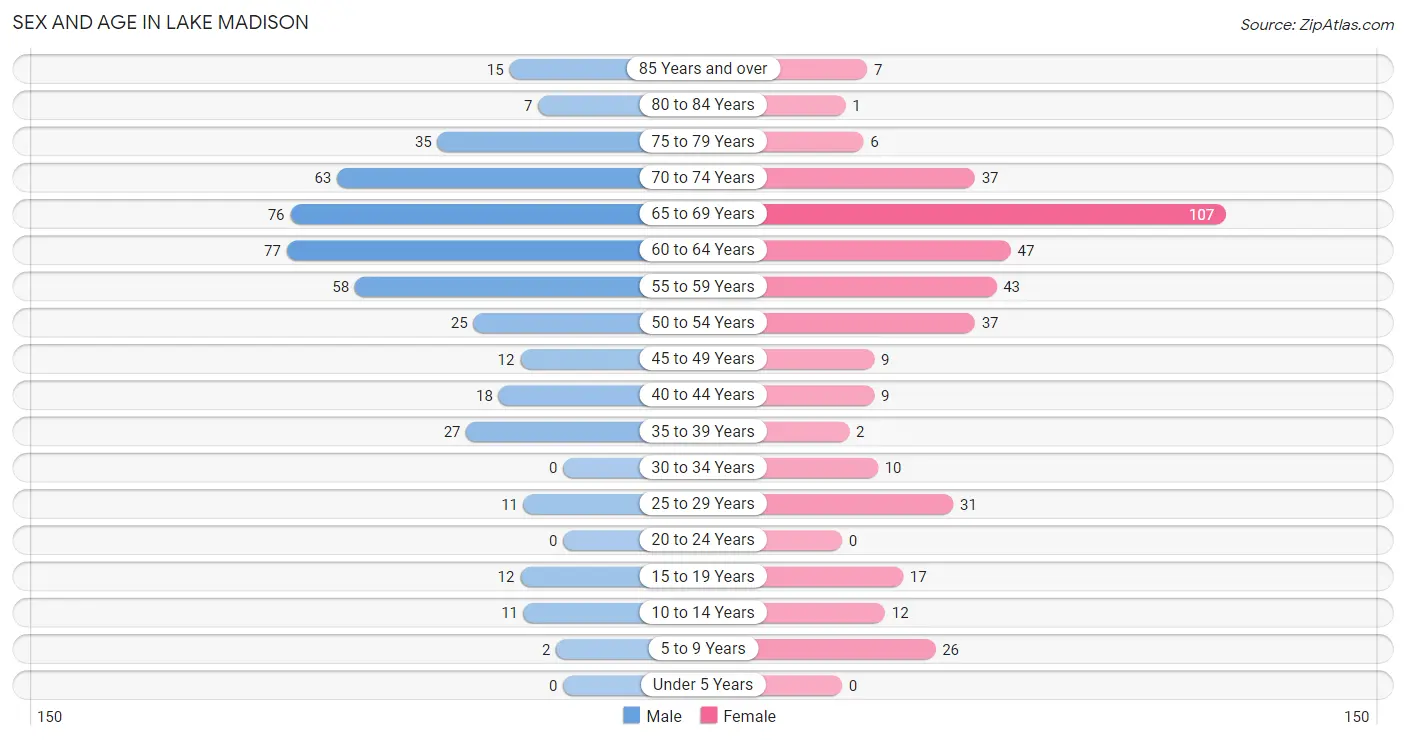
Sex and Age in Lake Madison
The most populous age groups in Lake Madison are 60 to 64 Years (77 | 17.2%) for men and 65 to 69 Years (107 | 26.7%) for women.
| Age Bracket | Male | Female |
| Under 5 Years | 0 (0.0%) | 0 (0.0%) |
| 5 to 9 Years | 2 (0.4%) | 26 (6.5%) |
| 10 to 14 Years | 11 (2.5%) | 12 (3.0%) |
| 15 to 19 Years | 12 (2.7%) | 17 (4.2%) |
| 20 to 24 Years | 0 (0.0%) | 0 (0.0%) |
| 25 to 29 Years | 11 (2.5%) | 31 (7.7%) |
| 30 to 34 Years | 0 (0.0%) | 10 (2.5%) |
| 35 to 39 Years | 27 (6.0%) | 2 (0.5%) |
| 40 to 44 Years | 18 (4.0%) | 9 (2.2%) |
| 45 to 49 Years | 12 (2.7%) | 9 (2.2%) |
| 50 to 54 Years | 25 (5.6%) | 37 (9.2%) |
| 55 to 59 Years | 58 (12.9%) | 43 (10.7%) |
| 60 to 64 Years | 77 (17.2%) | 47 (11.7%) |
| 65 to 69 Years | 76 (16.9%) | 107 (26.7%) |
| 70 to 74 Years | 63 (14.0%) | 37 (9.2%) |
| 75 to 79 Years | 35 (7.8%) | 6 (1.5%) |
| 80 to 84 Years | 7 (1.6%) | 1 (0.3%) |
| 85 Years and over | 15 (3.3%) | 7 (1.8%) |
| Total | 449 (100.0%) | 401 (100.0%) |
Families and Households in Lake Madison
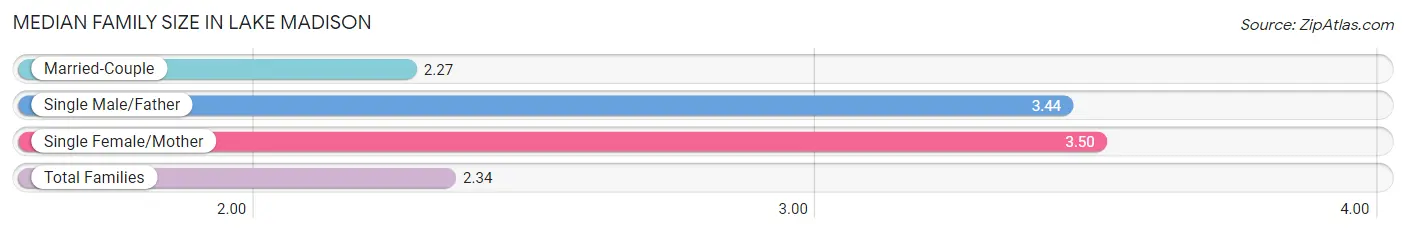
Median Family Size in Lake Madison
The median family size in Lake Madison is 2.34 persons per family, with single female/mother families (2 | 0.6%) accounting for the largest median family size of 3.5 persons per family. On the other hand, married-couple families (290 | 94.2%) represent the smallest median family size with 2.27 persons per family.
| Family Type | # Families | Family Size |
| Married-Couple | 290 (94.2%) | 2.27 |
| Single Male/Father | 16 (5.2%) | 3.44 |
| Single Female/Mother | 2 (0.6%) | 3.50 |
| Total Families | 308 (100.0%) | 2.34 |
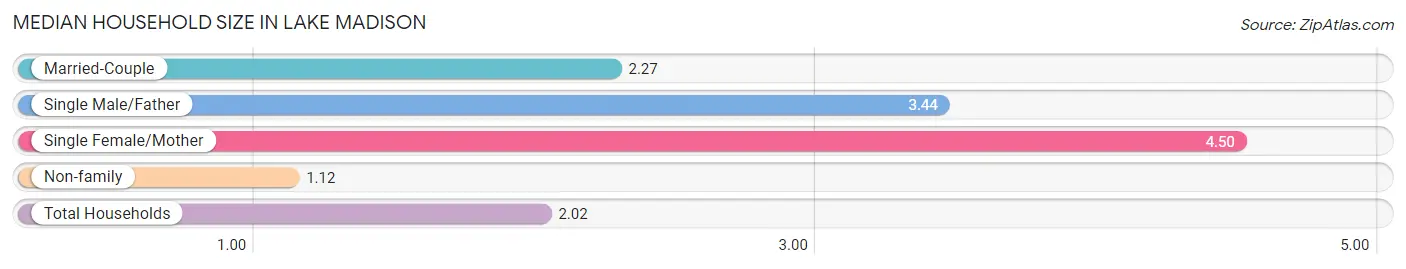
Median Household Size in Lake Madison
The median household size in Lake Madison is 2.02 persons per household, with single female/mother households (2 | 0.5%) accounting for the largest median household size of 4.5 persons per household. non-family households (113 | 26.8%) represent the smallest median household size with 1.12 persons per household.
| Household Type | # Households | Household Size |
| Married-Couple | 290 (68.9%) | 2.27 |
| Single Male/Father | 16 (3.8%) | 3.44 |
| Single Female/Mother | 2 (0.5%) | 4.50 |
| Non-family | 113 (26.8%) | 1.12 |
| Total Households | 421 (100.0%) | 2.02 |
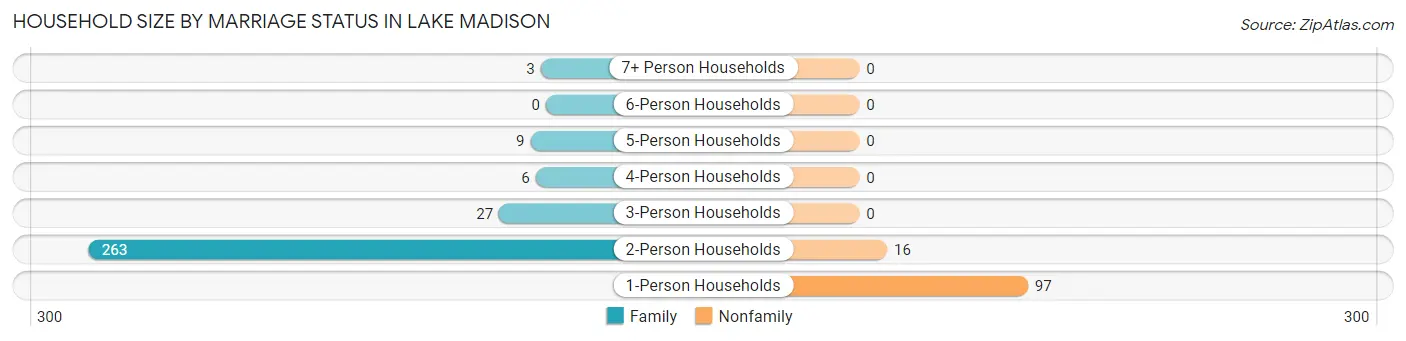
Household Size by Marriage Status in Lake Madison
Out of a total of 421 households in Lake Madison, 308 (73.2%) are family households, while 113 (26.8%) are nonfamily households. The most numerous type of family households are 2-person households, comprising 263, and the most common type of nonfamily households are 1-person households, comprising 97.
| Household Size | Family Households | Nonfamily Households |
| 1-Person Households | - | 97 (23.0%) |
| 2-Person Households | 263 (62.5%) | 16 (3.8%) |
| 3-Person Households | 27 (6.4%) | 0 (0.0%) |
| 4-Person Households | 6 (1.4%) | 0 (0.0%) |
| 5-Person Households | 9 (2.1%) | 0 (0.0%) |
| 6-Person Households | 0 (0.0%) | 0 (0.0%) |
| 7+ Person Households | 3 (0.7%) | 0 (0.0%) |
| Total | 308 (73.2%) | 113 (26.8%) |
Female Fertility in Lake Madison
Fertility by Age in Lake Madison
Average fertility rate in Lake Madison is 37.0 births per 1,000 women. Women in the age bracket of 35 to 50 years have the highest fertility rate with 130.0 births per 1,000 women. Women in the age bracket of 35 to 50 years acount for 100.0% of all women with births.
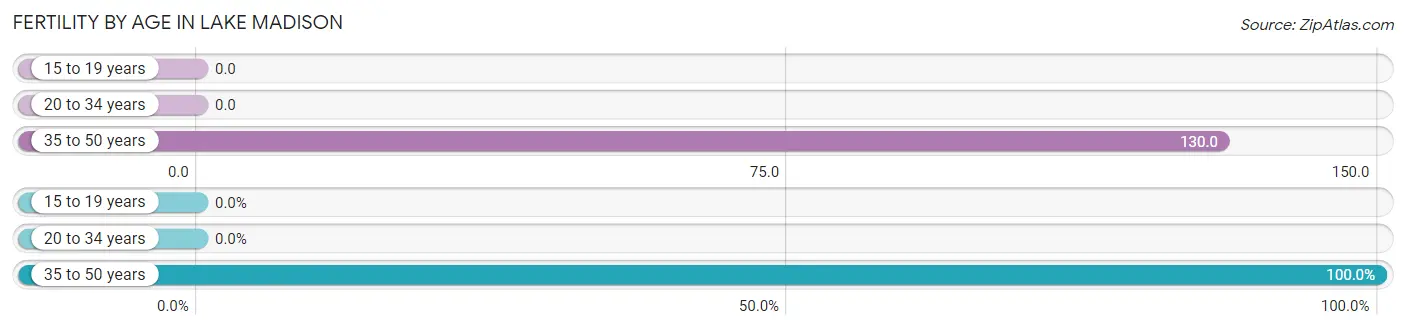
| Age Bracket | Women with Births | Births / 1,000 Women |
| 15 to 19 years | 0 (0.0%) | 0.0 |
| 20 to 34 years | 0 (0.0%) | 0.0 |
| 35 to 50 years | 3 (100.0%) | 130.0 |
| Total | 3 (100.0%) | 37.0 |
Fertility by Age by Marriage Status in Lake Madison
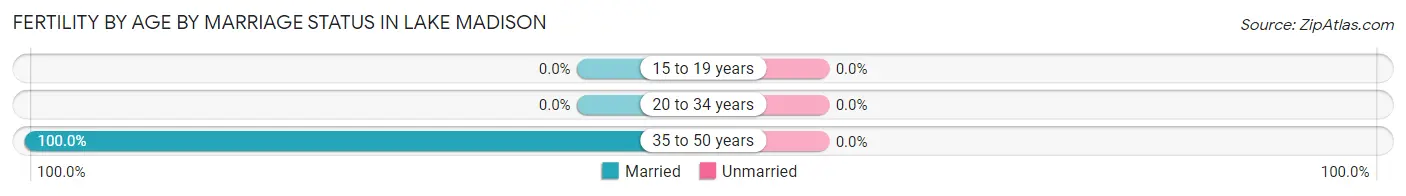
| Age Bracket | Married | Unmarried |
| 15 to 19 years | 0 (0.0%) | 0 (0.0%) |
| 20 to 34 years | 0 (0.0%) | 0 (0.0%) |
| 35 to 50 years | 3 (100.0%) | 0 (0.0%) |
| Total | 3 (100.0%) | 0 (0.0%) |
Fertility by Education in Lake Madison
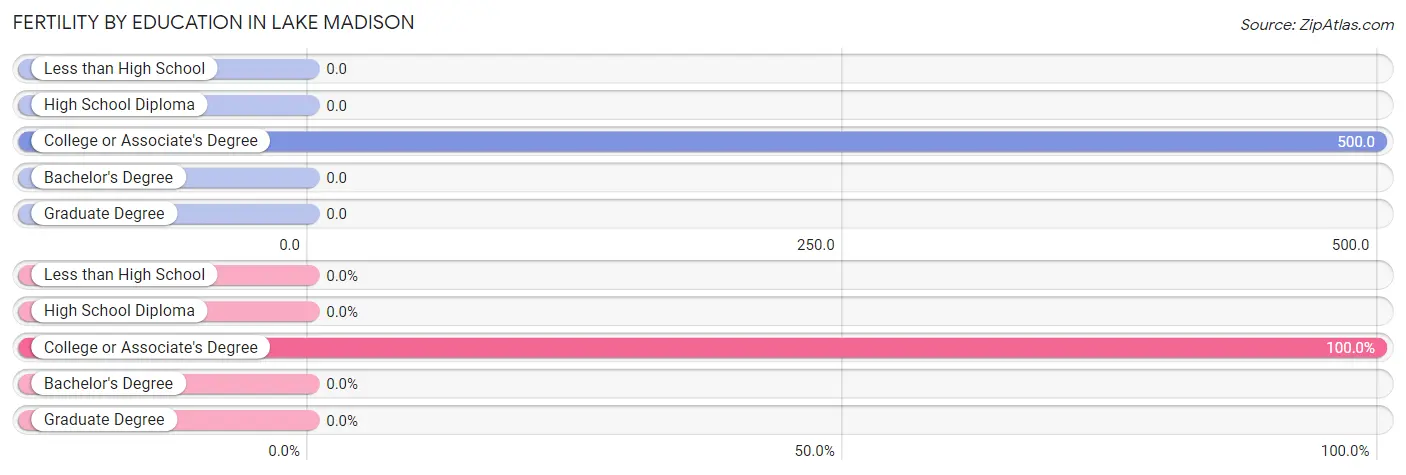
| Educational Attainment | Women with Births | Births / 1,000 Women |
| Less than High School | 0 (0.0%) | 0.0 |
| High School Diploma | 0 (0.0%) | 0.0 |
| College or Associate's Degree | 3 (100.0%) | 500.0 |
| Bachelor's Degree | 0 (0.0%) | 0.0 |
| Graduate Degree | 0 (0.0%) | 0.0 |
| Total | 3 (100.0%) | 37.0 |
Fertility by Education by Marriage Status in Lake Madison
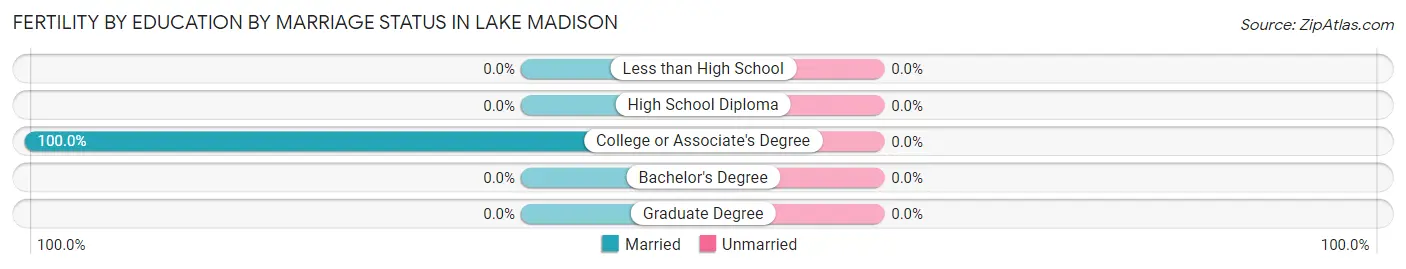
| Educational Attainment | Married | Unmarried |
| Less than High School | 0 (0.0%) | 0 (0.0%) |
| High School Diploma | 0 (0.0%) | 0 (0.0%) |
| College or Associate's Degree | 3 (100.0%) | 0 (0.0%) |
| Bachelor's Degree | 0 (0.0%) | 0 (0.0%) |
| Graduate Degree | 0 (0.0%) | 0 (0.0%) |
| Total | 3 (100.0%) | 0 (0.0%) |
Income in Lake Madison
Income Overview in Lake Madison
Per Capita Income in Lake Madison is $130,431, while median incomes of families and households are $120,882 and $114,250 respectively.
| Characteristic | Number | Measure |
| Per Capita Income | 850 | $130,431 |
| Median Family Income | 308 | $120,882 |
| Mean Family Income | 308 | $304,322 |
| Median Household Income | 421 | $114,250 |
| Mean Household Income | 421 | $255,310 |
| Income Deficit | 308 | $0 |
| Wage / Income Gap (%) | 850 | 48.52% |
| Wage / Income Gap ($) | 850 | 51.48¢ per $1 |
| Gini / Inequality Index | 850 | 0.59 |
Earnings by Sex in Lake Madison
Average Earnings in Lake Madison are $43,603, $70,417 for men and $36,250 for women, a difference of 48.5%.
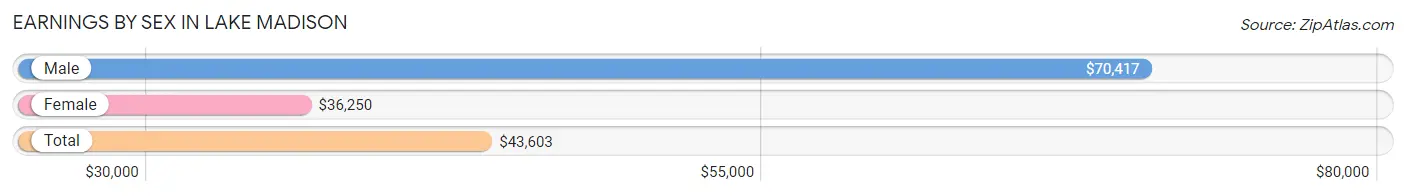
| Sex | Number | Average Earnings |
| Male | 273 (57.0%) | $70,417 |
| Female | 206 (43.0%) | $36,250 |
| Total | 479 (100.0%) | $43,603 |
Earnings by Sex by Income Bracket in Lake Madison
The most common earnings brackets in Lake Madison are $100,000+ for men (125 | 45.8%) and $35,000 to $39,999 for women (47 | 22.8%).
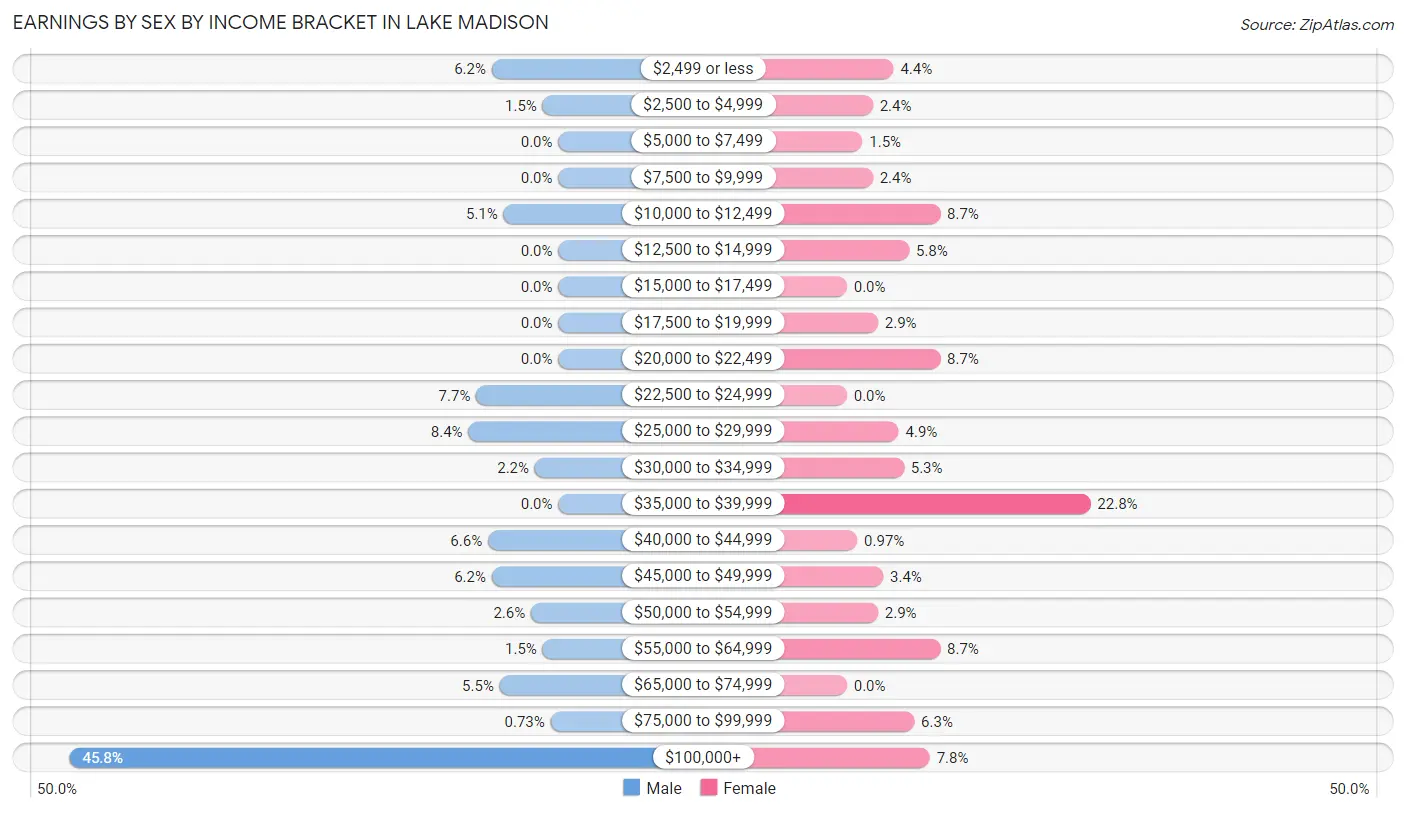
| Income | Male | Female |
| $2,499 or less | 17 (6.2%) | 9 (4.4%) |
| $2,500 to $4,999 | 4 (1.5%) | 5 (2.4%) |
| $5,000 to $7,499 | 0 (0.0%) | 3 (1.5%) |
| $7,500 to $9,999 | 0 (0.0%) | 5 (2.4%) |
| $10,000 to $12,499 | 14 (5.1%) | 18 (8.7%) |
| $12,500 to $14,999 | 0 (0.0%) | 12 (5.8%) |
| $15,000 to $17,499 | 0 (0.0%) | 0 (0.0%) |
| $17,500 to $19,999 | 0 (0.0%) | 6 (2.9%) |
| $20,000 to $22,499 | 0 (0.0%) | 18 (8.7%) |
| $22,500 to $24,999 | 21 (7.7%) | 0 (0.0%) |
| $25,000 to $29,999 | 23 (8.4%) | 10 (4.9%) |
| $30,000 to $34,999 | 6 (2.2%) | 11 (5.3%) |
| $35,000 to $39,999 | 0 (0.0%) | 47 (22.8%) |
| $40,000 to $44,999 | 18 (6.6%) | 2 (1.0%) |
| $45,000 to $49,999 | 17 (6.2%) | 7 (3.4%) |
| $50,000 to $54,999 | 7 (2.6%) | 6 (2.9%) |
| $55,000 to $64,999 | 4 (1.5%) | 18 (8.7%) |
| $65,000 to $74,999 | 15 (5.5%) | 0 (0.0%) |
| $75,000 to $99,999 | 2 (0.7%) | 13 (6.3%) |
| $100,000+ | 125 (45.8%) | 16 (7.8%) |
| Total | 273 (100.0%) | 206 (100.0%) |
Earnings by Sex by Educational Attainment in Lake Madison
Average earnings in Lake Madison are $71,250 for men and $37,292 for women, a difference of 47.7%. Men with an educational attainment of high school diploma enjoy the highest average annual earnings of $105,809, while those with bachelor's degree education earn the least with $26,786. Women with an educational attainment of graduate degree earn the most with the average annual earnings of $53,750, while those with high school diploma education have the smallest earnings of $20,347.
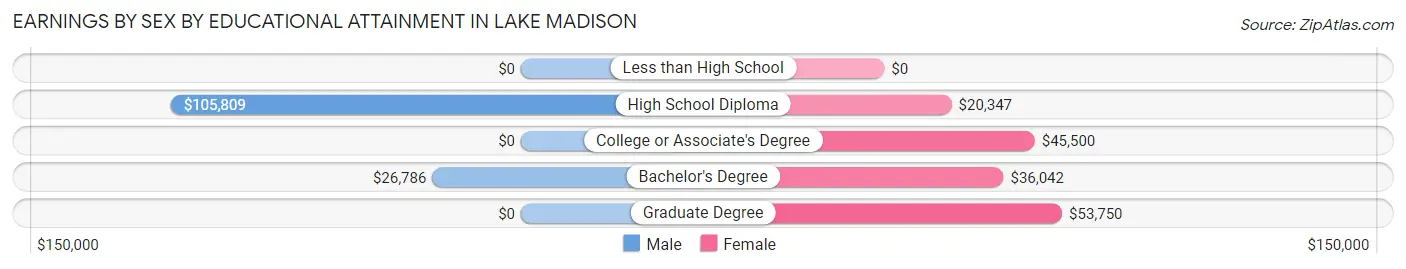
| Educational Attainment | Male Income | Female Income |
| Less than High School | - | - |
| High School Diploma | $105,809 | $20,347 |
| College or Associate's Degree | - | - |
| Bachelor's Degree | $26,786 | $36,042 |
| Graduate Degree | - | - |
| Total | $71,250 | $37,292 |
Family Income in Lake Madison
Family Income Brackets in Lake Madison
According to the Lake Madison family income data, there are 94 families falling into the $200,000+ income range, which is the most common income bracket and makes up 30.5% of all families.
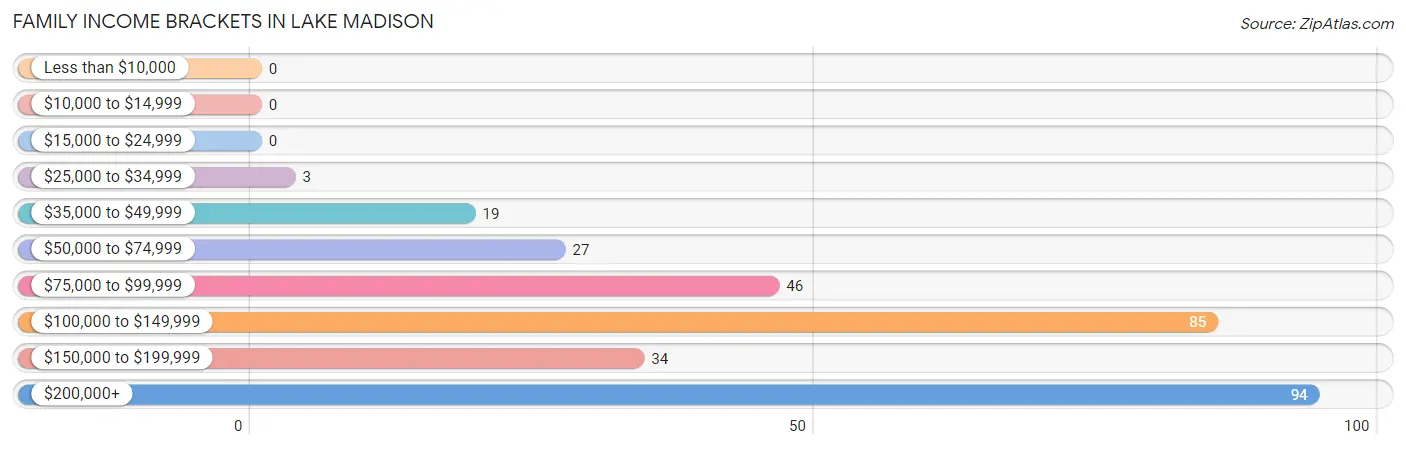
| Income Bracket | # Families | % Families |
| Less than $10,000 | 0 | 0.0% |
| $10,000 to $14,999 | 0 | 0.0% |
| $15,000 to $24,999 | 0 | 0.0% |
| $25,000 to $34,999 | 3 | 1.0% |
| $35,000 to $49,999 | 19 | 6.2% |
| $50,000 to $74,999 | 27 | 8.8% |
| $75,000 to $99,999 | 46 | 14.9% |
| $100,000 to $149,999 | 85 | 27.6% |
| $150,000 to $199,999 | 34 | 11.0% |
| $200,000+ | 94 | 30.5% |
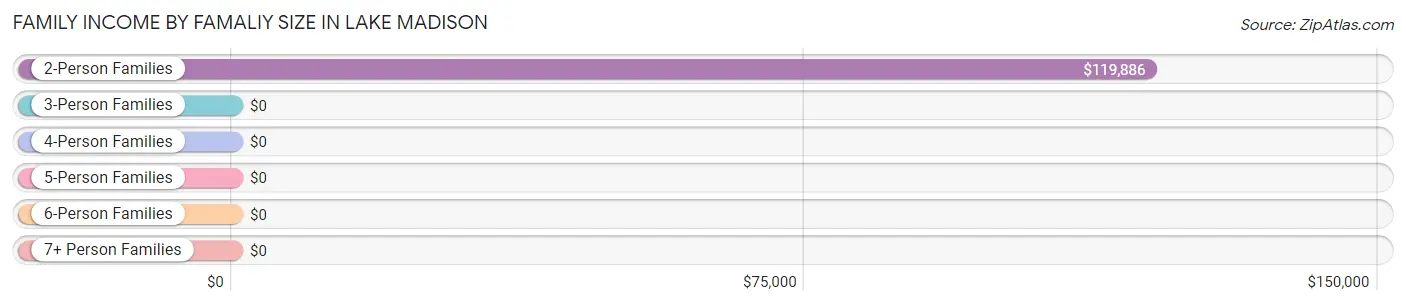
Family Income by Famaliy Size in Lake Madison
2-person families (263 | 85.4%) account for the highest median family income in Lake Madison with $119,886 per family, while 2-person families (263 | 85.4%) have the highest median income of $59,943 per family member.
| Income Bracket | # Families | Median Income |
| 2-Person Families | 263 (85.4%) | $119,886 |
| 3-Person Families | 27 (8.8%) | $0 |
| 4-Person Families | 8 (2.6%) | $0 |
| 5-Person Families | 7 (2.3%) | $0 |
| 6-Person Families | 0 (0.0%) | $0 |
| 7+ Person Families | 3 (1.0%) | $0 |
| Total | 308 (100.0%) | $120,882 |
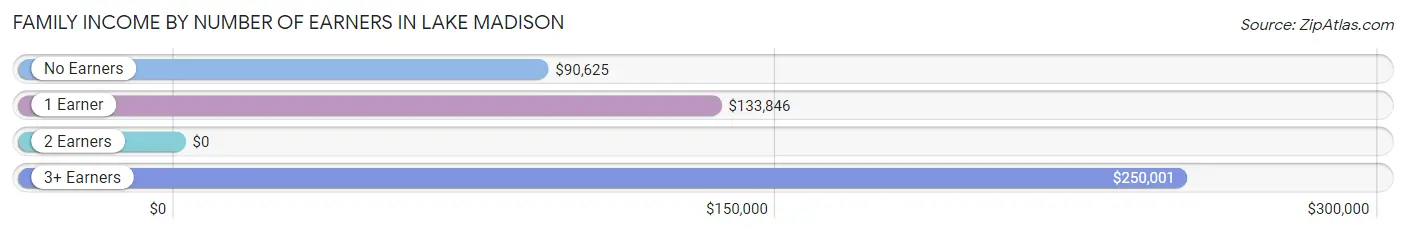
Family Income by Number of Earners in Lake Madison
| Number of Earners | # Families | Median Income |
| No Earners | 88 (28.6%) | $90,625 |
| 1 Earner | 60 (19.5%) | $133,846 |
| 2 Earners | 145 (47.1%) | $0 |
| 3+ Earners | 15 (4.9%) | $250,001 |
| Total | 308 (100.0%) | $120,882 |
Household Income in Lake Madison
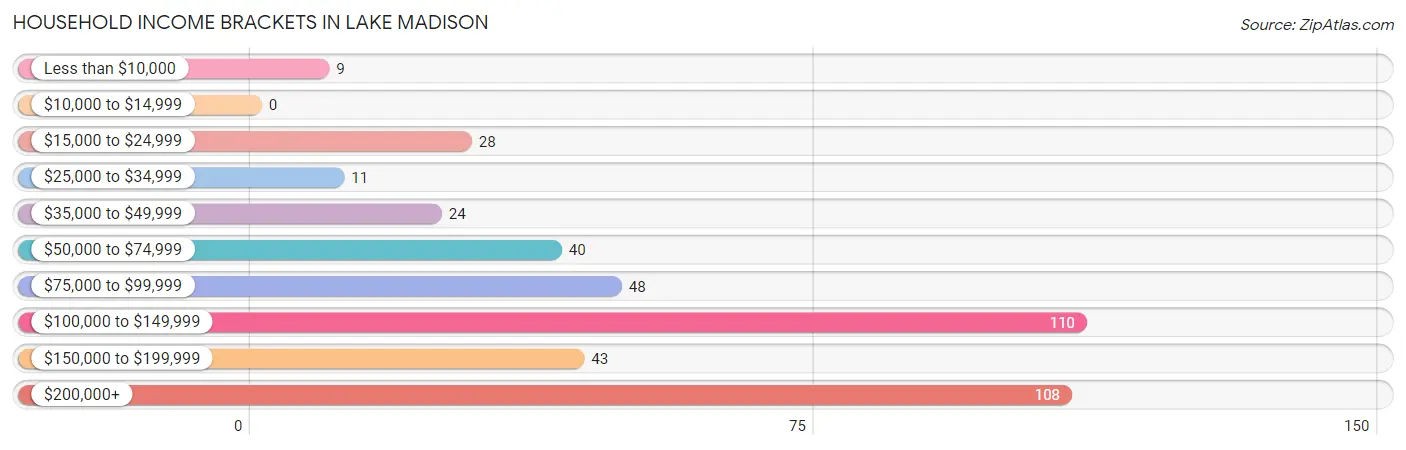
Household Income Brackets in Lake Madison
With 110 households falling in the category, the $100,000 to $149,999 income range is the most frequent in Lake Madison, accounting for 26.1% of all households.
| Income Bracket | # Households | % Households |
| Less than $10,000 | 9 | 2.1% |
| $10,000 to $14,999 | 0 | 0.0% |
| $15,000 to $24,999 | 28 | 6.7% |
| $25,000 to $34,999 | 11 | 2.6% |
| $35,000 to $49,999 | 24 | 5.7% |
| $50,000 to $74,999 | 40 | 9.5% |
| $75,000 to $99,999 | 48 | 11.4% |
| $100,000 to $149,999 | 110 | 26.1% |
| $150,000 to $199,999 | 43 | 10.2% |
| $200,000+ | 108 | 25.7% |
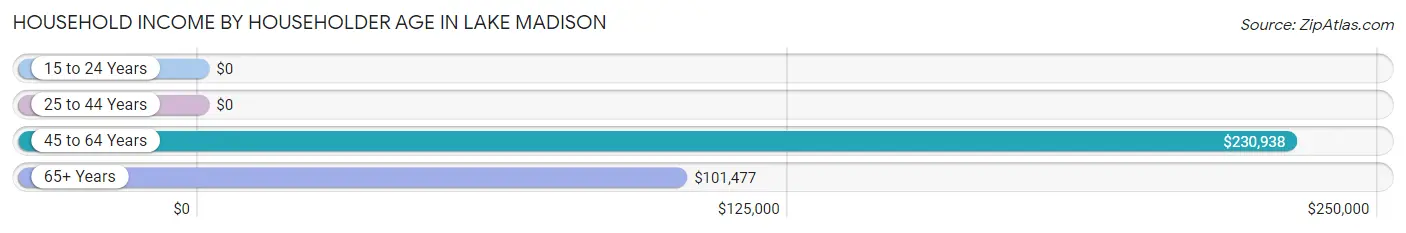
Household Income by Householder Age in Lake Madison
The median household income in Lake Madison is $114,250, with the highest median household income of $230,938 found in the 45 to 64 years age bracket for the primary householder. A total of 177 households (42.0%) fall into this category.
| Income Bracket | # Households | Median Income |
| 15 to 24 Years | 0 (0.0%) | $0 |
| 25 to 44 Years | 41 (9.7%) | $0 |
| 45 to 64 Years | 177 (42.0%) | $230,938 |
| 65+ Years | 203 (48.2%) | $101,477 |
| Total | 421 (100.0%) | $114,250 |
Poverty in Lake Madison
Income Below Poverty by Sex and Age in Lake Madison
With 2.0% poverty level for males and 6.7% for females among the residents of Lake Madison, 12 to 14 year old males and 12 to 14 year old females are the most vulnerable to poverty, with 3 males (100.0%) and 6 females (66.7%) in their respective age groups living below the poverty level.
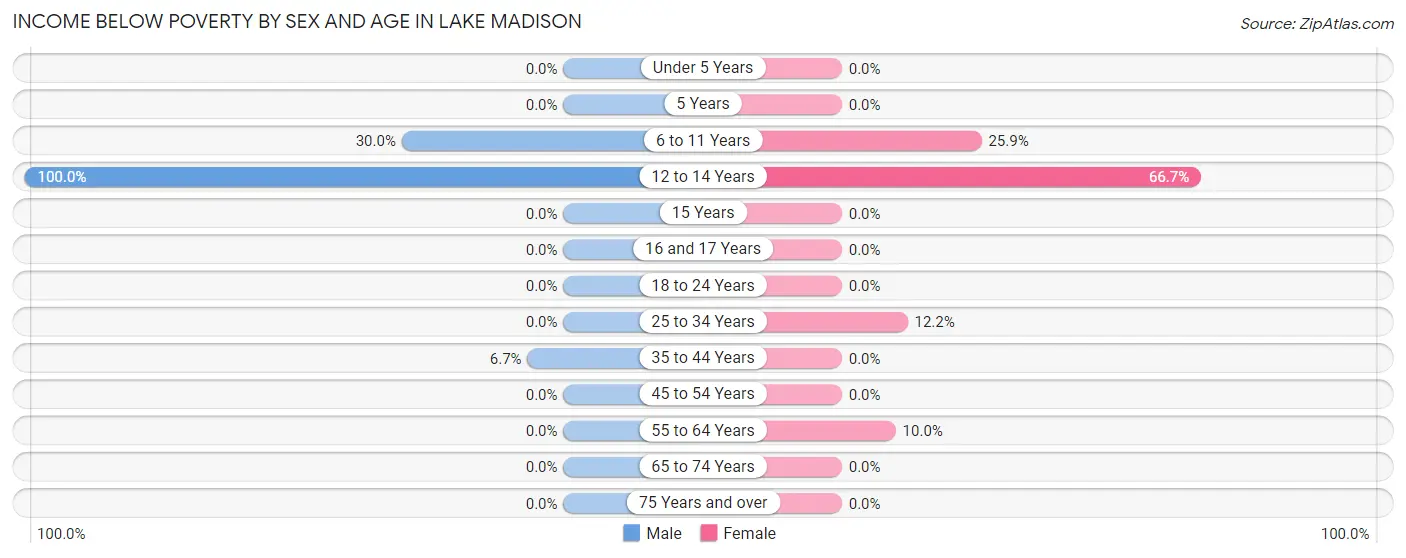
| Age Bracket | Male | Female |
| Under 5 Years | 0 (0.0%) | 0 (0.0%) |
| 5 Years | 0 (0.0%) | 0 (0.0%) |
| 6 to 11 Years | 3 (30.0%) | 7 (25.9%) |
| 12 to 14 Years | 3 (100.0%) | 6 (66.7%) |
| 15 Years | 0 (0.0%) | 0 (0.0%) |
| 16 and 17 Years | 0 (0.0%) | 0 (0.0%) |
| 18 to 24 Years | 0 (0.0%) | 0 (0.0%) |
| 25 to 34 Years | 0 (0.0%) | 5 (12.2%) |
| 35 to 44 Years | 3 (6.7%) | 0 (0.0%) |
| 45 to 54 Years | 0 (0.0%) | 0 (0.0%) |
| 55 to 64 Years | 0 (0.0%) | 9 (10.0%) |
| 65 to 74 Years | 0 (0.0%) | 0 (0.0%) |
| 75 Years and over | 0 (0.0%) | 0 (0.0%) |
| Total | 9 (2.0%) | 27 (6.7%) |
Income Above Poverty by Sex and Age in Lake Madison
According to the poverty statistics in Lake Madison, males aged 15 years and females aged 5 years are the age groups that are most secure financially, with 100.0% of males and 100.0% of females in these age groups living above the poverty line.
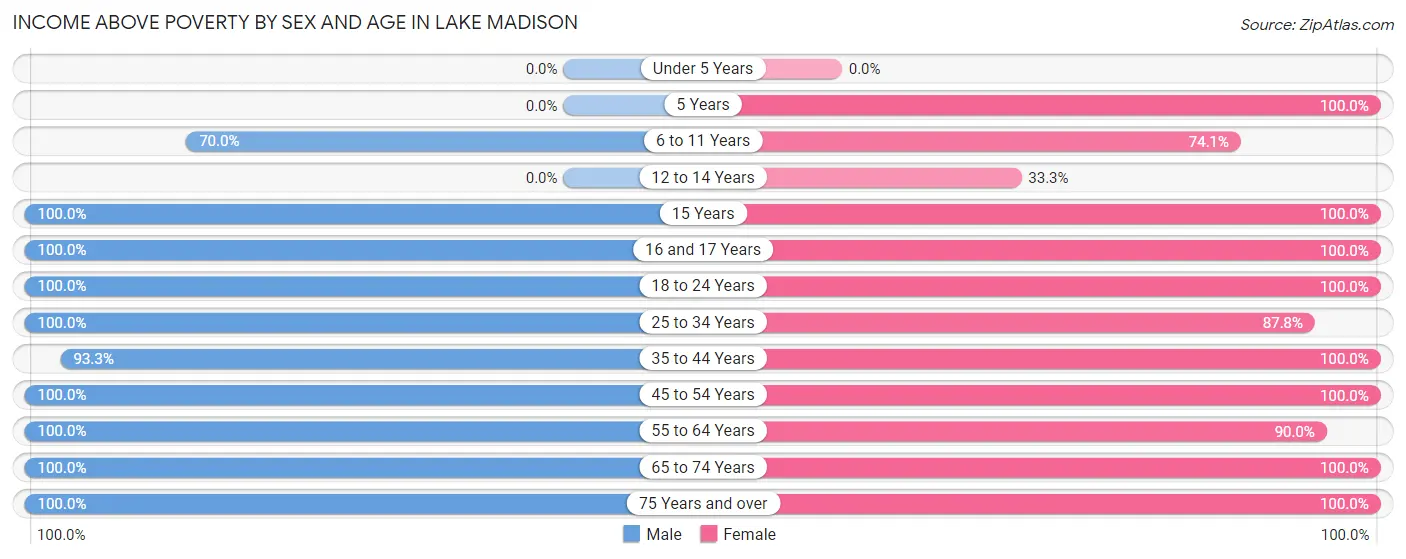
| Age Bracket | Male | Female |
| Under 5 Years | 0 (0.0%) | 0 (0.0%) |
| 5 Years | 0 (0.0%) | 2 (100.0%) |
| 6 to 11 Years | 7 (70.0%) | 20 (74.1%) |
| 12 to 14 Years | 0 (0.0%) | 3 (33.3%) |
| 15 Years | 9 (100.0%) | 7 (100.0%) |
| 16 and 17 Years | 1 (100.0%) | 9 (100.0%) |
| 18 to 24 Years | 2 (100.0%) | 1 (100.0%) |
| 25 to 34 Years | 11 (100.0%) | 36 (87.8%) |
| 35 to 44 Years | 42 (93.3%) | 11 (100.0%) |
| 45 to 54 Years | 37 (100.0%) | 46 (100.0%) |
| 55 to 64 Years | 135 (100.0%) | 81 (90.0%) |
| 65 to 74 Years | 139 (100.0%) | 144 (100.0%) |
| 75 Years and over | 57 (100.0%) | 14 (100.0%) |
| Total | 440 (98.0%) | 374 (93.3%) |
Income Below Poverty Among Married-Couple Families in Lake Madison
The poverty statistics for married-couple families in Lake Madison show that 1.0% or 3 of the total 290 families live below the poverty line. Families with 5 or more children have the highest poverty rate of 100.0%, comprising of 3 families. On the other hand, families with no children have the lowest poverty rate of 0.0%, which includes 0 families.
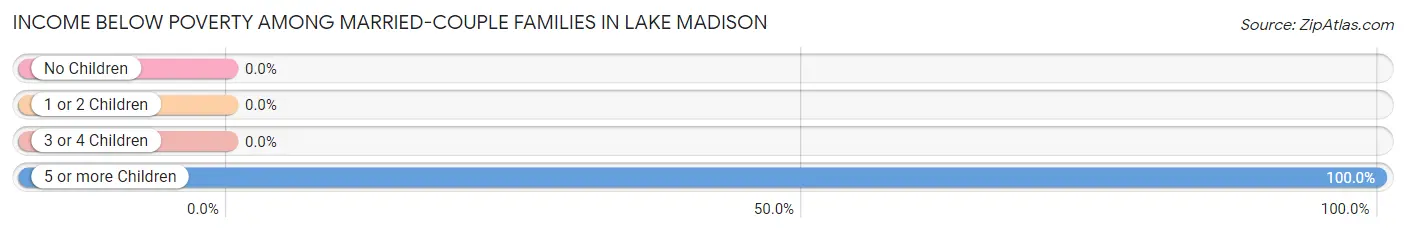
| Children | Above Poverty | Below Poverty |
| No Children | 263 (100.0%) | 0 (0.0%) |
| 1 or 2 Children | 22 (100.0%) | 0 (0.0%) |
| 3 or 4 Children | 2 (100.0%) | 0 (0.0%) |
| 5 or more Children | 0 (0.0%) | 3 (100.0%) |
| Total | 287 (99.0%) | 3 (1.0%) |
Income Below Poverty Among Single-Parent Households in Lake Madison
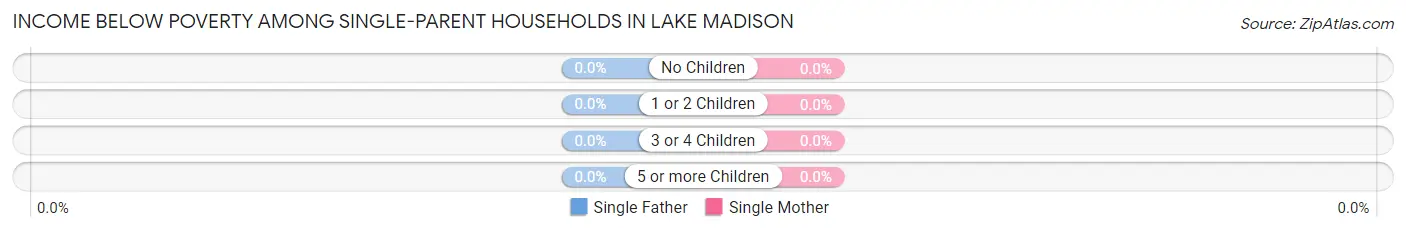
| Children | Single Father | Single Mother |
| No Children | 0 (0.0%) | 0 (0.0%) |
| 1 or 2 Children | 0 (0.0%) | 0 (0.0%) |
| 3 or 4 Children | 0 (0.0%) | 0 (0.0%) |
| 5 or more Children | 0 (0.0%) | 0 (0.0%) |
| Total | 0 (0.0%) | 0 (0.0%) |
Income Below Poverty Among Married-Couple vs Single-Parent Households in Lake Madison
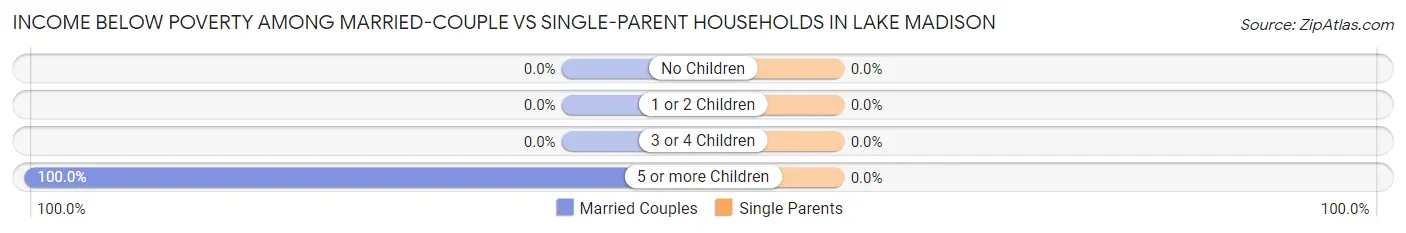
| Children | Married-Couple Families | Single-Parent Households |
| No Children | 0 (0.0%) | 0 (0.0%) |
| 1 or 2 Children | 0 (0.0%) | 0 (0.0%) |
| 3 or 4 Children | 0 (0.0%) | 0 (0.0%) |
| 5 or more Children | 3 (100.0%) | 0 (0.0%) |
| Total | 3 (1.0%) | 0 (0.0%) |
Employment Characteristics in Lake Madison
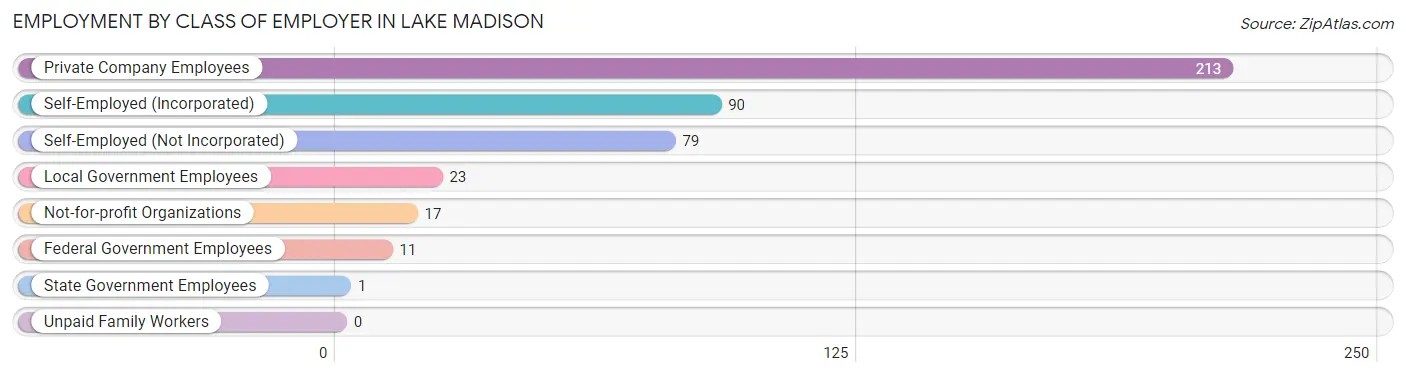
Employment by Class of Employer in Lake Madison
Among the 434 employed individuals in Lake Madison, private company employees (213 | 49.1%), self-employed (incorporated) (90 | 20.7%), and self-employed (not incorporated) (79 | 18.2%) make up the most common classes of employment.
| Employer Class | # Employees | % Employees |
| Private Company Employees | 213 | 49.1% |
| Self-Employed (Incorporated) | 90 | 20.7% |
| Self-Employed (Not Incorporated) | 79 | 18.2% |
| Not-for-profit Organizations | 17 | 3.9% |
| Local Government Employees | 23 | 5.3% |
| State Government Employees | 1 | 0.2% |
| Federal Government Employees | 11 | 2.5% |
| Unpaid Family Workers | 0 | 0.0% |
| Total | 434 | 100.0% |
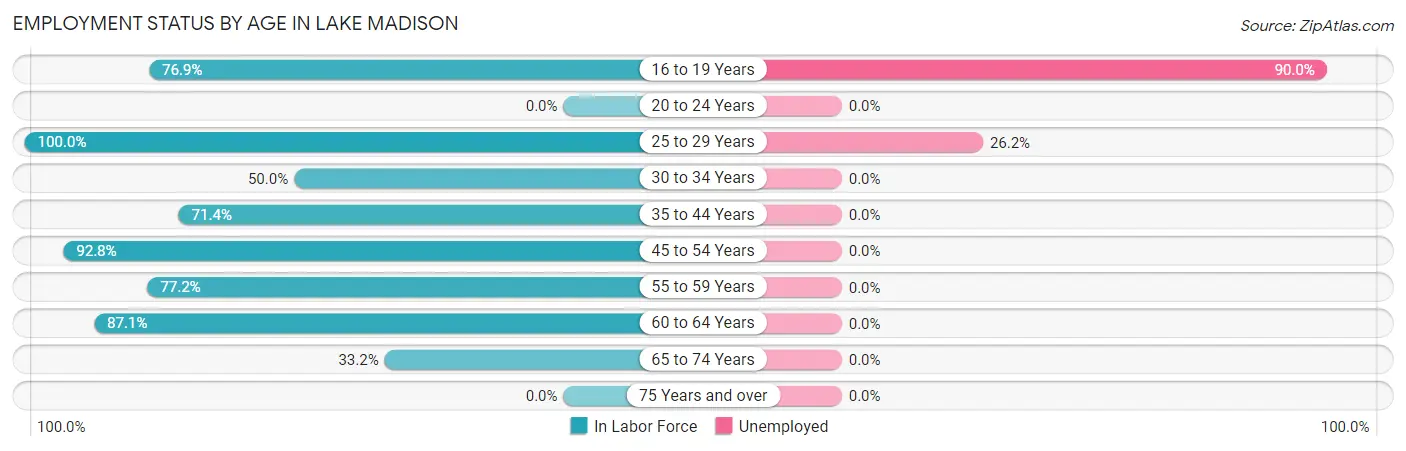
Employment Status by Age in Lake Madison
According to the labor force statistics for Lake Madison, out of the total population over 16 years of age (783), 58.0% or 454 individuals are in the labor force, with 4.4% or 20 of them unemployed. The age group with the highest labor force participation rate is 25 to 29 years, with 100.0% or 42 individuals in the labor force. Within the labor force, the 16 to 19 years age range has the highest percentage of unemployed individuals, with 90.0% or 9 of them being unemployed.
| Age Bracket | In Labor Force | Unemployed |
| 16 to 19 Years | 10 (76.9%) | 9 (90.0%) |
| 20 to 24 Years | 0 (0.0%) | 0 (0.0%) |
| 25 to 29 Years | 42 (100.0%) | 11 (26.2%) |
| 30 to 34 Years | 5 (50.0%) | 0 (0.0%) |
| 35 to 44 Years | 40 (71.4%) | 0 (0.0%) |
| 45 to 54 Years | 77 (92.8%) | 0 (0.0%) |
| 55 to 59 Years | 78 (77.2%) | 0 (0.0%) |
| 60 to 64 Years | 108 (87.1%) | 0 (0.0%) |
| 65 to 74 Years | 94 (33.2%) | 0 (0.0%) |
| 75 Years and over | 0 (0.0%) | 0 (0.0%) |
| Total | 454 (58.0%) | 20 (4.4%) |
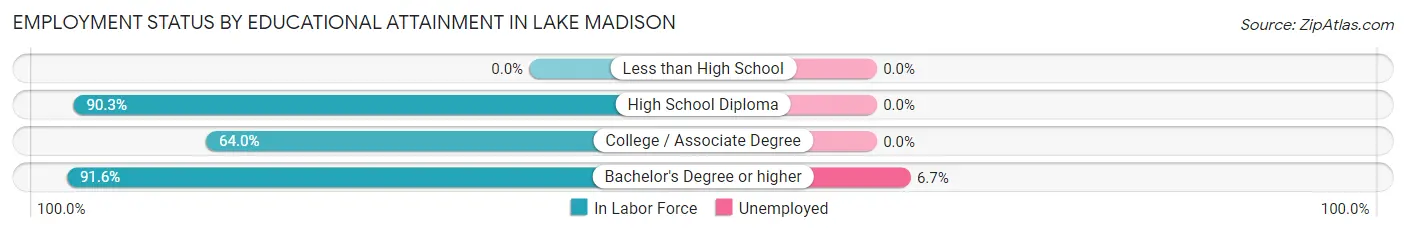
Employment Status by Educational Attainment in Lake Madison
According to labor force statistics for Lake Madison, 84.1% of individuals (350) out of the total population between 25 and 64 years of age (416) are in the labor force, with 3.1% or 11 of them being unemployed. The group with the highest labor force participation rate are those with the educational attainment of bachelor's degree or higher, with 91.6% or 163 individuals in the labor force. Within the labor force, individuals with bachelor's degree or higher education have the highest percentage of unemployment, with 6.7% or 11 of them being unemployed.
| Educational Attainment | In Labor Force | Unemployed |
| Less than High School | 0 (0.0%) | 0 (0.0%) |
| High School Diploma | 130 (90.3%) | 0 (0.0%) |
| College / Associate Degree | 57 (64.0%) | 0 (0.0%) |
| Bachelor's Degree or higher | 163 (91.6%) | 12 (6.7%) |
| Total | 350 (84.1%) | 13 (3.1%) |
Employment Occupations by Sex in Lake Madison
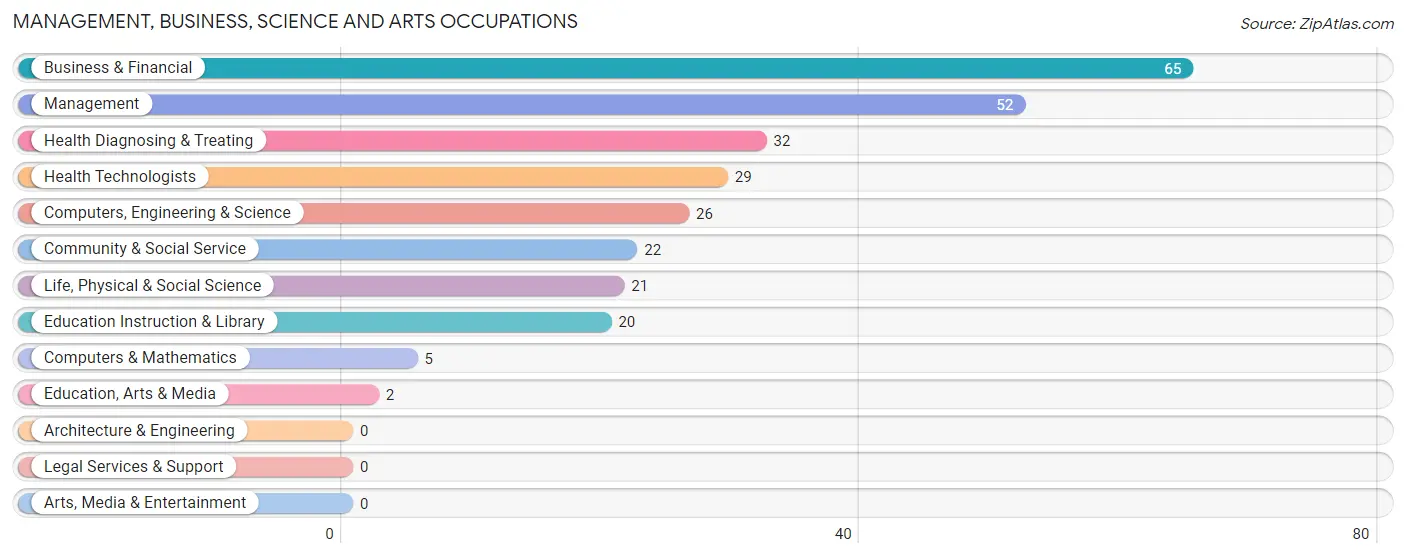
Management, Business, Science and Arts Occupations
The most common Management, Business, Science and Arts occupations in Lake Madison are Business & Financial (65 | 15.0%), Management (52 | 12.0%), Health Diagnosing & Treating (32 | 7.4%), Health Technologists (29 | 6.7%), and Computers, Engineering & Science (26 | 6.0%).
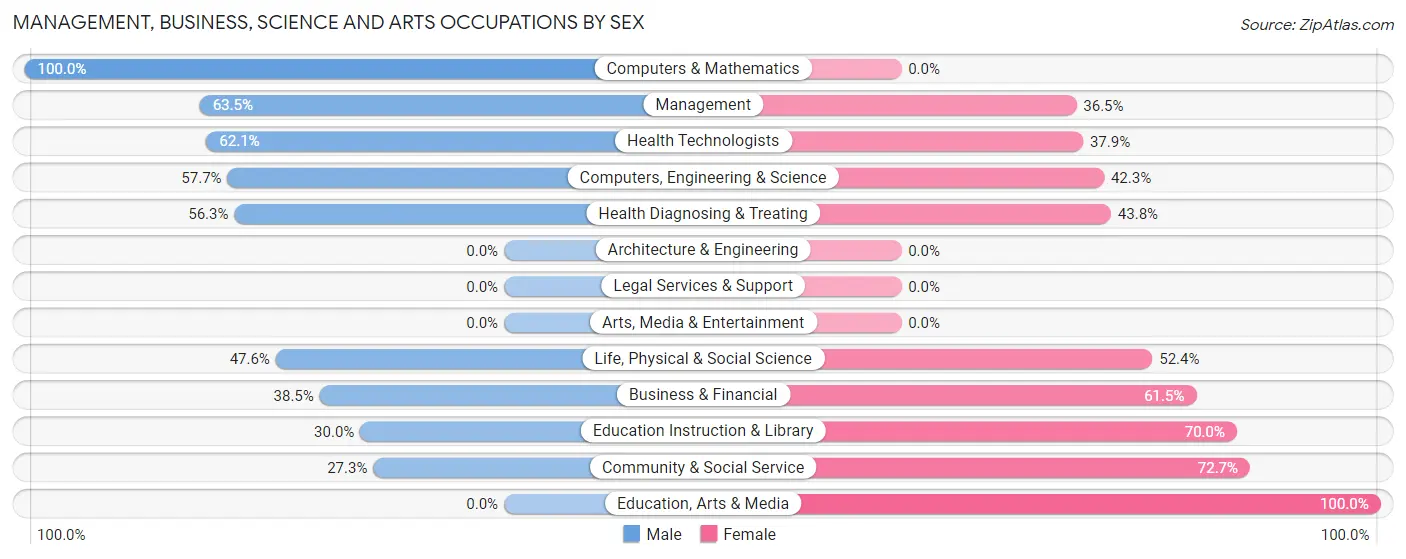
Management, Business, Science and Arts Occupations by Sex
Within the Management, Business, Science and Arts occupations in Lake Madison, the most male-oriented occupations are Computers & Mathematics (100.0%), Management (63.5%), and Health Technologists (62.1%), while the most female-oriented occupations are Education, Arts & Media (100.0%), Community & Social Service (72.7%), and Education Instruction & Library (70.0%).
| Occupation | Male | Female |
| Management | 33 (63.5%) | 19 (36.5%) |
| Business & Financial | 25 (38.5%) | 40 (61.5%) |
| Computers, Engineering & Science | 15 (57.7%) | 11 (42.3%) |
| Computers & Mathematics | 5 (100.0%) | 0 (0.0%) |
| Architecture & Engineering | 0 (0.0%) | 0 (0.0%) |
| Life, Physical & Social Science | 10 (47.6%) | 11 (52.4%) |
| Community & Social Service | 6 (27.3%) | 16 (72.7%) |
| Education, Arts & Media | 0 (0.0%) | 2 (100.0%) |
| Legal Services & Support | 0 (0.0%) | 0 (0.0%) |
| Education Instruction & Library | 6 (30.0%) | 14 (70.0%) |
| Arts, Media & Entertainment | 0 (0.0%) | 0 (0.0%) |
| Health Diagnosing & Treating | 18 (56.2%) | 14 (43.8%) |
| Health Technologists | 18 (62.1%) | 11 (37.9%) |
| Total (Category) | 97 (49.2%) | 100 (50.8%) |
| Total (Overall) | 247 (56.9%) | 187 (43.1%) |
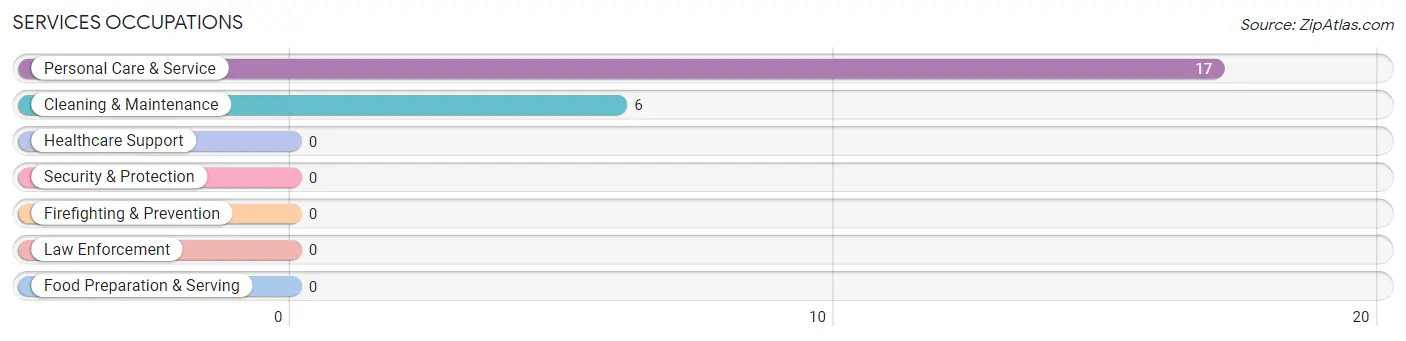
Services Occupations
The most common Services occupations in Lake Madison are Personal Care & Service (17 | 3.9%), and Cleaning & Maintenance (6 | 1.4%).
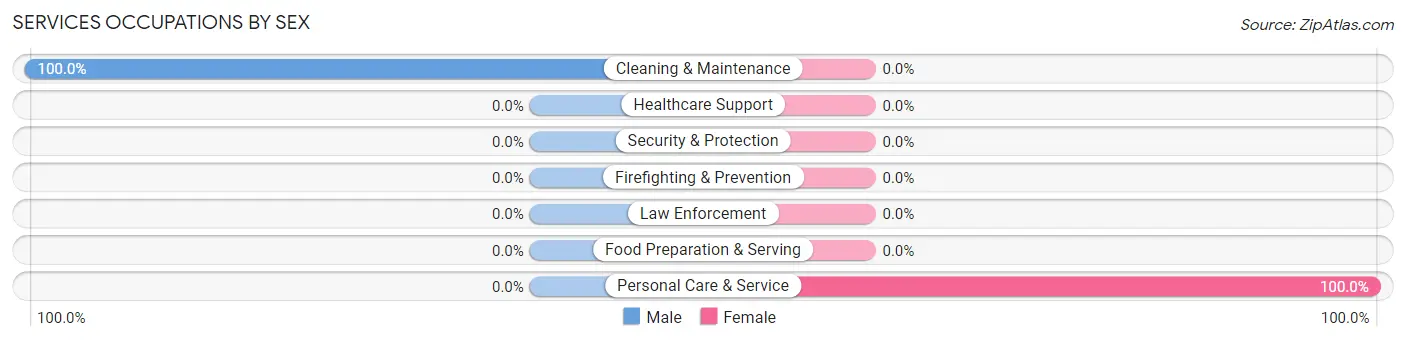
Services Occupations by Sex
| Occupation | Male | Female |
| Healthcare Support | 0 (0.0%) | 0 (0.0%) |
| Security & Protection | 0 (0.0%) | 0 (0.0%) |
| Firefighting & Prevention | 0 (0.0%) | 0 (0.0%) |
| Law Enforcement | 0 (0.0%) | 0 (0.0%) |
| Food Preparation & Serving | 0 (0.0%) | 0 (0.0%) |
| Cleaning & Maintenance | 6 (100.0%) | 0 (0.0%) |
| Personal Care & Service | 0 (0.0%) | 17 (100.0%) |
| Total (Category) | 6 (26.1%) | 17 (73.9%) |
| Total (Overall) | 247 (56.9%) | 187 (43.1%) |
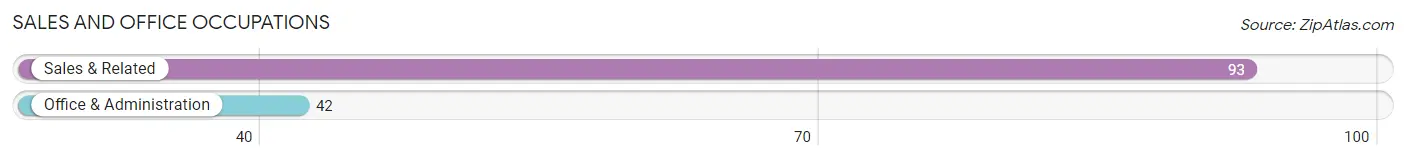
Sales and Office Occupations
The most common Sales and Office occupations in Lake Madison are Sales & Related (93 | 21.4%), and Office & Administration (42 | 9.7%).
Sales and Office Occupations by Sex
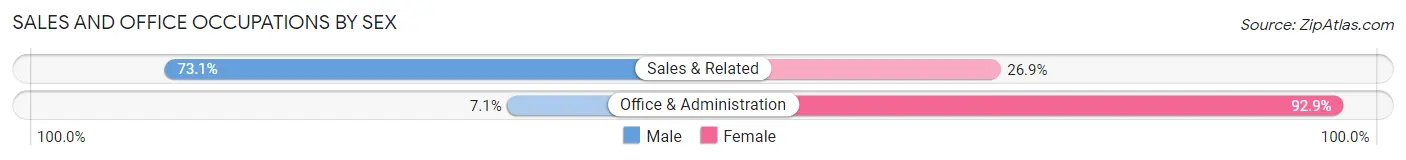
| Occupation | Male | Female |
| Sales & Related | 68 (73.1%) | 25 (26.9%) |
| Office & Administration | 3 (7.1%) | 39 (92.9%) |
| Total (Category) | 71 (52.6%) | 64 (47.4%) |
| Total (Overall) | 247 (56.9%) | 187 (43.1%) |
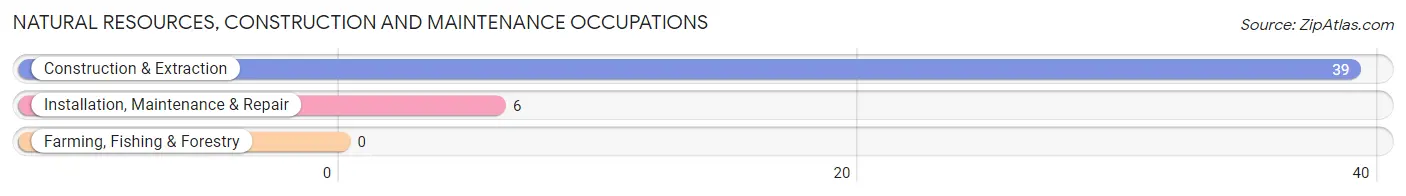
Natural Resources, Construction and Maintenance Occupations
The most common Natural Resources, Construction and Maintenance occupations in Lake Madison are Construction & Extraction (39 | 9.0%), and Installation, Maintenance & Repair (6 | 1.4%).
Natural Resources, Construction and Maintenance Occupations by Sex
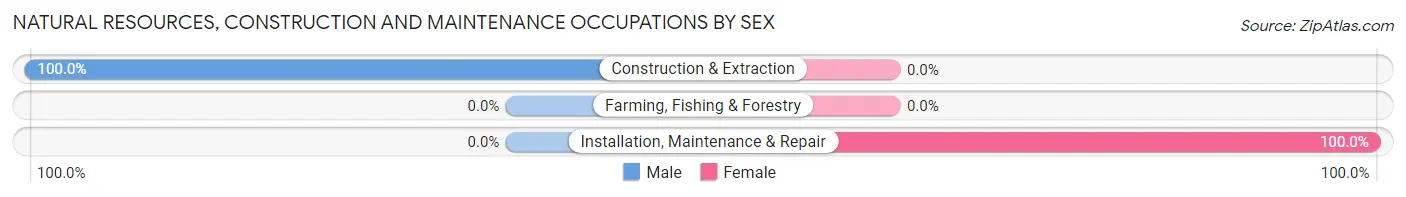
| Occupation | Male | Female |
| Farming, Fishing & Forestry | 0 (0.0%) | 0 (0.0%) |
| Construction & Extraction | 39 (100.0%) | 0 (0.0%) |
| Installation, Maintenance & Repair | 0 (0.0%) | 6 (100.0%) |
| Total (Category) | 39 (86.7%) | 6 (13.3%) |
| Total (Overall) | 247 (56.9%) | 187 (43.1%) |
Production, Transportation and Moving Occupations
The most common Production, Transportation and Moving occupations in Lake Madison are Material Moving (15 | 3.5%), Transportation (10 | 2.3%), and Production (9 | 2.1%).
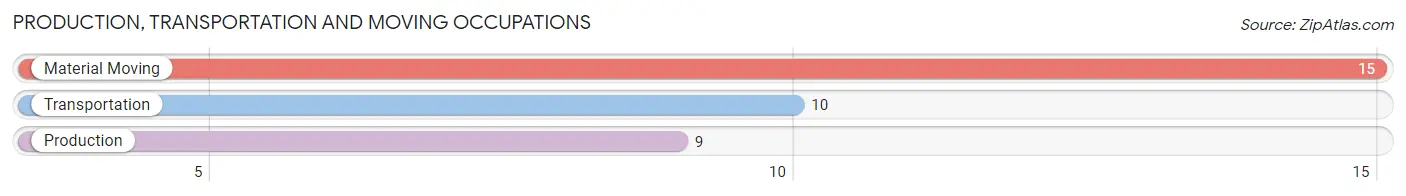
Production, Transportation and Moving Occupations by Sex
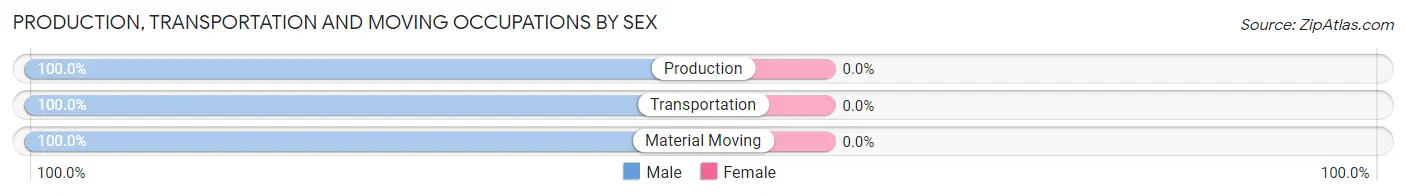
| Occupation | Male | Female |
| Production | 9 (100.0%) | 0 (0.0%) |
| Transportation | 10 (100.0%) | 0 (0.0%) |
| Material Moving | 15 (100.0%) | 0 (0.0%) |
| Total (Category) | 34 (100.0%) | 0 (0.0%) |
| Total (Overall) | 247 (56.9%) | 187 (43.1%) |
Employment Industries by Sex in Lake Madison
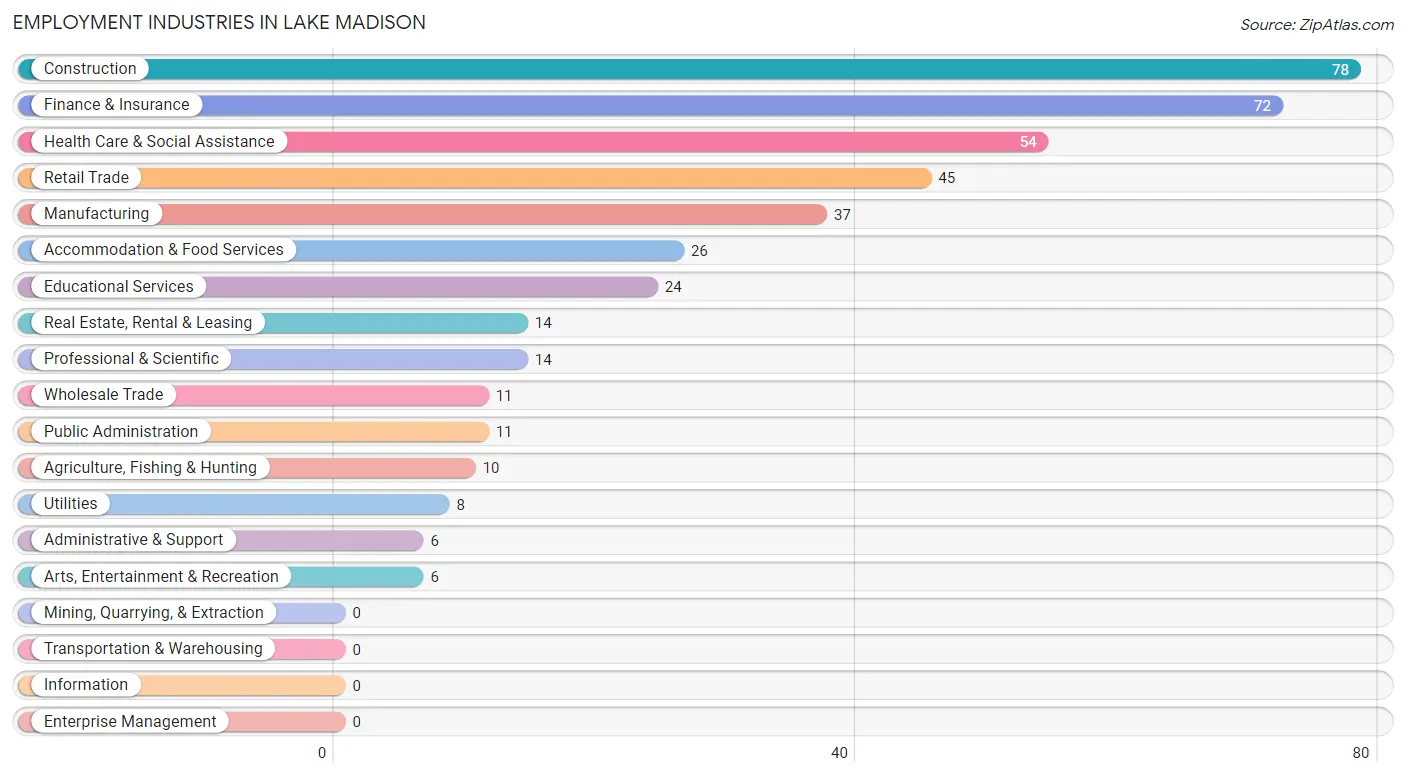
Employment Industries in Lake Madison
The major employment industries in Lake Madison include Construction (78 | 18.0%), Finance & Insurance (72 | 16.6%), Health Care & Social Assistance (54 | 12.4%), Retail Trade (45 | 10.4%), and Manufacturing (37 | 8.5%).
Employment Industries by Sex in Lake Madison
The Lake Madison industries that see more men than women are Agriculture, Fishing & Hunting (100.0%), Wholesale Trade (100.0%), and Utilities (100.0%), whereas the industries that tend to have a higher number of women are Administrative & Support (100.0%), Accommodation & Food Services (100.0%), and Public Administration (100.0%).
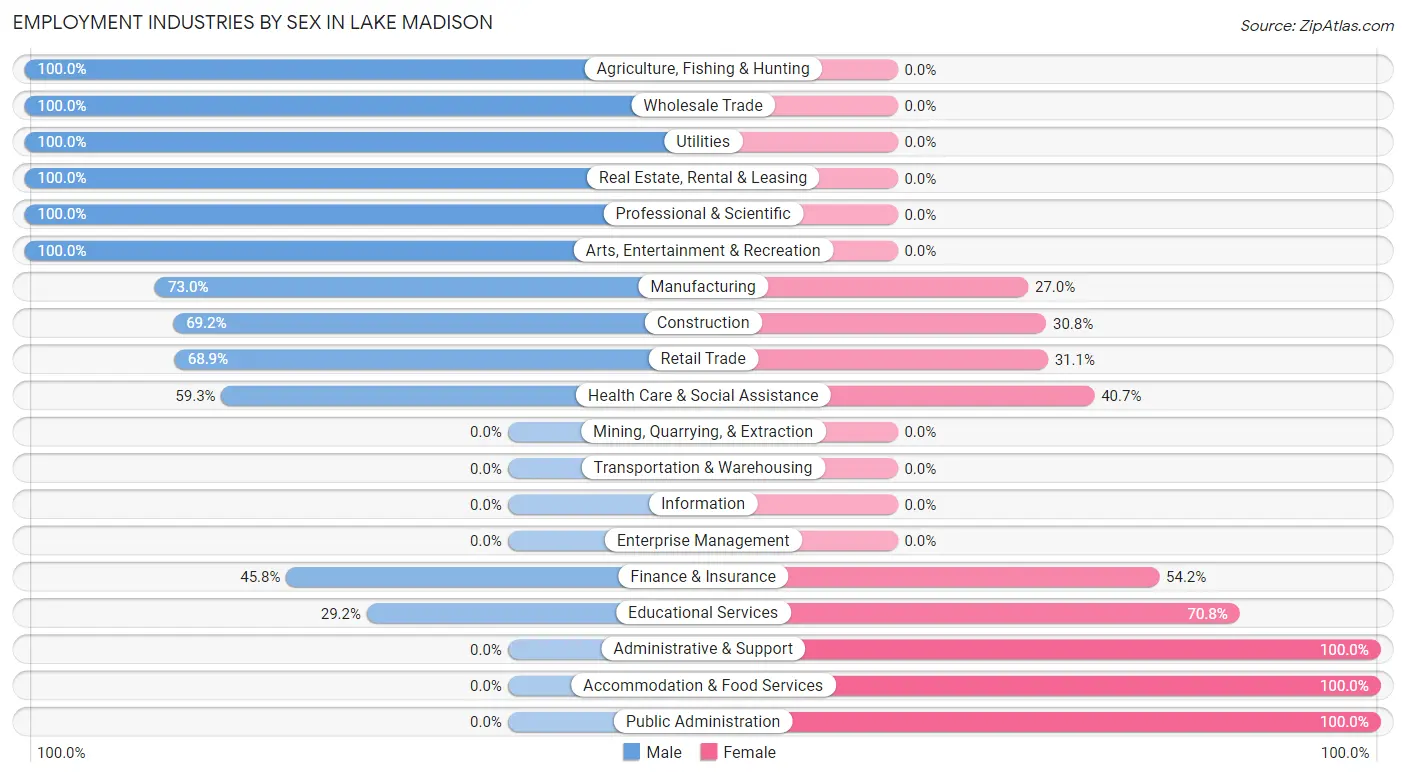
| Industry | Male | Female |
| Agriculture, Fishing & Hunting | 10 (100.0%) | 0 (0.0%) |
| Mining, Quarrying, & Extraction | 0 (0.0%) | 0 (0.0%) |
| Construction | 54 (69.2%) | 24 (30.8%) |
| Manufacturing | 27 (73.0%) | 10 (27.0%) |
| Wholesale Trade | 11 (100.0%) | 0 (0.0%) |
| Retail Trade | 31 (68.9%) | 14 (31.1%) |
| Transportation & Warehousing | 0 (0.0%) | 0 (0.0%) |
| Utilities | 8 (100.0%) | 0 (0.0%) |
| Information | 0 (0.0%) | 0 (0.0%) |
| Finance & Insurance | 33 (45.8%) | 39 (54.2%) |
| Real Estate, Rental & Leasing | 14 (100.0%) | 0 (0.0%) |
| Professional & Scientific | 14 (100.0%) | 0 (0.0%) |
| Enterprise Management | 0 (0.0%) | 0 (0.0%) |
| Administrative & Support | 0 (0.0%) | 6 (100.0%) |
| Educational Services | 7 (29.2%) | 17 (70.8%) |
| Health Care & Social Assistance | 32 (59.3%) | 22 (40.7%) |
| Arts, Entertainment & Recreation | 6 (100.0%) | 0 (0.0%) |
| Accommodation & Food Services | 0 (0.0%) | 26 (100.0%) |
| Public Administration | 0 (0.0%) | 11 (100.0%) |
| Total | 247 (56.9%) | 187 (43.1%) |
Education in Lake Madison
School Enrollment in Lake Madison
The most common levels of schooling among the 93 students in Lake Madison are elementary school (34 | 36.6%), high school (25 | 26.9%), and middle school (18 | 19.4%).
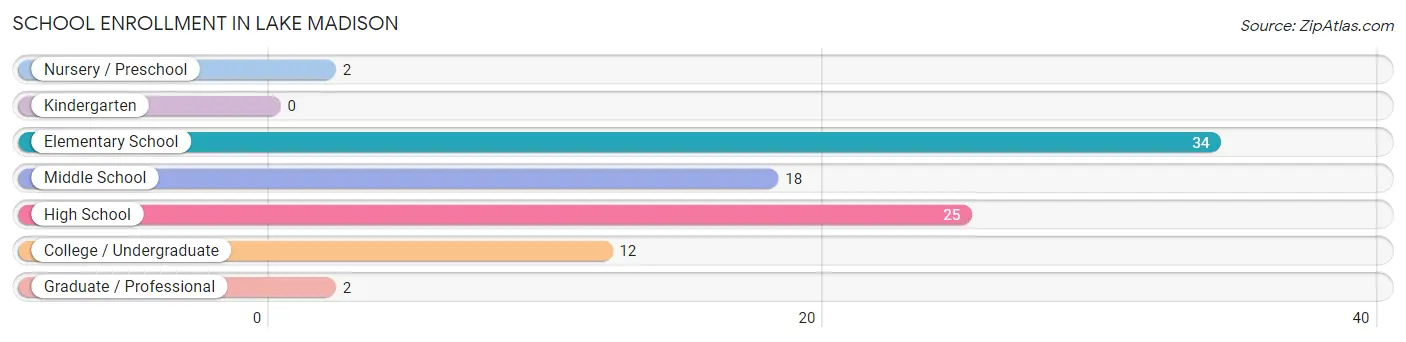
| School Level | # Students | % Students |
| Nursery / Preschool | 2 | 2.1% |
| Kindergarten | 0 | 0.0% |
| Elementary School | 34 | 36.6% |
| Middle School | 18 | 19.4% |
| High School | 25 | 26.9% |
| College / Undergraduate | 12 | 12.9% |
| Graduate / Professional | 2 | 2.1% |
| Total | 93 | 100.0% |
School Enrollment by Age by Funding Source in Lake Madison
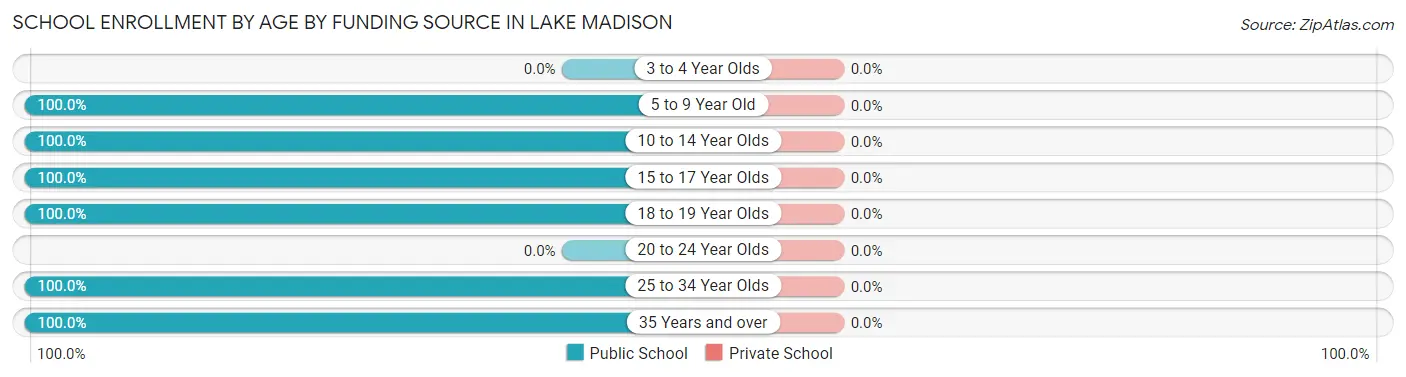
| Age Bracket | Public School | Private School |
| 3 to 4 Year Olds | 0 (0.0%) | 0 (0.0%) |
| 5 to 9 Year Old | 28 (100.0%) | 0 (0.0%) |
| 10 to 14 Year Olds | 23 (100.0%) | 0 (0.0%) |
| 15 to 17 Year Olds | 26 (100.0%) | 0 (0.0%) |
| 18 to 19 Year Olds | 3 (100.0%) | 0 (0.0%) |
| 20 to 24 Year Olds | 0 (0.0%) | 0 (0.0%) |
| 25 to 34 Year Olds | 11 (100.0%) | 0 (0.0%) |
| 35 Years and over | 2 (100.0%) | 0 (0.0%) |
| Total | 93 (100.0%) | 0 (0.0%) |
Educational Attainment by Field of Study in Lake Madison
Education (153 | 36.5%), science & technology (49 | 11.7%), bio, nature & agricultural (45 | 10.7%), engineering (43 | 10.3%), and social sciences (42 | 10.0%) are the most common fields of study among 419 individuals in Lake Madison who have obtained a bachelor's degree or higher.
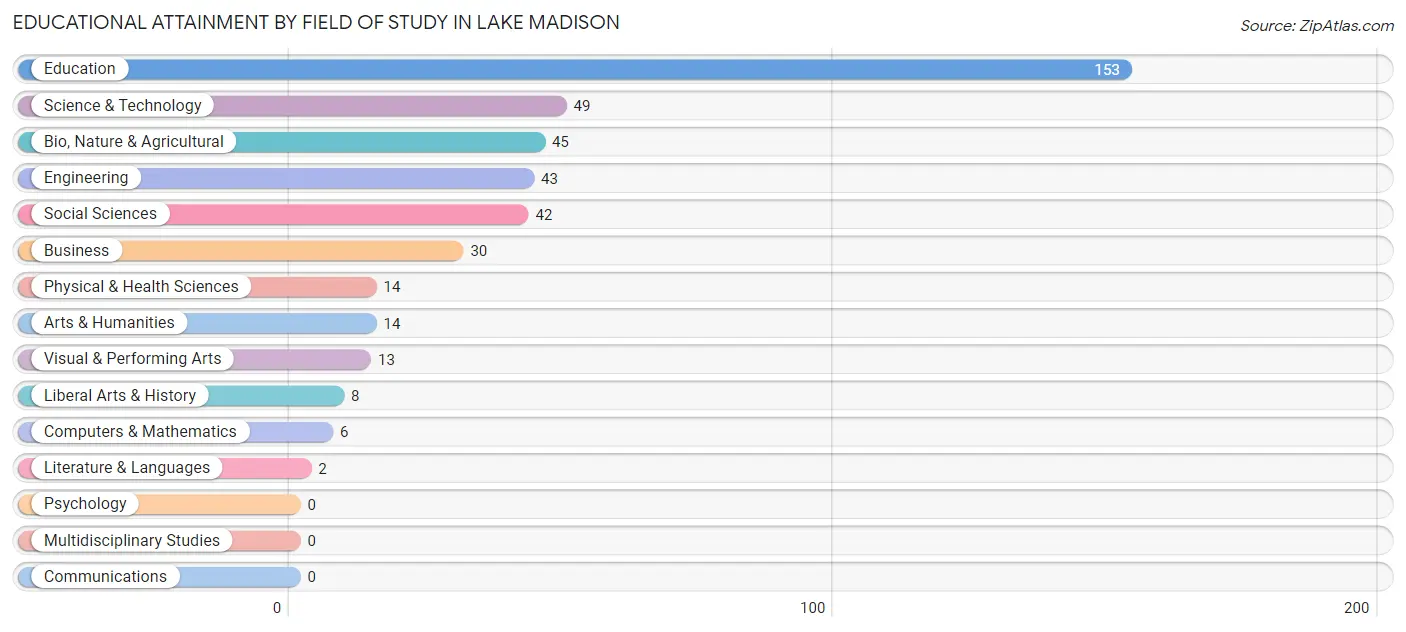
| Field of Study | # Graduates | % Graduates |
| Computers & Mathematics | 6 | 1.4% |
| Bio, Nature & Agricultural | 45 | 10.7% |
| Physical & Health Sciences | 14 | 3.3% |
| Psychology | 0 | 0.0% |
| Social Sciences | 42 | 10.0% |
| Engineering | 43 | 10.3% |
| Multidisciplinary Studies | 0 | 0.0% |
| Science & Technology | 49 | 11.7% |
| Business | 30 | 7.2% |
| Education | 153 | 36.5% |
| Literature & Languages | 2 | 0.5% |
| Liberal Arts & History | 8 | 1.9% |
| Visual & Performing Arts | 13 | 3.1% |
| Communications | 0 | 0.0% |
| Arts & Humanities | 14 | 3.3% |
| Total | 419 | 100.0% |
Transportation & Commute in Lake Madison
Vehicle Availability by Sex in Lake Madison
The most prevalent vehicle ownership categories in Lake Madison are males with 2 vehicles (138, accounting for 55.9%) and females with 2 vehicles (109, making up 73.8%).
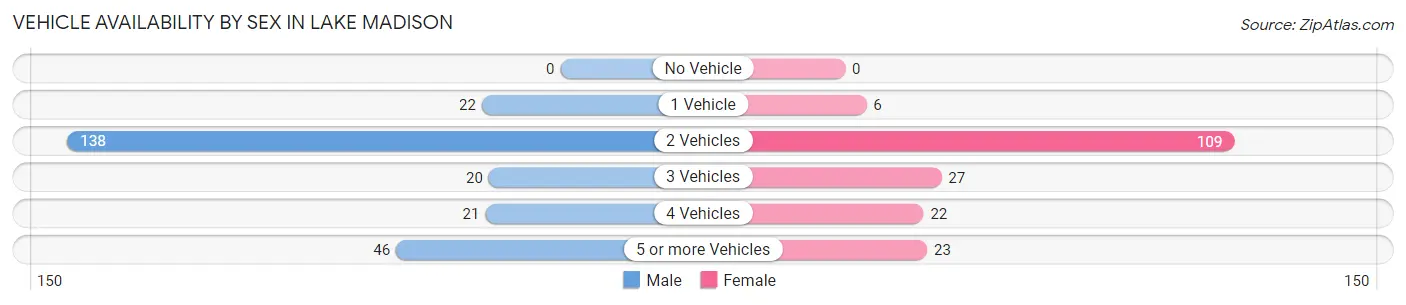
| Vehicles Available | Male | Female |
| No Vehicle | 0 (0.0%) | 0 (0.0%) |
| 1 Vehicle | 22 (8.9%) | 6 (3.2%) |
| 2 Vehicles | 138 (55.9%) | 109 (58.3%) |
| 3 Vehicles | 20 (8.1%) | 27 (14.4%) |
| 4 Vehicles | 21 (8.5%) | 22 (11.8%) |
| 5 or more Vehicles | 46 (18.6%) | 23 (12.3%) |
| Total | 247 (100.0%) | 187 (100.0%) |
Commute Time in Lake Madison
The most frequently occuring commute durations in Lake Madison are 5 to 9 minutes (77 commuters, 25.3%), 10 to 14 minutes (54 commuters, 17.8%), and 45 to 59 minutes (45 commuters, 14.8%).
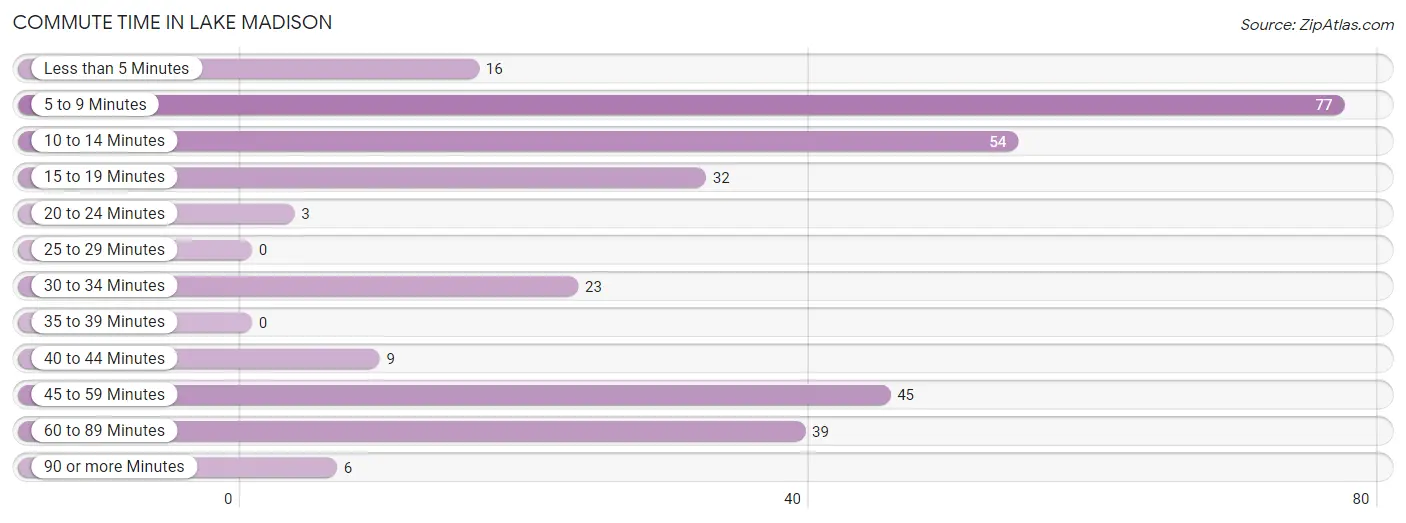
| Commute Time | # Commuters | % Commuters |
| Less than 5 Minutes | 16 | 5.3% |
| 5 to 9 Minutes | 77 | 25.3% |
| 10 to 14 Minutes | 54 | 17.8% |
| 15 to 19 Minutes | 32 | 10.5% |
| 20 to 24 Minutes | 3 | 1.0% |
| 25 to 29 Minutes | 0 | 0.0% |
| 30 to 34 Minutes | 23 | 7.6% |
| 35 to 39 Minutes | 0 | 0.0% |
| 40 to 44 Minutes | 9 | 3.0% |
| 45 to 59 Minutes | 45 | 14.8% |
| 60 to 89 Minutes | 39 | 12.8% |
| 90 or more Minutes | 6 | 2.0% |
Commute Time by Sex in Lake Madison
The most common commute times in Lake Madison are 5 to 9 minutes (34 commuters, 20.5%) for males and 5 to 9 minutes (43 commuters, 31.2%) for females.
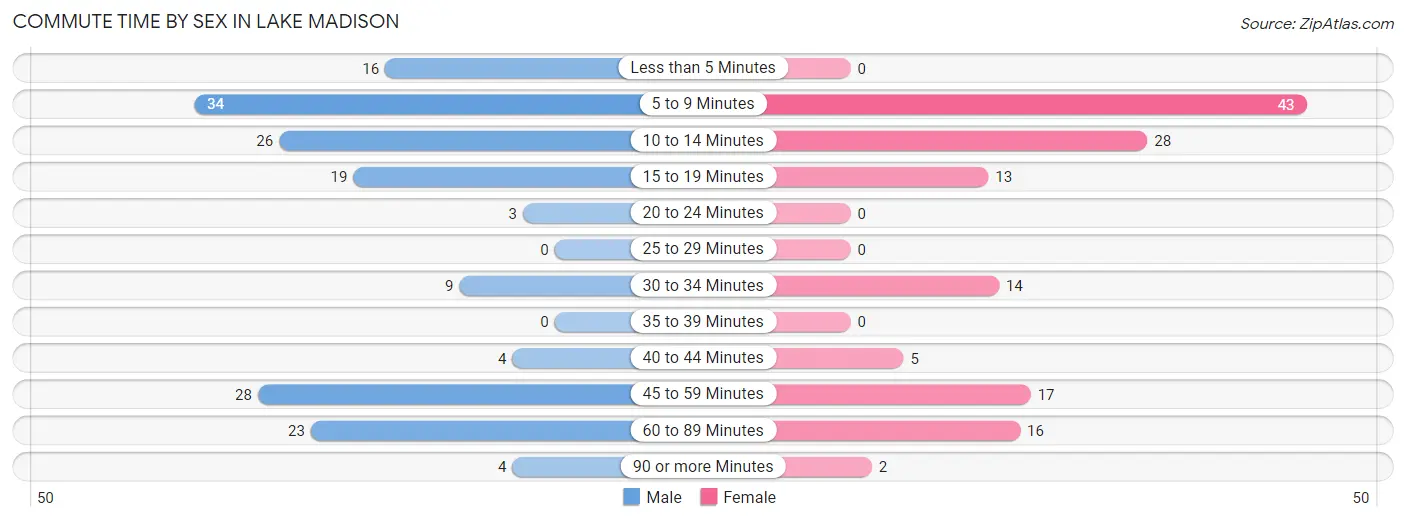
| Commute Time | Male | Female |
| Less than 5 Minutes | 16 (9.6%) | 0 (0.0%) |
| 5 to 9 Minutes | 34 (20.5%) | 43 (31.2%) |
| 10 to 14 Minutes | 26 (15.7%) | 28 (20.3%) |
| 15 to 19 Minutes | 19 (11.5%) | 13 (9.4%) |
| 20 to 24 Minutes | 3 (1.8%) | 0 (0.0%) |
| 25 to 29 Minutes | 0 (0.0%) | 0 (0.0%) |
| 30 to 34 Minutes | 9 (5.4%) | 14 (10.1%) |
| 35 to 39 Minutes | 0 (0.0%) | 0 (0.0%) |
| 40 to 44 Minutes | 4 (2.4%) | 5 (3.6%) |
| 45 to 59 Minutes | 28 (16.9%) | 17 (12.3%) |
| 60 to 89 Minutes | 23 (13.9%) | 16 (11.6%) |
| 90 or more Minutes | 4 (2.4%) | 2 (1.5%) |
Time of Departure to Work by Sex in Lake Madison
The most frequent times of departure to work in Lake Madison are 7:00 AM to 7:29 AM (50, 30.1%) for males and 7:00 AM to 7:29 AM (49, 35.5%) for females.
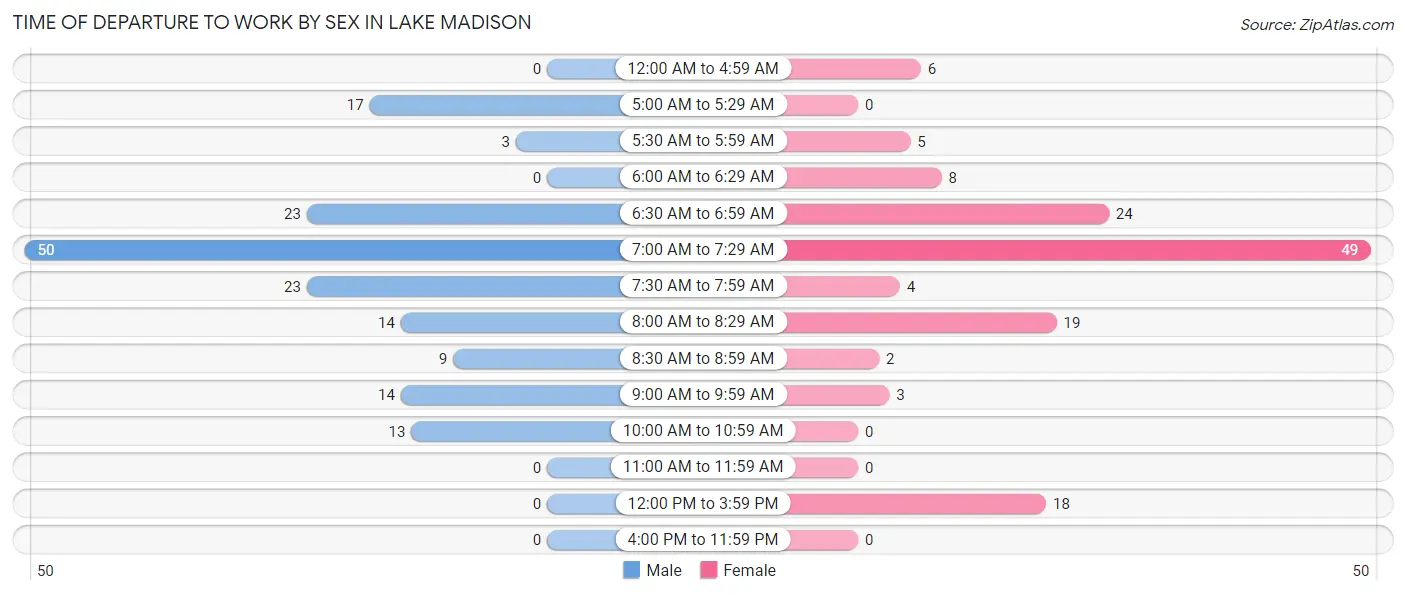
| Time of Departure | Male | Female |
| 12:00 AM to 4:59 AM | 0 (0.0%) | 6 (4.3%) |
| 5:00 AM to 5:29 AM | 17 (10.2%) | 0 (0.0%) |
| 5:30 AM to 5:59 AM | 3 (1.8%) | 5 (3.6%) |
| 6:00 AM to 6:29 AM | 0 (0.0%) | 8 (5.8%) |
| 6:30 AM to 6:59 AM | 23 (13.9%) | 24 (17.4%) |
| 7:00 AM to 7:29 AM | 50 (30.1%) | 49 (35.5%) |
| 7:30 AM to 7:59 AM | 23 (13.9%) | 4 (2.9%) |
| 8:00 AM to 8:29 AM | 14 (8.4%) | 19 (13.8%) |
| 8:30 AM to 8:59 AM | 9 (5.4%) | 2 (1.5%) |
| 9:00 AM to 9:59 AM | 14 (8.4%) | 3 (2.2%) |
| 10:00 AM to 10:59 AM | 13 (7.8%) | 0 (0.0%) |
| 11:00 AM to 11:59 AM | 0 (0.0%) | 0 (0.0%) |
| 12:00 PM to 3:59 PM | 0 (0.0%) | 18 (13.0%) |
| 4:00 PM to 11:59 PM | 0 (0.0%) | 0 (0.0%) |
| Total | 166 (100.0%) | 138 (100.0%) |
Housing Occupancy in Lake Madison
Occupancy by Ownership in Lake Madison
Of the total 421 dwellings in Lake Madison, owner-occupied units account for 383 (91.0%), while renter-occupied units make up 38 (9.0%).
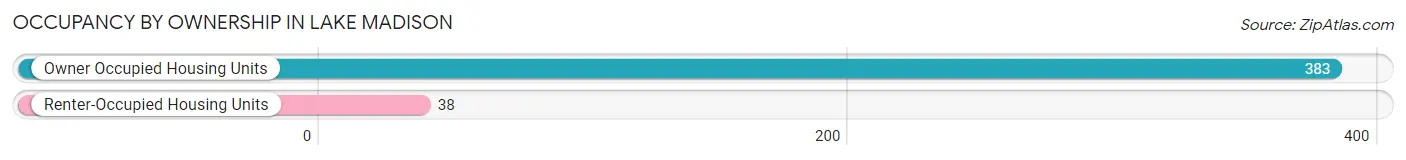
| Occupancy | # Housing Units | % Housing Units |
| Owner Occupied Housing Units | 383 | 91.0% |
| Renter-Occupied Housing Units | 38 | 9.0% |
| Total Occupied Housing Units | 421 | 100.0% |
Occupancy by Household Size in Lake Madison
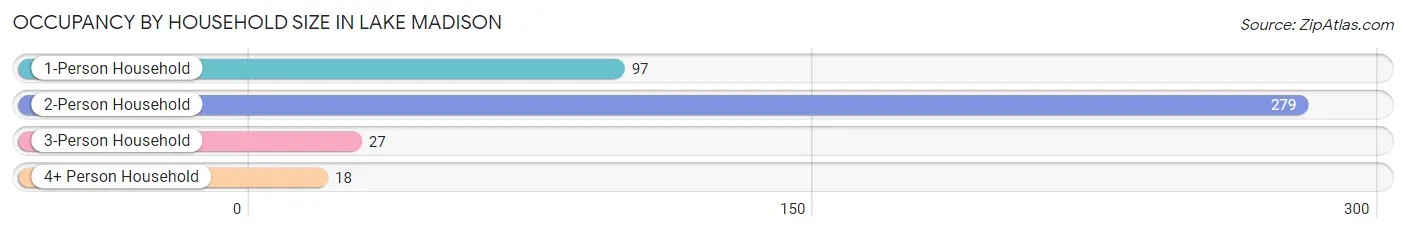
| Household Size | # Housing Units | % Housing Units |
| 1-Person Household | 97 | 23.0% |
| 2-Person Household | 279 | 66.3% |
| 3-Person Household | 27 | 6.4% |
| 4+ Person Household | 18 | 4.3% |
| Total Housing Units | 421 | 100.0% |
Occupancy by Ownership by Household Size in Lake Madison
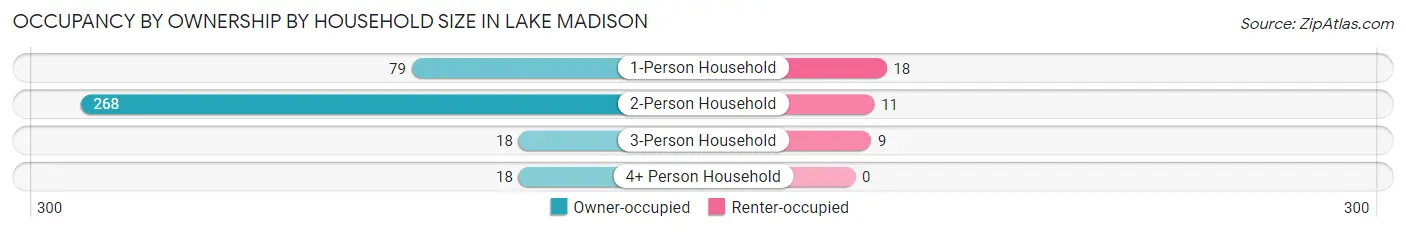
| Household Size | Owner-occupied | Renter-occupied |
| 1-Person Household | 79 (81.4%) | 18 (18.6%) |
| 2-Person Household | 268 (96.1%) | 11 (3.9%) |
| 3-Person Household | 18 (66.7%) | 9 (33.3%) |
| 4+ Person Household | 18 (100.0%) | 0 (0.0%) |
| Total Housing Units | 383 (91.0%) | 38 (9.0%) |
Occupancy by Educational Attainment in Lake Madison
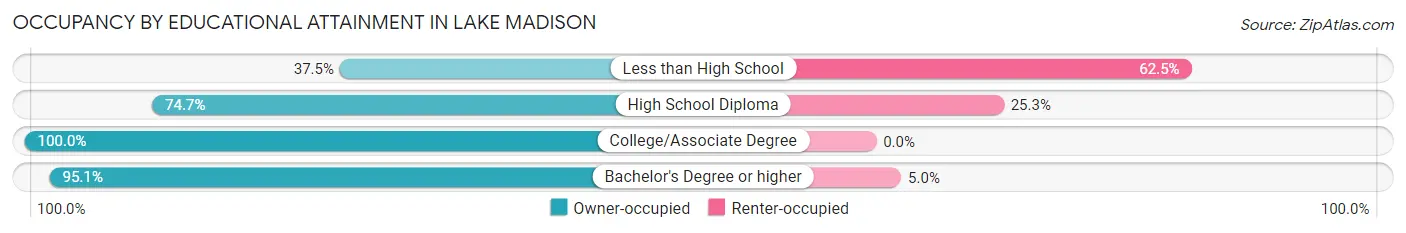
| Household Size | Owner-occupied | Renter-occupied |
| Less than High School | 3 (37.5%) | 5 (62.5%) |
| High School Diploma | 65 (74.7%) | 22 (25.3%) |
| College/Associate Degree | 104 (100.0%) | 0 (0.0%) |
| Bachelor's Degree or higher | 211 (95.1%) | 11 (5.0%) |
Occupancy by Age of Householder in Lake Madison
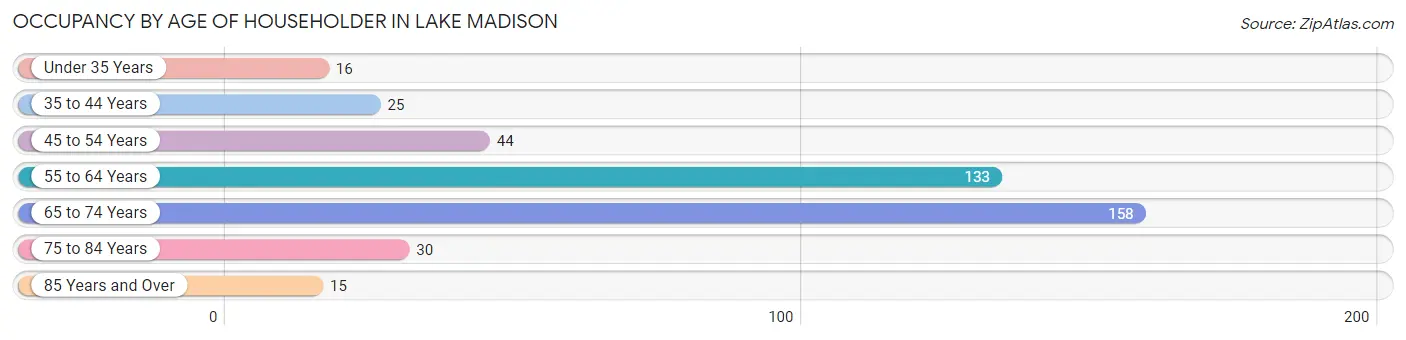
| Age Bracket | # Households | % Households |
| Under 35 Years | 16 | 3.8% |
| 35 to 44 Years | 25 | 5.9% |
| 45 to 54 Years | 44 | 10.4% |
| 55 to 64 Years | 133 | 31.6% |
| 65 to 74 Years | 158 | 37.5% |
| 75 to 84 Years | 30 | 7.1% |
| 85 Years and Over | 15 | 3.6% |
| Total | 421 | 100.0% |
Housing Finances in Lake Madison
Median Income by Occupancy in Lake Madison
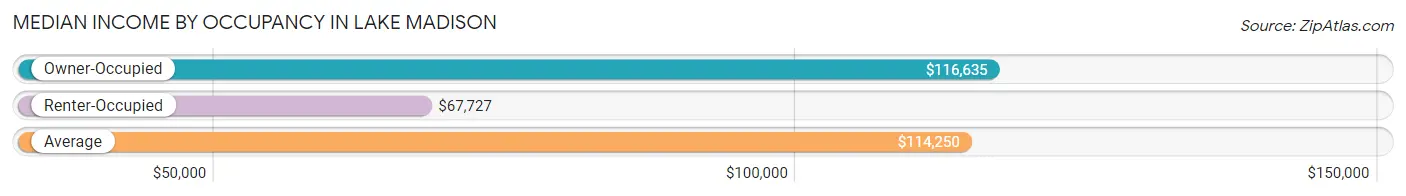
| Occupancy Type | # Households | Median Income |
| Owner-Occupied | 383 (91.0%) | $116,635 |
| Renter-Occupied | 38 (9.0%) | $67,727 |
| Average | 421 (100.0%) | $114,250 |
Occupancy by Householder Income Bracket in Lake Madison
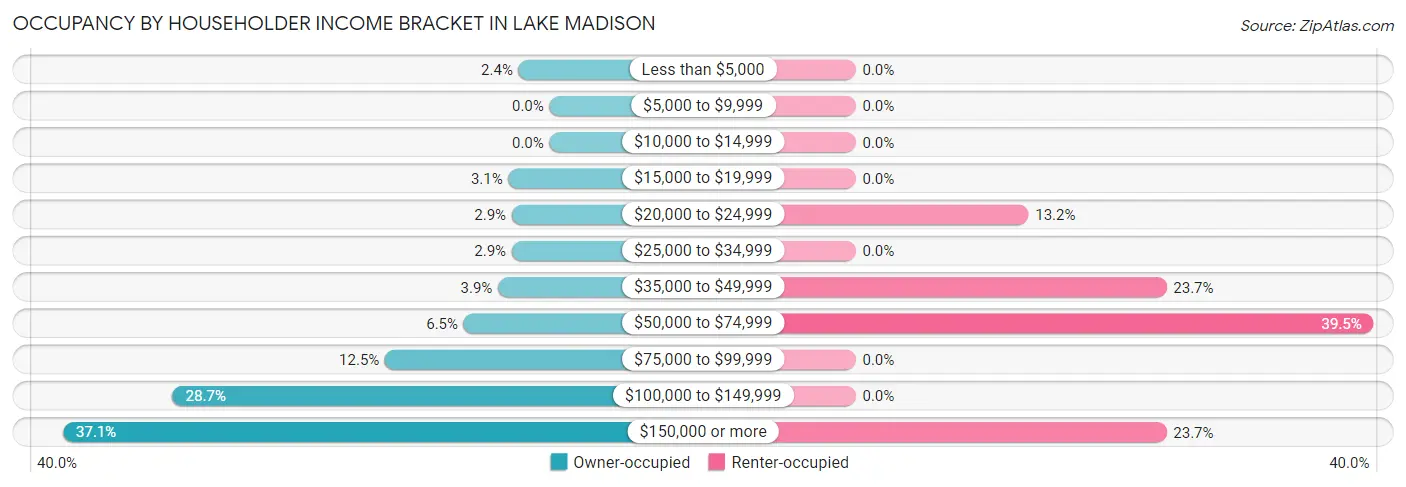
| Income Bracket | Owner-occupied | Renter-occupied |
| Less than $5,000 | 9 (2.4%) | 0 (0.0%) |
| $5,000 to $9,999 | 0 (0.0%) | 0 (0.0%) |
| $10,000 to $14,999 | 0 (0.0%) | 0 (0.0%) |
| $15,000 to $19,999 | 12 (3.1%) | 0 (0.0%) |
| $20,000 to $24,999 | 11 (2.9%) | 5 (13.2%) |
| $25,000 to $34,999 | 11 (2.9%) | 0 (0.0%) |
| $35,000 to $49,999 | 15 (3.9%) | 9 (23.7%) |
| $50,000 to $74,999 | 25 (6.5%) | 15 (39.5%) |
| $75,000 to $99,999 | 48 (12.5%) | 0 (0.0%) |
| $100,000 to $149,999 | 110 (28.7%) | 0 (0.0%) |
| $150,000 or more | 142 (37.1%) | 9 (23.7%) |
| Total | 383 (100.0%) | 38 (100.0%) |
Monthly Housing Cost Tiers in Lake Madison
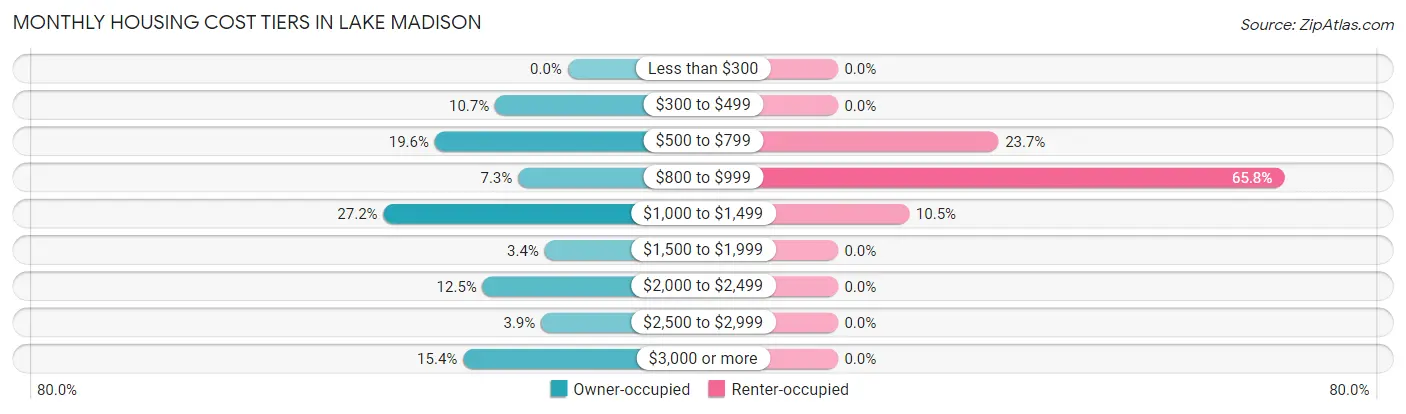
| Monthly Cost | Owner-occupied | Renter-occupied |
| Less than $300 | 0 (0.0%) | 0 (0.0%) |
| $300 to $499 | 41 (10.7%) | 0 (0.0%) |
| $500 to $799 | 75 (19.6%) | 9 (23.7%) |
| $800 to $999 | 28 (7.3%) | 25 (65.8%) |
| $1,000 to $1,499 | 104 (27.2%) | 4 (10.5%) |
| $1,500 to $1,999 | 13 (3.4%) | 0 (0.0%) |
| $2,000 to $2,499 | 48 (12.5%) | 0 (0.0%) |
| $2,500 to $2,999 | 15 (3.9%) | 0 (0.0%) |
| $3,000 or more | 59 (15.4%) | 0 (0.0%) |
| Total | 383 (100.0%) | 38 (100.0%) |
Physical Housing Characteristics in Lake Madison
Housing Structures in Lake Madison
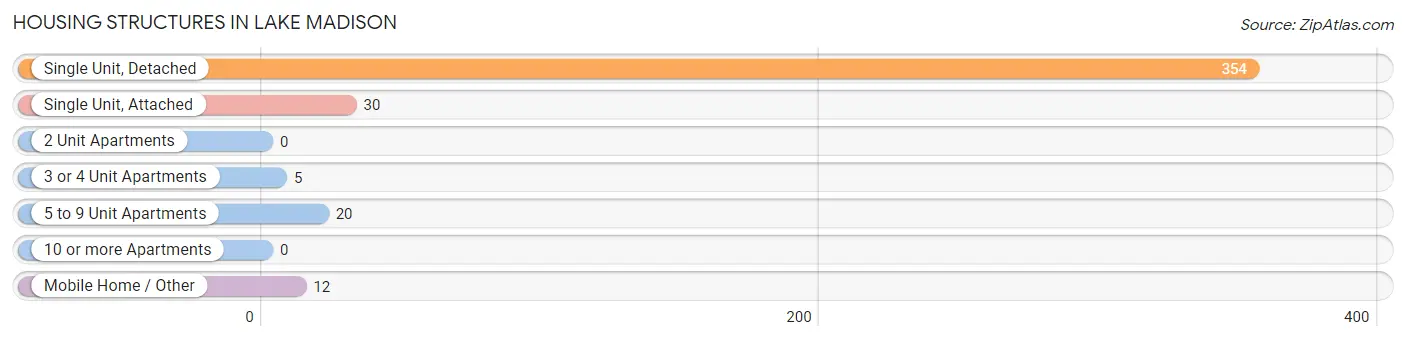
| Structure Type | # Housing Units | % Housing Units |
| Single Unit, Detached | 354 | 84.1% |
| Single Unit, Attached | 30 | 7.1% |
| 2 Unit Apartments | 0 | 0.0% |
| 3 or 4 Unit Apartments | 5 | 1.2% |
| 5 to 9 Unit Apartments | 20 | 4.8% |
| 10 or more Apartments | 0 | 0.0% |
| Mobile Home / Other | 12 | 2.9% |
| Total | 421 | 100.0% |
Housing Structures by Occupancy in Lake Madison
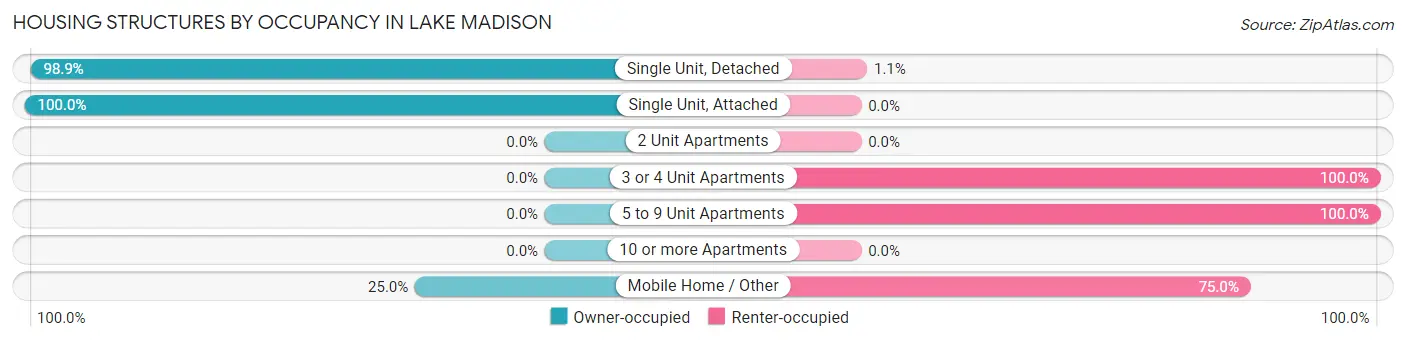
| Structure Type | Owner-occupied | Renter-occupied |
| Single Unit, Detached | 350 (98.9%) | 4 (1.1%) |
| Single Unit, Attached | 30 (100.0%) | 0 (0.0%) |
| 2 Unit Apartments | 0 (0.0%) | 0 (0.0%) |
| 3 or 4 Unit Apartments | 0 (0.0%) | 5 (100.0%) |
| 5 to 9 Unit Apartments | 0 (0.0%) | 20 (100.0%) |
| 10 or more Apartments | 0 (0.0%) | 0 (0.0%) |
| Mobile Home / Other | 3 (25.0%) | 9 (75.0%) |
| Total | 383 (91.0%) | 38 (9.0%) |
Housing Structures by Number of Rooms in Lake Madison
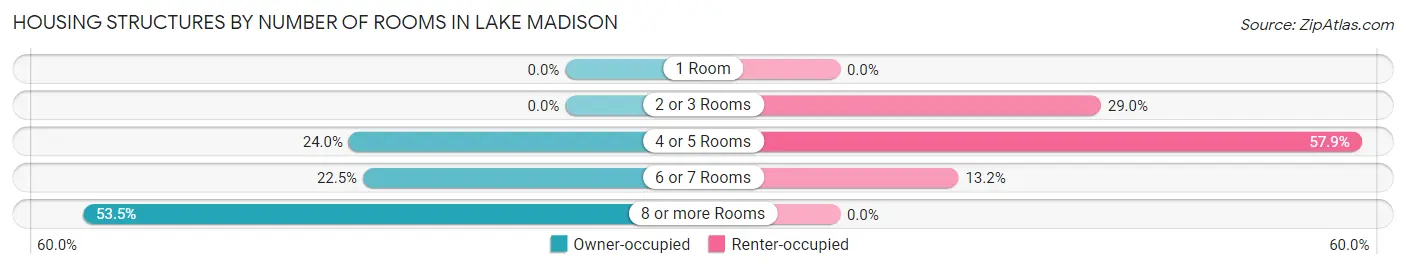
| Number of Rooms | Owner-occupied | Renter-occupied |
| 1 Room | 0 (0.0%) | 0 (0.0%) |
| 2 or 3 Rooms | 0 (0.0%) | 11 (28.9%) |
| 4 or 5 Rooms | 92 (24.0%) | 22 (57.9%) |
| 6 or 7 Rooms | 86 (22.5%) | 5 (13.2%) |
| 8 or more Rooms | 205 (53.5%) | 0 (0.0%) |
| Total | 383 (100.0%) | 38 (100.0%) |
Housing Structure by Heating Type in Lake Madison
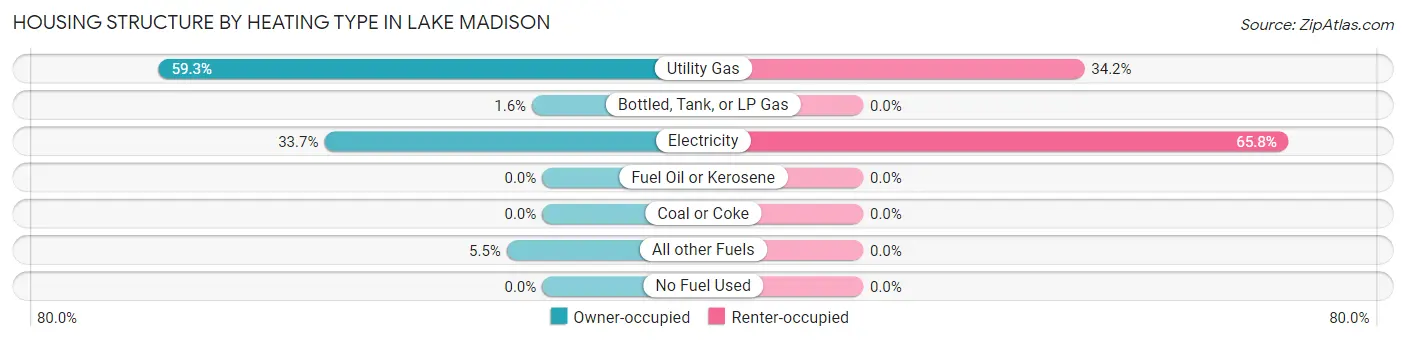
| Heating Type | Owner-occupied | Renter-occupied |
| Utility Gas | 227 (59.3%) | 13 (34.2%) |
| Bottled, Tank, or LP Gas | 6 (1.6%) | 0 (0.0%) |
| Electricity | 129 (33.7%) | 25 (65.8%) |
| Fuel Oil or Kerosene | 0 (0.0%) | 0 (0.0%) |
| Coal or Coke | 0 (0.0%) | 0 (0.0%) |
| All other Fuels | 21 (5.5%) | 0 (0.0%) |
| No Fuel Used | 0 (0.0%) | 0 (0.0%) |
| Total | 383 (100.0%) | 38 (100.0%) |
Household Vehicle Usage in Lake Madison
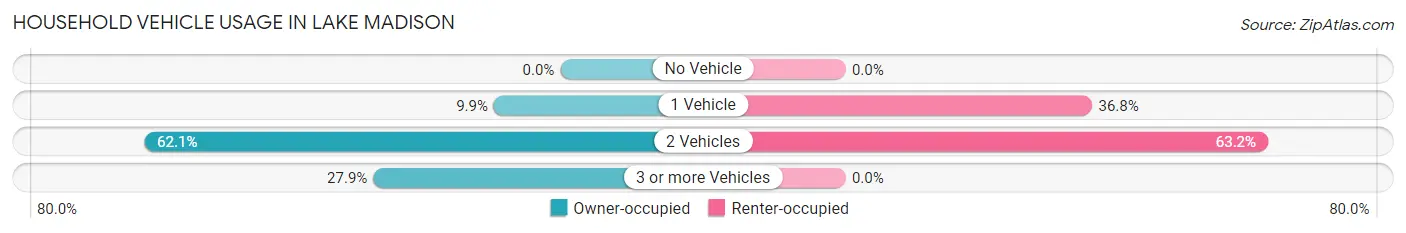
| Vehicles per Household | Owner-occupied | Renter-occupied |
| No Vehicle | 0 (0.0%) | 0 (0.0%) |
| 1 Vehicle | 38 (9.9%) | 14 (36.8%) |
| 2 Vehicles | 238 (62.1%) | 24 (63.2%) |
| 3 or more Vehicles | 107 (27.9%) | 0 (0.0%) |
| Total | 383 (100.0%) | 38 (100.0%) |
Real Estate & Mortgages in Lake Madison
Real Estate and Mortgage Overview in Lake Madison
| Characteristic | Without Mortgage | With Mortgage |
| Housing Units | 223 | 160 |
| Median Property Value | $604,200 | $472,200 |
| Median Household Income | $100,795 | $79 |
| Monthly Housing Costs | $865 | $59 |
| Real Estate Taxes | $4,026 | $5 |
Property Value by Mortgage Status in Lake Madison
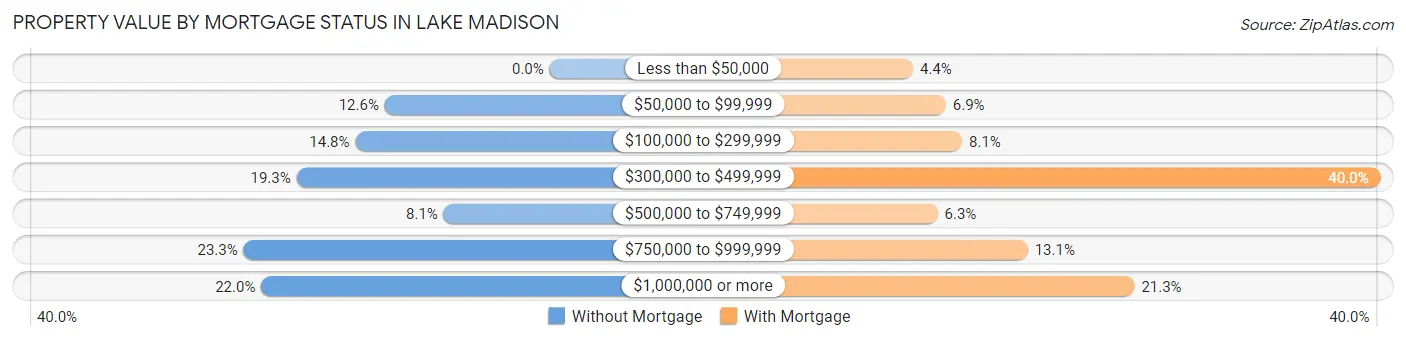
| Property Value | Without Mortgage | With Mortgage |
| Less than $50,000 | 0 (0.0%) | 7 (4.4%) |
| $50,000 to $99,999 | 28 (12.6%) | 11 (6.9%) |
| $100,000 to $299,999 | 33 (14.8%) | 13 (8.1%) |
| $300,000 to $499,999 | 43 (19.3%) | 64 (40.0%) |
| $500,000 to $749,999 | 18 (8.1%) | 10 (6.2%) |
| $750,000 to $999,999 | 52 (23.3%) | 21 (13.1%) |
| $1,000,000 or more | 49 (22.0%) | 34 (21.2%) |
| Total | 223 (100.0%) | 160 (100.0%) |
Household Income by Mortgage Status in Lake Madison
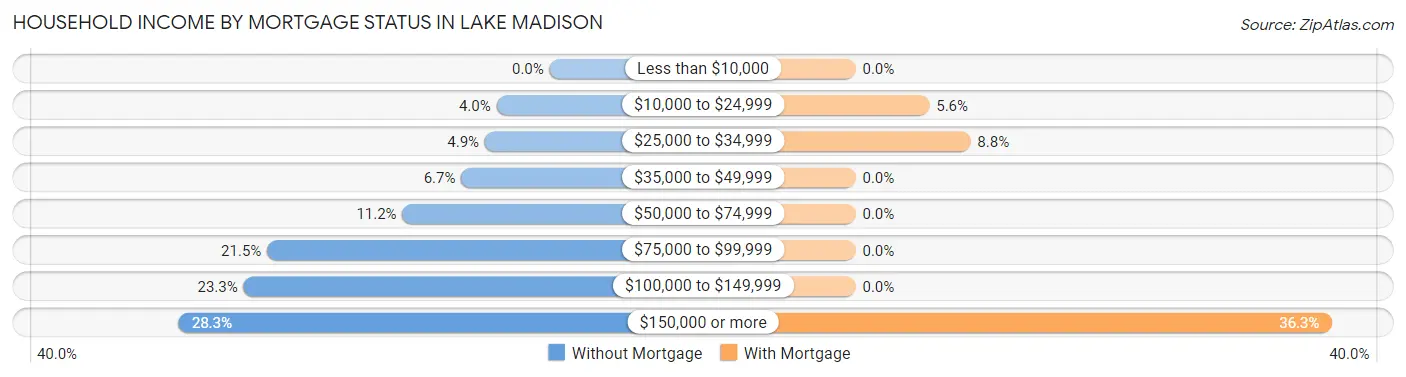
| Household Income | Without Mortgage | With Mortgage |
| Less than $10,000 | 0 (0.0%) | 0 (0.0%) |
| $10,000 to $24,999 | 9 (4.0%) | 9 (5.6%) |
| $25,000 to $34,999 | 11 (4.9%) | 14 (8.7%) |
| $35,000 to $49,999 | 15 (6.7%) | 0 (0.0%) |
| $50,000 to $74,999 | 25 (11.2%) | 0 (0.0%) |
| $75,000 to $99,999 | 48 (21.5%) | 0 (0.0%) |
| $100,000 to $149,999 | 52 (23.3%) | 0 (0.0%) |
| $150,000 or more | 63 (28.2%) | 58 (36.2%) |
| Total | 223 (100.0%) | 160 (100.0%) |
Property Value to Household Income Ratio in Lake Madison
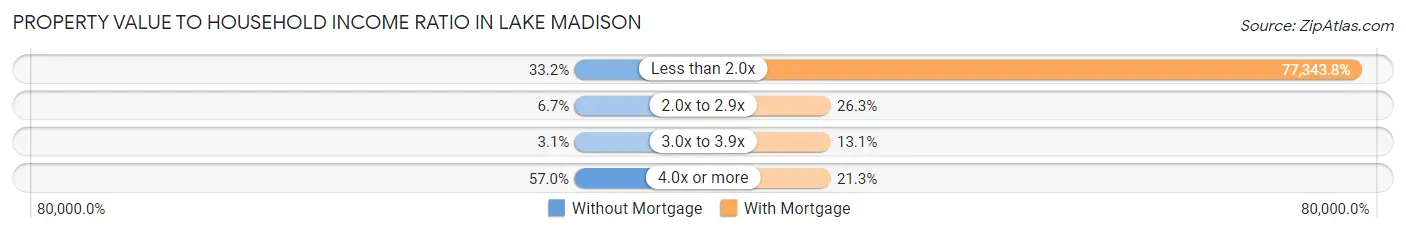
| Value-to-Income Ratio | Without Mortgage | With Mortgage |
| Less than 2.0x | 74 (33.2%) | 123,750 (77,343.8%) |
| 2.0x to 2.9x | 15 (6.7%) | 42 (26.3%) |
| 3.0x to 3.9x | 7 (3.1%) | 21 (13.1%) |
| 4.0x or more | 127 (57.0%) | 34 (21.2%) |
| Total | 223 (100.0%) | 160 (100.0%) |
Real Estate Taxes by Mortgage Status in Lake Madison
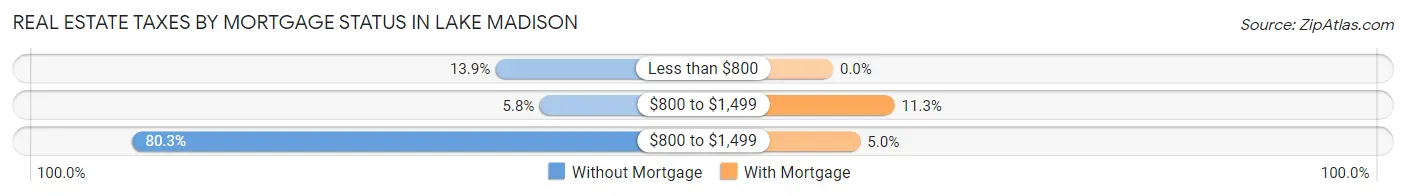
| Property Taxes | Without Mortgage | With Mortgage |
| Less than $800 | 31 (13.9%) | 0 (0.0%) |
| $800 to $1,499 | 13 (5.8%) | 18 (11.3%) |
| $800 to $1,499 | 179 (80.3%) | 8 (5.0%) |
| Total | 223 (100.0%) | 160 (100.0%) |
Health & Disability in Lake Madison
Health Insurance Coverage by Age in Lake Madison
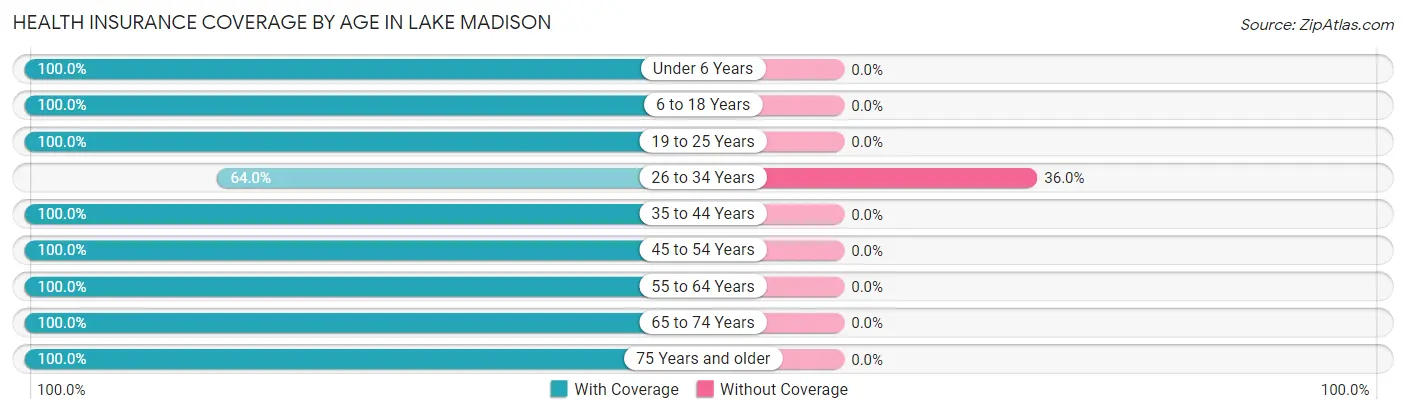
| Age Bracket | With Coverage | Without Coverage |
| Under 6 Years | 2 (100.0%) | 0 (0.0%) |
| 6 to 18 Years | 77 (100.0%) | 0 (0.0%) |
| 19 to 25 Years | 3 (100.0%) | 0 (0.0%) |
| 26 to 34 Years | 32 (64.0%) | 18 (36.0%) |
| 35 to 44 Years | 56 (100.0%) | 0 (0.0%) |
| 45 to 54 Years | 83 (100.0%) | 0 (0.0%) |
| 55 to 64 Years | 225 (100.0%) | 0 (0.0%) |
| 65 to 74 Years | 283 (100.0%) | 0 (0.0%) |
| 75 Years and older | 71 (100.0%) | 0 (0.0%) |
| Total | 832 (97.9%) | 18 (2.1%) |
Health Insurance Coverage by Citizenship Status in Lake Madison
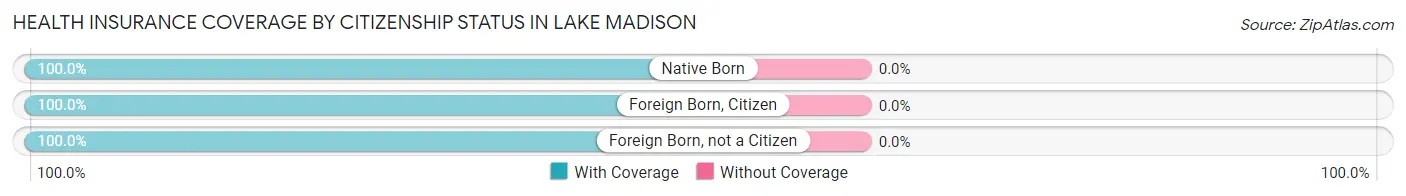
| Citizenship Status | With Coverage | Without Coverage |
| Native Born | 2 (100.0%) | 0 (0.0%) |
| Foreign Born, Citizen | 77 (100.0%) | 0 (0.0%) |
| Foreign Born, not a Citizen | 3 (100.0%) | 0 (0.0%) |
Health Insurance Coverage by Household Income in Lake Madison
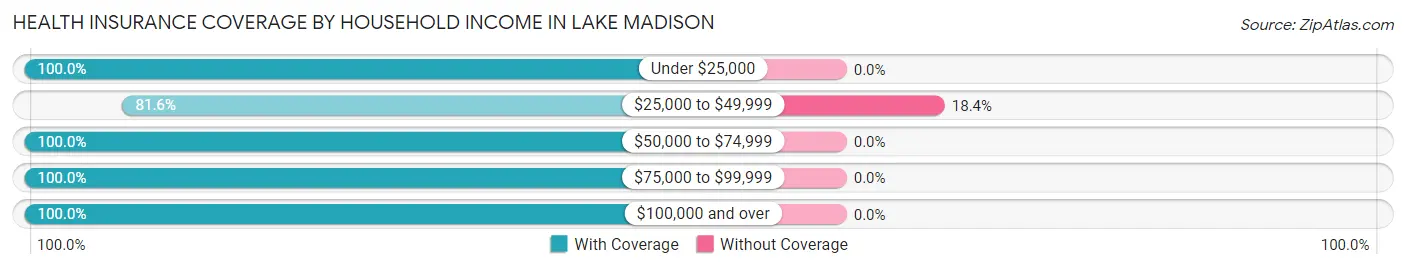
| Household Income | With Coverage | Without Coverage |
| Under $25,000 | 37 (100.0%) | 0 (0.0%) |
| $25,000 to $49,999 | 80 (81.6%) | 18 (18.4%) |
| $50,000 to $74,999 | 72 (100.0%) | 0 (0.0%) |
| $75,000 to $99,999 | 93 (100.0%) | 0 (0.0%) |
| $100,000 and over | 550 (100.0%) | 0 (0.0%) |
Public vs Private Health Insurance Coverage by Age in Lake Madison
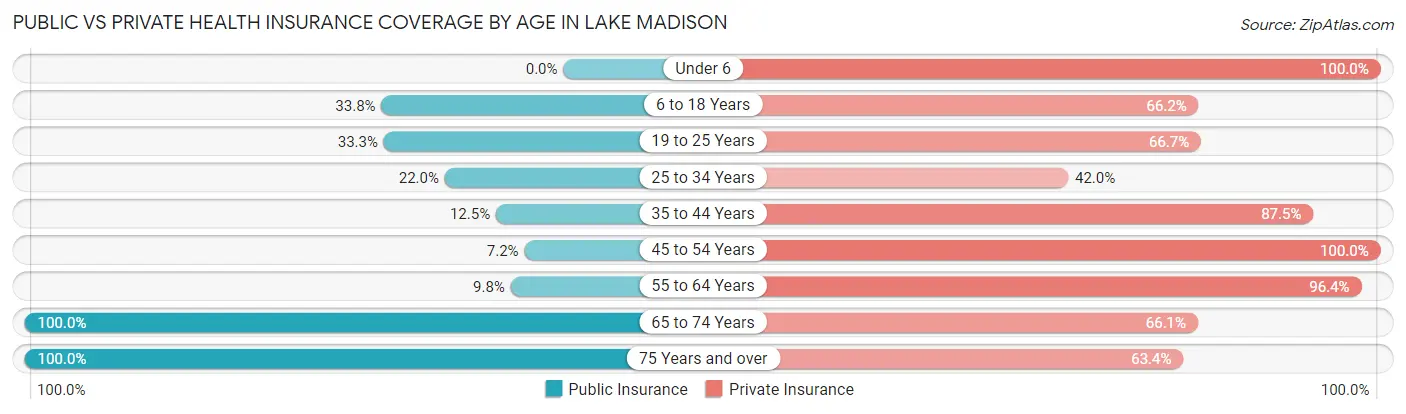
| Age Bracket | Public Insurance | Private Insurance |
| Under 6 | 0 (0.0%) | 2 (100.0%) |
| 6 to 18 Years | 26 (33.8%) | 51 (66.2%) |
| 19 to 25 Years | 1 (33.3%) | 2 (66.7%) |
| 25 to 34 Years | 11 (22.0%) | 21 (42.0%) |
| 35 to 44 Years | 7 (12.5%) | 49 (87.5%) |
| 45 to 54 Years | 6 (7.2%) | 83 (100.0%) |
| 55 to 64 Years | 22 (9.8%) | 217 (96.4%) |
| 65 to 74 Years | 283 (100.0%) | 187 (66.1%) |
| 75 Years and over | 71 (100.0%) | 45 (63.4%) |
| Total | 427 (50.2%) | 657 (77.3%) |
Disability Status by Sex by Age in Lake Madison
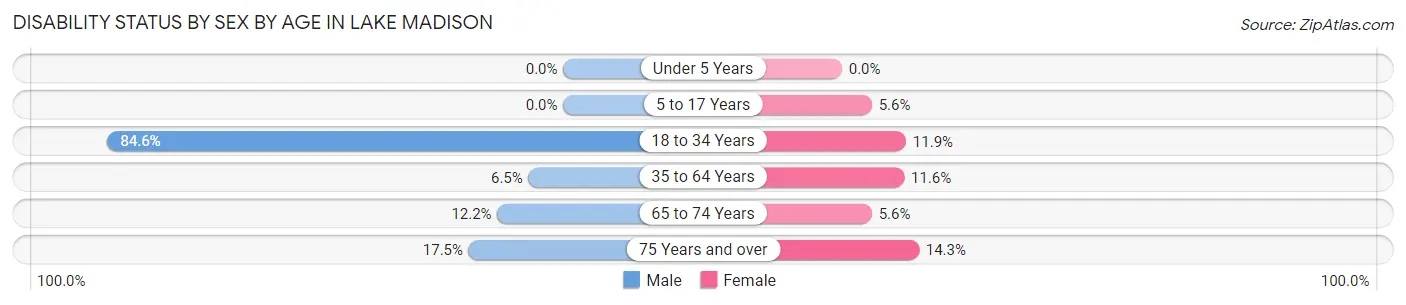
| Age Bracket | Male | Female |
| Under 5 Years | 0 (0.0%) | 0 (0.0%) |
| 5 to 17 Years | 0 (0.0%) | 3 (5.6%) |
| 18 to 34 Years | 11 (84.6%) | 5 (11.9%) |
| 35 to 64 Years | 14 (6.5%) | 17 (11.6%) |
| 65 to 74 Years | 17 (12.2%) | 8 (5.6%) |
| 75 Years and over | 10 (17.5%) | 2 (14.3%) |
Disability Class by Sex by Age in Lake Madison
Disability Class: Hearing Difficulty
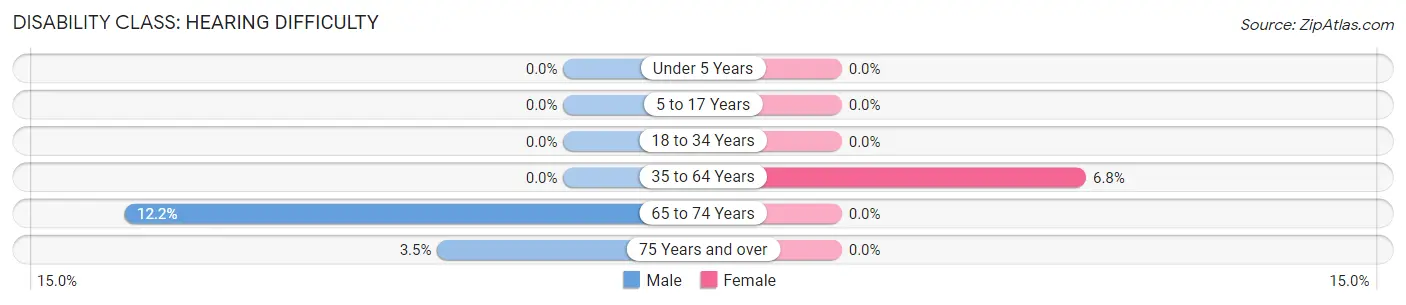
| Age Bracket | Male | Female |
| Under 5 Years | 0 (0.0%) | 0 (0.0%) |
| 5 to 17 Years | 0 (0.0%) | 0 (0.0%) |
| 18 to 34 Years | 0 (0.0%) | 0 (0.0%) |
| 35 to 64 Years | 0 (0.0%) | 10 (6.8%) |
| 65 to 74 Years | 17 (12.2%) | 0 (0.0%) |
| 75 Years and over | 2 (3.5%) | 0 (0.0%) |
Disability Class: Vision Difficulty
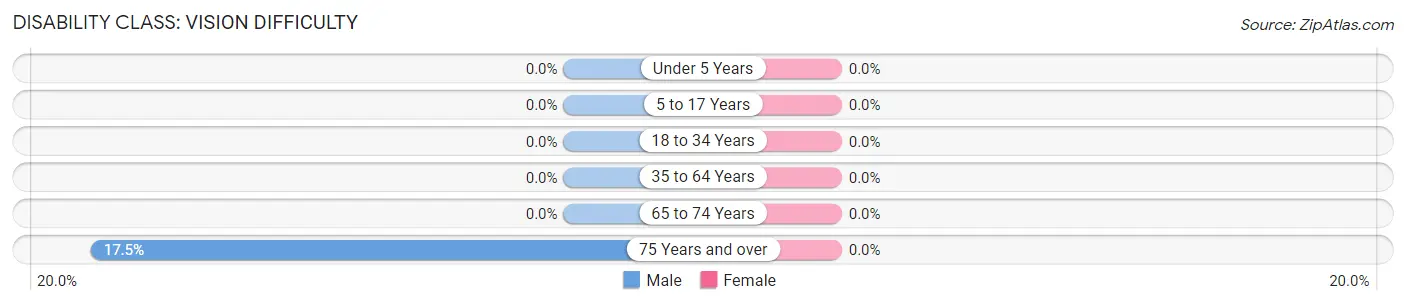
| Age Bracket | Male | Female |
| Under 5 Years | 0 (0.0%) | 0 (0.0%) |
| 5 to 17 Years | 0 (0.0%) | 0 (0.0%) |
| 18 to 34 Years | 0 (0.0%) | 0 (0.0%) |
| 35 to 64 Years | 0 (0.0%) | 0 (0.0%) |
| 65 to 74 Years | 0 (0.0%) | 0 (0.0%) |
| 75 Years and over | 10 (17.5%) | 0 (0.0%) |
Disability Class: Cognitive Difficulty
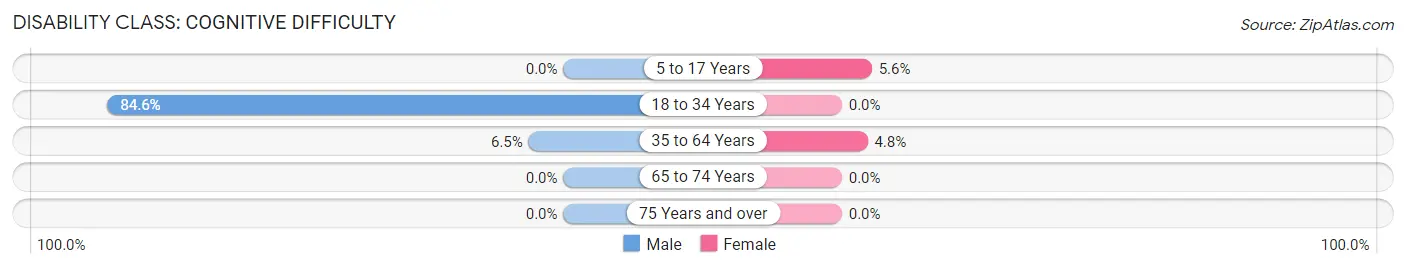
| Age Bracket | Male | Female |
| 5 to 17 Years | 0 (0.0%) | 3 (5.6%) |
| 18 to 34 Years | 11 (84.6%) | 0 (0.0%) |
| 35 to 64 Years | 14 (6.5%) | 7 (4.8%) |
| 65 to 74 Years | 0 (0.0%) | 0 (0.0%) |
| 75 Years and over | 0 (0.0%) | 0 (0.0%) |
Disability Class: Ambulatory Difficulty
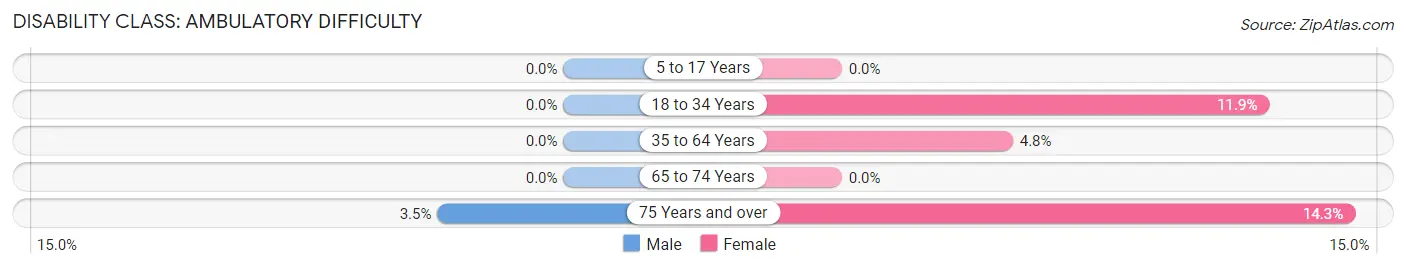
| Age Bracket | Male | Female |
| 5 to 17 Years | 0 (0.0%) | 0 (0.0%) |
| 18 to 34 Years | 0 (0.0%) | 5 (11.9%) |
| 35 to 64 Years | 0 (0.0%) | 7 (4.8%) |
| 65 to 74 Years | 0 (0.0%) | 0 (0.0%) |
| 75 Years and over | 2 (3.5%) | 2 (14.3%) |
Disability Class: Self-Care Difficulty
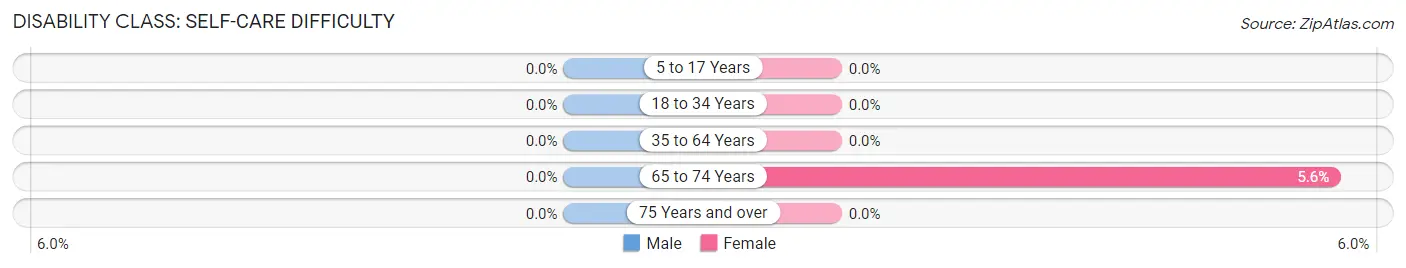
| Age Bracket | Male | Female |
| 5 to 17 Years | 0 (0.0%) | 0 (0.0%) |
| 18 to 34 Years | 0 (0.0%) | 0 (0.0%) |
| 35 to 64 Years | 0 (0.0%) | 0 (0.0%) |
| 65 to 74 Years | 0 (0.0%) | 8 (5.6%) |
| 75 Years and over | 0 (0.0%) | 0 (0.0%) |
Technology Access in Lake Madison
Computing Device Access in Lake Madison
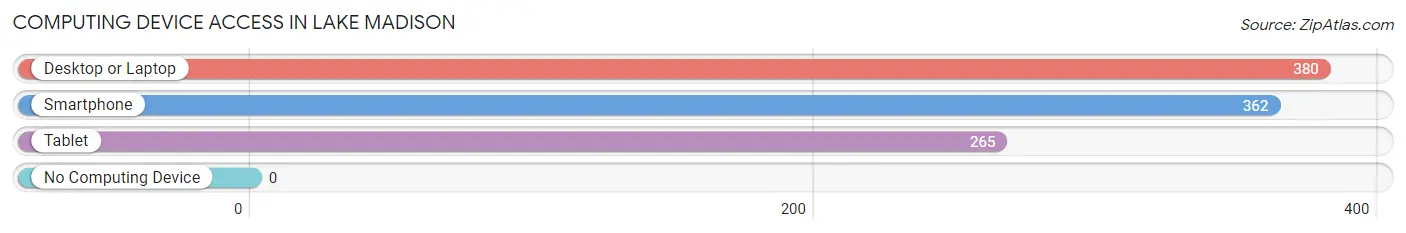
| Device Type | # Households | % Households |
| Desktop or Laptop | 380 | 90.3% |
| Smartphone | 362 | 86.0% |
| Tablet | 265 | 62.9% |
| No Computing Device | 0 | 0.0% |
| Total | 421 | 100.0% |
Internet Access in Lake Madison
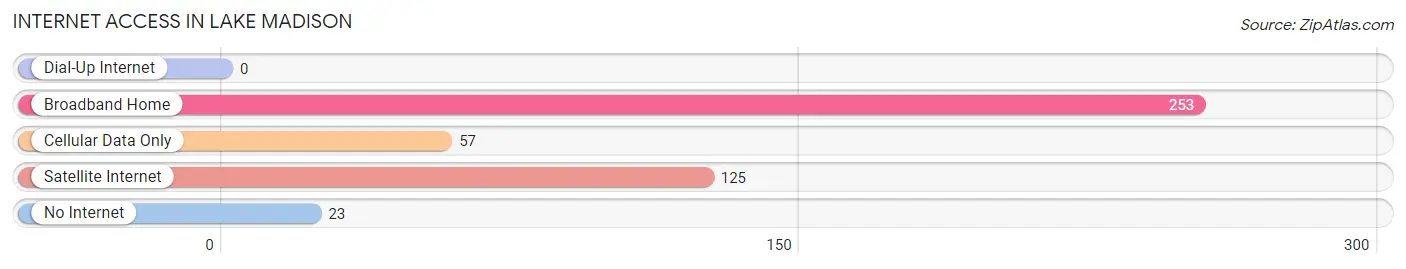
| Internet Type | # Households | % Households |
| Dial-Up Internet | 0 | 0.0% |
| Broadband Home | 253 | 60.1% |
| Cellular Data Only | 57 | 13.5% |
| Satellite Internet | 125 | 29.7% |
| No Internet | 23 | 5.5% |
| Total | 421 | 100.0% |
Lake Madison Summary
Madison, South Dakota is a small city located in Lake County, South Dakota. It is situated on the eastern shore of Lake Madison, a natural lake that is the largest in the state. The city has a population of 2,845 as of the 2010 census.
History
The area around Madison was first settled in the late 1800s by settlers from Norway and Germany. The city was officially incorporated in 1883 and was named after James Madison, the fourth president of the United States. The city was originally a farming community, but it soon became a popular tourist destination due to its proximity to Lake Madison.
In the early 1900s, the city began to grow and develop. The first bank was established in 1906, and the first newspaper was published in 1908. The city also had a number of businesses, including a hotel, a general store, and a lumberyard.
In the 1920s, the city began to experience a period of growth and development. The city was connected to the rest of the state by a railroad line, and the first airport was built in 1929. The city also had a number of businesses, including a movie theater, a bowling alley, and a number of restaurants.
In the 1950s, the city experienced a period of decline. The railroad line was abandoned, and the airport was closed. The city also experienced a decrease in population as people moved away to larger cities.
Geography
Madison is located in the eastern part of South Dakota, on the eastern shore of Lake Madison. The city is situated in a valley surrounded by hills and bluffs. The city is located about 25 miles south of Sioux Falls, the largest city in the state.
The city has a total area of 2.2 square miles, all of which is land. The city has a humid continental climate, with cold winters and hot summers.
Economy
The economy of Madison is largely based on tourism. The city is a popular destination for fishing, boating, and other outdoor activities. The city also has a number of businesses, including restaurants, hotels, and retail stores.
The city also has a number of manufacturing businesses, including a furniture factory and a plastics factory. The city also has a number of agricultural businesses, including a dairy farm and a grain elevator.
Demographics
As of the 2010 census, the population of Madison was 2,845. The racial makeup of the city was 97.3% White, 0.7% African American, 0.3% Native American, 0.2% Asian, 0.1% Pacific Islander, and 1.4% from other races. The median household income was $41,944, and the median family income was $50,944.
Conclusion
Madison, South Dakota is a small city located in Lake County, South Dakota. It is situated on the eastern shore of Lake Madison, a natural lake that is the largest in the state. The city has a population of 2,845 as of the 2010 census. The economy of Madison is largely based on tourism, and the city has a number of businesses, including restaurants, hotels, and retail stores. The racial makeup of the city was 97.3% White, 0.7% African American, 0.3% Native American, 0.2% Asian, 0.1% Pacific Islander, and 1.4% from other races. The median household income was $41,944, and the median family income was $50,944. Madison is a popular destination for fishing, boating, and other outdoor activities, and it is a great place to live and work.
Common Questions
What is the Total Population of Lake Madison?
Total Population of Lake Madison is 850.
What is the Total Male Population of Lake Madison?
Total Male Population of Lake Madison is 449.
What is the Total Female Population of Lake Madison?
Total Female Population of Lake Madison is 401.
What is the Ratio of Males per 100 Females in Lake Madison?
There are 111.97 Males per 100 Females in Lake Madison.
What is the Ratio of Females per 100 Males in Lake Madison?
There are 89.31 Females per 100 Males in Lake Madison.
What is the Median Population Age in Lake Madison?
Median Population Age in Lake Madison is 61.7 Years.
What is the Average Family Size in Lake Madison
Average Family Size in Lake Madison is 2.3 People.
What is the Average Household Size in Lake Madison
Average Household Size in Lake Madison is 2.0 People.
What is Per Capita Income in Lake Madison?
Per Capita income in Lake Madison is $130,431.
What is the Median Family Income in Lake Madison?
Median Family Income in Lake Madison is $120,882.
What is the Median Household income in Lake Madison?
Median Household Income in Lake Madison is $114,250.
What is Income or Wage Gap in Lake Madison?
Income or Wage Gap in Lake Madison is 48.5%.
Women in Lake Madison earn 51.5 cents for every dollar earned by a man.
What is Inequality or Gini Index in Lake Madison?
Inequality or Gini Index in Lake Madison is 0.59.
How Large is the Labor Force in Lake Madison?
There are 454 People in the Labor Forcein in Lake Madison.
What is the Percentage of People in the Labor Force in Lake Madison?
58.0% of People are in the Labor Force in Lake Madison.
What is the Unemployment Rate in Lake Madison?
Unemployment Rate in Lake Madison is 4.4%.