Yankton, SD
Yankton Map
Yankton Overview
15,421
TOTAL POPULATION
7,925
MALE POPULATION
7,496
FEMALE POPULATION
105.72
MALES / 100 FEMALES
94.59
FEMALES / 100 MALES
39.9
MEDIAN AGE
2.9
AVG FAMILY SIZE
2.1
AVG HOUSEHOLD SIZE
$36,680
PER CAPITA INCOME
$87,760
AVG FAMILY INCOME
$60,180
AVG HOUSEHOLD INCOME
21.3%
WAGE / INCOME GAP [ % ]
78.7¢/ $1
WAGE / INCOME GAP [ $ ]
0.44
INEQUALITY / GINI INDEX
7,859
LABOR FORCE [ PEOPLE ]
62.3%
PERCENT IN LABOR FORCE
1.1%
UNEMPLOYMENT RATE
Yankton Zip Codes
Yankton Area Codes
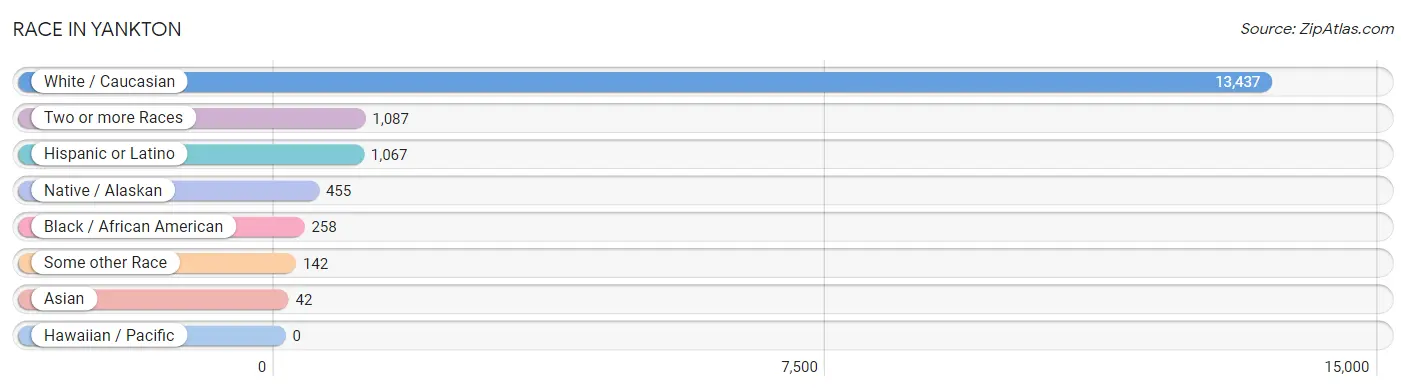
Race in Yankton
The most populous races in Yankton are White / Caucasian (13,437 | 87.1%), Two or more Races (1,087 | 7.0%), and Hispanic or Latino (1,067 | 6.9%).
| Race | # Population | % Population |
| Asian | 42 | 0.3% |
| Black / African American | 258 | 1.7% |
| Hawaiian / Pacific | 0 | 0.0% |
| Hispanic or Latino | 1,067 | 6.9% |
| Native / Alaskan | 455 | 2.9% |
| White / Caucasian | 13,437 | 87.1% |
| Two or more Races | 1,087 | 7.0% |
| Some other Race | 142 | 0.9% |
| Total | 15,421 | 100.0% |
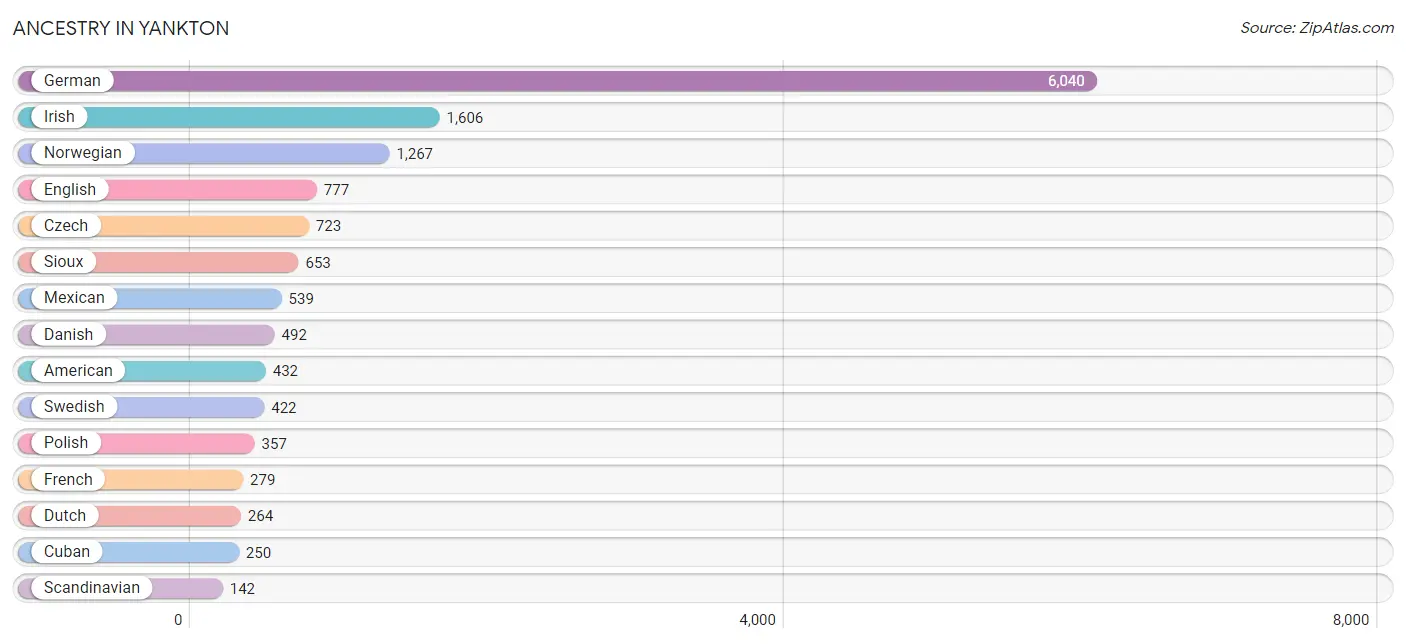
Ancestry in Yankton
The most populous ancestries reported in Yankton are German (6,040 | 39.2%), Irish (1,606 | 10.4%), Norwegian (1,267 | 8.2%), English (777 | 5.0%), and Czech (723 | 4.7%), together accounting for 67.5% of all Yankton residents.
| Ancestry | # Population | % Population |
| American | 432 | 2.8% |
| Austrian | 21 | 0.1% |
| Belgian | 10 | 0.1% |
| Bhutanese | 32 | 0.2% |
| British | 45 | 0.3% |
| Burmese | 9 | 0.1% |
| Canadian | 5 | 0.0% |
| Central American | 9 | 0.1% |
| Cheyenne | 53 | 0.3% |
| Chilean | 62 | 0.4% |
| Choctaw | 16 | 0.1% |
| Cuban | 250 | 1.6% |
| Czech | 723 | 4.7% |
| Czechoslovakian | 60 | 0.4% |
| Danish | 492 | 3.2% |
| Dutch | 264 | 1.7% |
| English | 777 | 5.0% |
| European | 96 | 0.6% |
| Finnish | 40 | 0.3% |
| French | 279 | 1.8% |
| French Canadian | 31 | 0.2% |
| German | 6,040 | 39.2% |
| Greek | 16 | 0.1% |
| Haitian | 98 | 0.6% |
| Honduran | 9 | 0.1% |
| Hungarian | 19 | 0.1% |
| Indian (Asian) | 54 | 0.4% |
| Irish | 1,606 | 10.4% |
| Italian | 126 | 0.8% |
| Jamaican | 2 | 0.0% |
| Korean | 10 | 0.1% |
| Mexican | 539 | 3.5% |
| Norwegian | 1,267 | 8.2% |
| Polish | 357 | 2.3% |
| Puerto Rican | 89 | 0.6% |
| Russian | 81 | 0.5% |
| Scandinavian | 142 | 0.9% |
| Scottish | 100 | 0.6% |
| Sioux | 653 | 4.2% |
| Slovak | 37 | 0.2% |
| South American | 62 | 0.4% |
| Spanish | 50 | 0.3% |
| Sri Lankan | 4 | 0.0% |
| Swedish | 422 | 2.7% |
| Swiss | 44 | 0.3% |
| Ukrainian | 8 | 0.1% | View All 46 Rows |
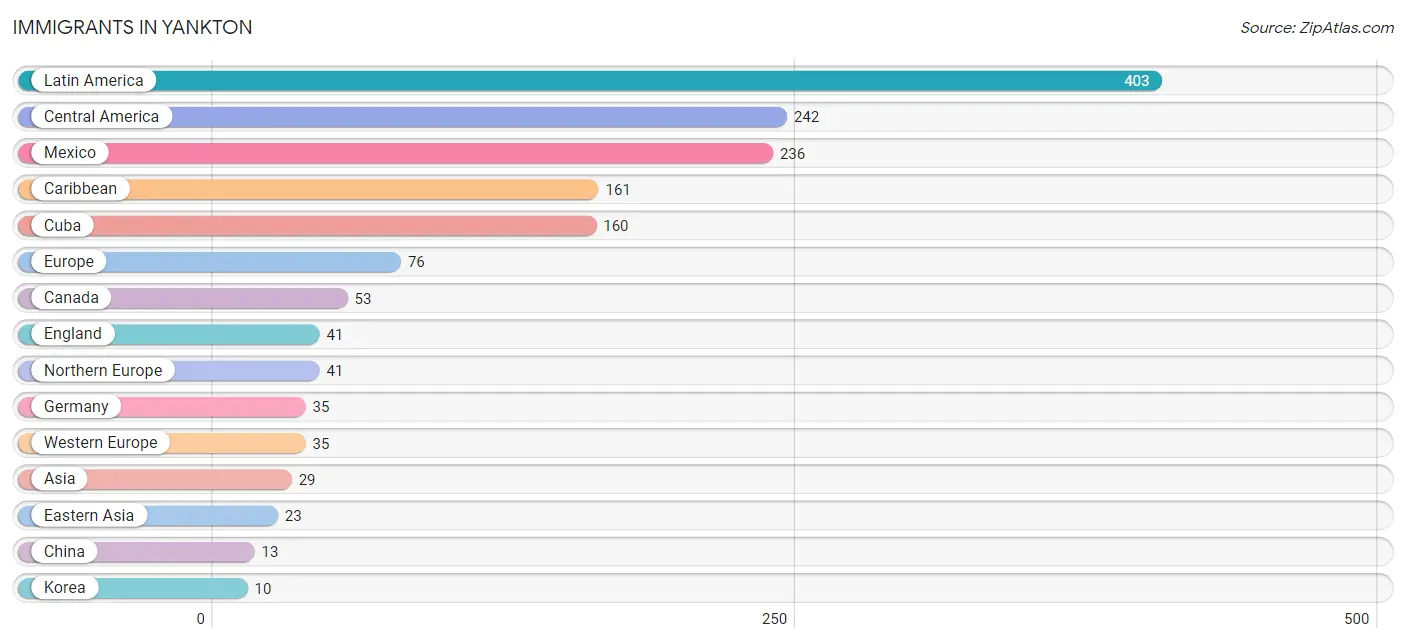
Immigrants in Yankton
The most numerous immigrant groups reported in Yankton came from Latin America (403 | 2.6%), Central America (242 | 1.6%), Mexico (236 | 1.5%), Caribbean (161 | 1.0%), and Cuba (160 | 1.0%), together accounting for 7.8% of all Yankton residents.
| Immigration Origin | # Population | % Population |
| Asia | 29 | 0.2% |
| Canada | 53 | 0.3% |
| Caribbean | 161 | 1.0% |
| Central America | 242 | 1.6% |
| China | 13 | 0.1% |
| Cuba | 160 | 1.0% |
| Eastern Asia | 23 | 0.2% |
| England | 41 | 0.3% |
| Europe | 76 | 0.5% |
| Germany | 35 | 0.2% |
| Honduras | 6 | 0.0% |
| Jamaica | 1 | 0.0% |
| Korea | 10 | 0.1% |
| Latin America | 403 | 2.6% |
| Mexico | 236 | 1.5% |
| Northern Europe | 41 | 0.3% |
| South Eastern Asia | 6 | 0.0% |
| Vietnam | 6 | 0.0% |
| Western Europe | 35 | 0.2% | View All 19 Rows |
Sex and Age in Yankton
Sex and Age in Yankton
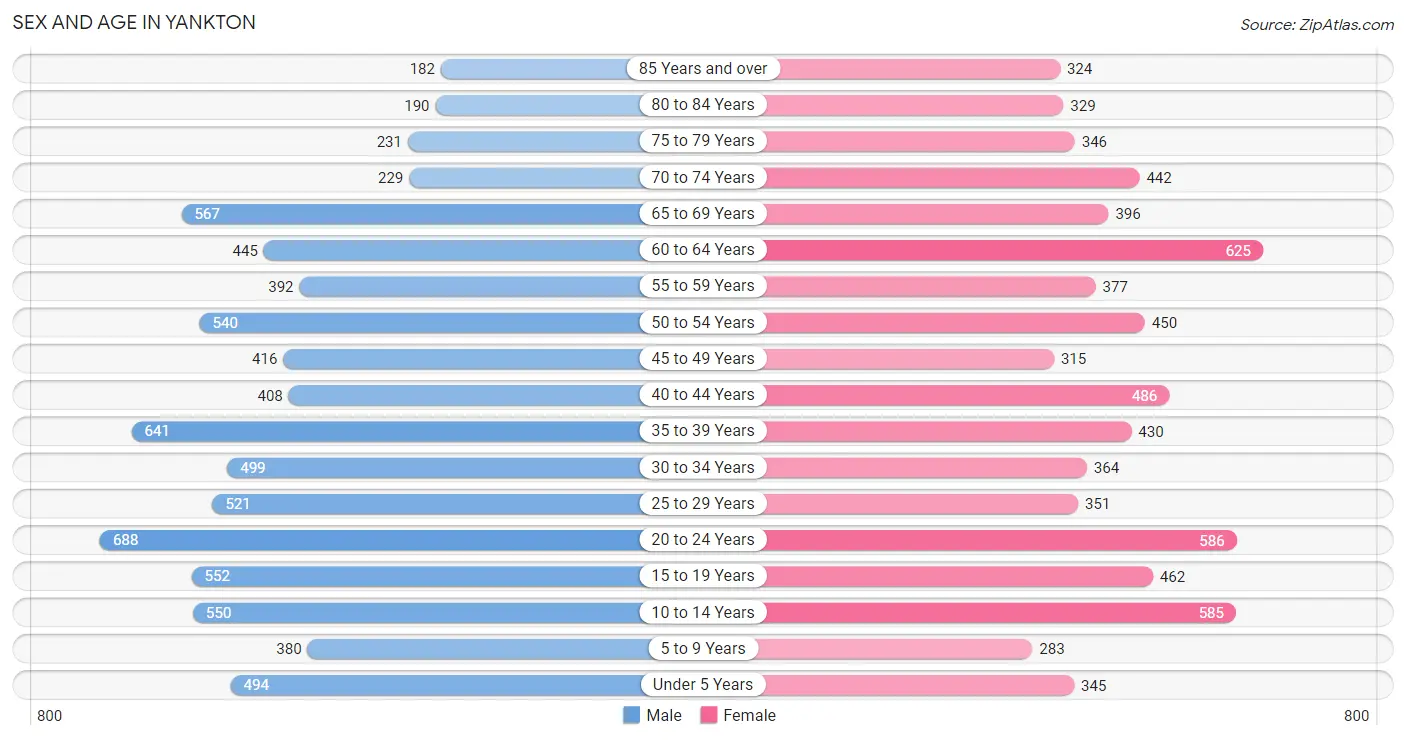
The most populous age groups in Yankton are 20 to 24 Years (688 | 8.7%) for men and 60 to 64 Years (625 | 8.3%) for women.
| Age Bracket | Male | Female |
| Under 5 Years | 494 (6.2%) | 345 (4.6%) |
| 5 to 9 Years | 380 (4.8%) | 283 (3.8%) |
| 10 to 14 Years | 550 (6.9%) | 585 (7.8%) |
| 15 to 19 Years | 552 (7.0%) | 462 (6.2%) |
| 20 to 24 Years | 688 (8.7%) | 586 (7.8%) |
| 25 to 29 Years | 521 (6.6%) | 351 (4.7%) |
| 30 to 34 Years | 499 (6.3%) | 364 (4.9%) |
| 35 to 39 Years | 641 (8.1%) | 430 (5.7%) |
| 40 to 44 Years | 408 (5.1%) | 486 (6.5%) |
| 45 to 49 Years | 416 (5.2%) | 315 (4.2%) |
| 50 to 54 Years | 540 (6.8%) | 450 (6.0%) |
| 55 to 59 Years | 392 (5.0%) | 377 (5.0%) |
| 60 to 64 Years | 445 (5.6%) | 625 (8.3%) |
| 65 to 69 Years | 567 (7.1%) | 396 (5.3%) |
| 70 to 74 Years | 229 (2.9%) | 442 (5.9%) |
| 75 to 79 Years | 231 (2.9%) | 346 (4.6%) |
| 80 to 84 Years | 190 (2.4%) | 329 (4.4%) |
| 85 Years and over | 182 (2.3%) | 324 (4.3%) |
| Total | 7,925 (100.0%) | 7,496 (100.0%) |
Families and Households in Yankton
Median Family Size in Yankton
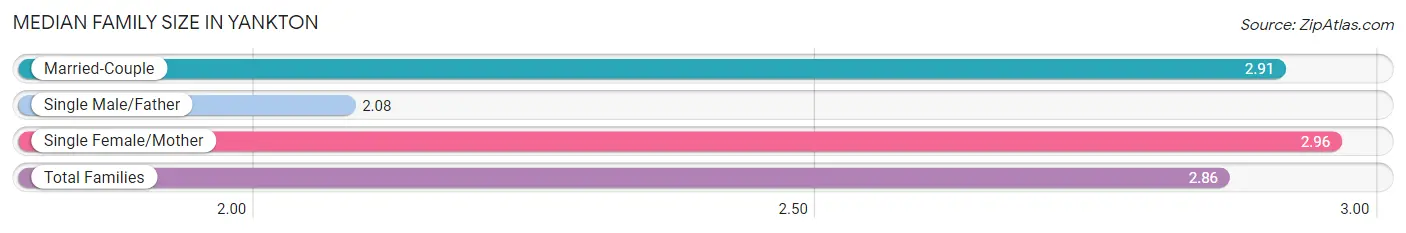
The median family size in Yankton is 2.86 persons per family, with single female/mother families (567 | 16.2%) accounting for the largest median family size of 2.96 persons per family. On the other hand, single male/father families (238 | 6.8%) represent the smallest median family size with 2.08 persons per family.
| Family Type | # Families | Family Size |
| Married-Couple | 2,705 (77.1%) | 2.91 |
| Single Male/Father | 238 (6.8%) | 2.08 |
| Single Female/Mother | 567 (16.2%) | 2.96 |
| Total Families | 3,510 (100.0%) | 2.86 |
Median Household Size in Yankton
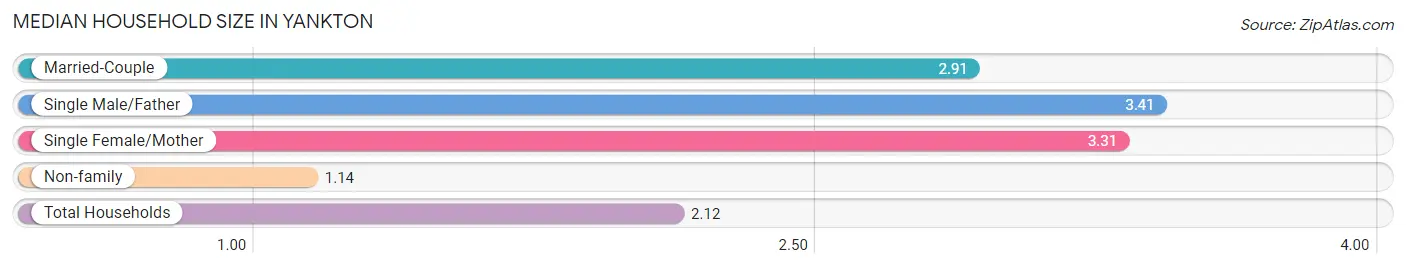
The median household size in Yankton is 2.12 persons per household, with single male/father households (238 | 3.6%) accounting for the largest median household size of 3.41 persons per household. non-family households (3,158 | 47.4%) represent the smallest median household size with 1.14 persons per household.
| Household Type | # Households | Household Size |
| Married-Couple | 2,705 (40.6%) | 2.91 |
| Single Male/Father | 238 (3.6%) | 3.41 |
| Single Female/Mother | 567 (8.5%) | 3.31 |
| Non-family | 3,158 (47.4%) | 1.14 |
| Total Households | 6,668 (100.0%) | 2.12 |
Household Size by Marriage Status in Yankton
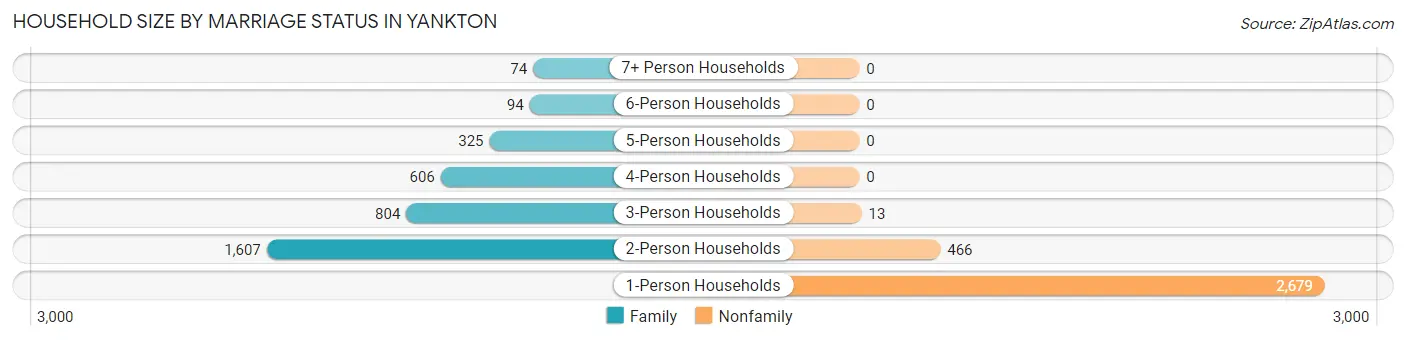
Out of a total of 6,668 households in Yankton, 3,510 (52.6%) are family households, while 3,158 (47.4%) are nonfamily households. The most numerous type of family households are 2-person households, comprising 1,607, and the most common type of nonfamily households are 1-person households, comprising 2,679.
| Household Size | Family Households | Nonfamily Households |
| 1-Person Households | - | 2,679 (40.2%) |
| 2-Person Households | 1,607 (24.1%) | 466 (7.0%) |
| 3-Person Households | 804 (12.1%) | 13 (0.2%) |
| 4-Person Households | 606 (9.1%) | 0 (0.0%) |
| 5-Person Households | 325 (4.9%) | 0 (0.0%) |
| 6-Person Households | 94 (1.4%) | 0 (0.0%) |
| 7+ Person Households | 74 (1.1%) | 0 (0.0%) |
| Total | 3,510 (52.6%) | 3,158 (47.4%) |
Female Fertility in Yankton
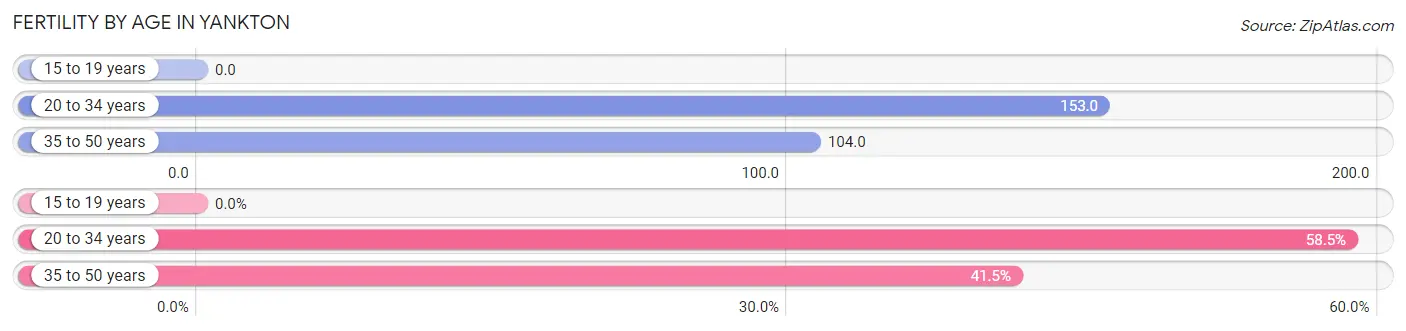
Fertility by Age in Yankton
Average fertility rate in Yankton is 109.0 births per 1,000 women. Women in the age bracket of 20 to 34 years have the highest fertility rate with 153.0 births per 1,000 women. Women in the age bracket of 20 to 34 years acount for 58.5% of all women with births.
| Age Bracket | Women with Births | Births / 1,000 Women |
| 15 to 19 years | 0 (0.0%) | 0.0 |
| 20 to 34 years | 199 (58.5%) | 153.0 |
| 35 to 50 years | 141 (41.5%) | 104.0 |
| Total | 340 (100.0%) | 109.0 |
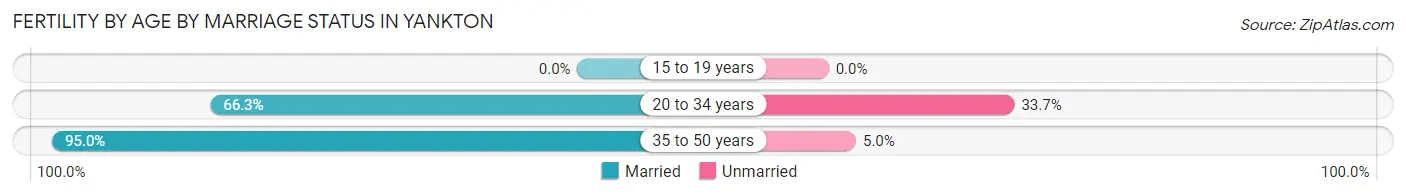
Fertility by Age by Marriage Status in Yankton
78.2% of women with births (340) in Yankton are married. The highest percentage of unmarried women with births falls into 20 to 34 years age bracket with 33.7% of them unmarried at the time of birth, while the lowest percentage of unmarried women with births belong to 35 to 50 years age bracket with 5.0% of them unmarried.
| Age Bracket | Married | Unmarried |
| 15 to 19 years | 0 (0.0%) | 0 (0.0%) |
| 20 to 34 years | 132 (66.3%) | 67 (33.7%) |
| 35 to 50 years | 134 (95.0%) | 7 (5.0%) |
| Total | 266 (78.2%) | 74 (21.8%) |
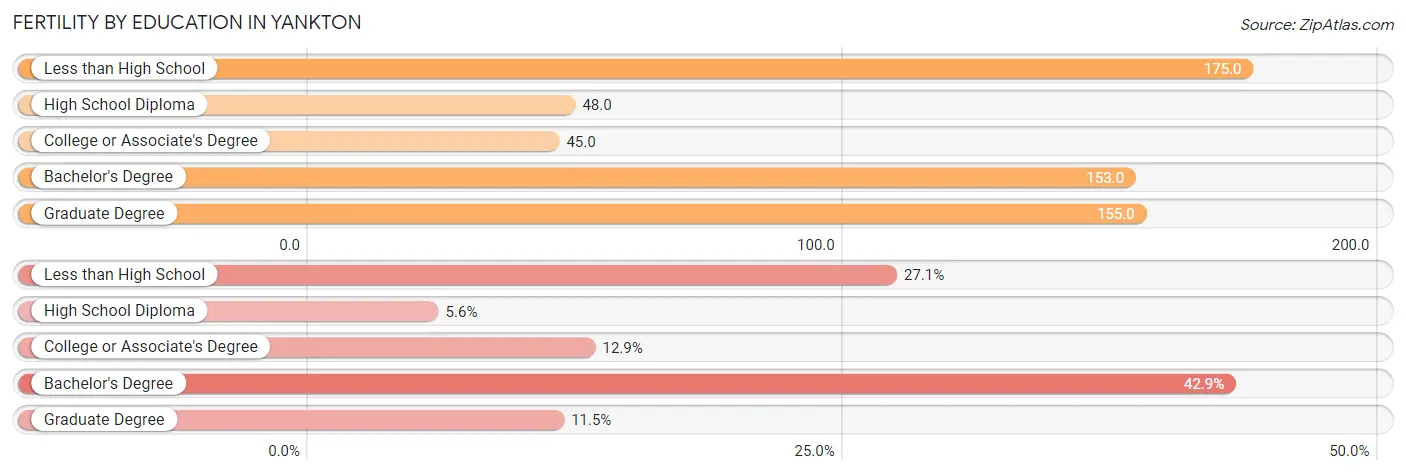
Fertility by Education in Yankton
Average fertility rate in Yankton is 109.0 births per 1,000 women. Women with the education attainment of less than high school have the highest fertility rate of 175.0 births per 1,000 women, while women with the education attainment of college or associate's degree have the lowest fertility at 45.0 births per 1,000 women. Women with the education attainment of bachelor's degree represent 42.9% of all women with births.
| Educational Attainment | Women with Births | Births / 1,000 Women |
| Less than High School | 92 (27.1%) | 175.0 |
| High School Diploma | 19 (5.6%) | 48.0 |
| College or Associate's Degree | 44 (12.9%) | 45.0 |
| Bachelor's Degree | 146 (42.9%) | 153.0 |
| Graduate Degree | 39 (11.5%) | 155.0 |
| Total | 340 (100.0%) | 109.0 |
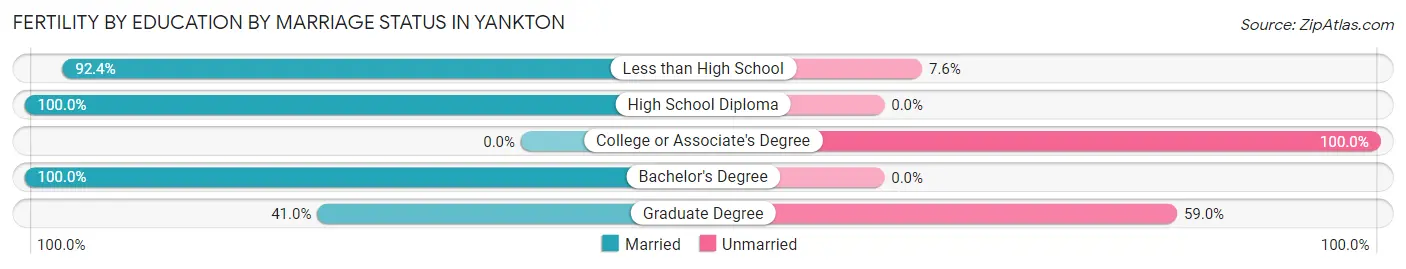
Fertility by Education by Marriage Status in Yankton
21.8% of women with births in Yankton are unmarried. Women with the educational attainment of high school diploma are most likely to be married with 100.0% of them married at childbirth, while women with the educational attainment of college or associate's degree are least likely to be married with 100.0% of them unmarried at childbirth.
| Educational Attainment | Married | Unmarried |
| Less than High School | 85 (92.4%) | 7 (7.6%) |
| High School Diploma | 19 (100.0%) | 0 (0.0%) |
| College or Associate's Degree | 0 (0.0%) | 44 (100.0%) |
| Bachelor's Degree | 146 (100.0%) | 0 (0.0%) |
| Graduate Degree | 16 (41.0%) | 23 (59.0%) |
| Total | 266 (78.2%) | 74 (21.8%) |
Income in Yankton
Income Overview in Yankton
Per Capita Income in Yankton is $36,680, while median incomes of families and households are $87,760 and $60,180 respectively.
| Characteristic | Number | Measure |
| Per Capita Income | 15,421 | $36,680 |
| Median Family Income | 3,510 | $87,760 |
| Mean Family Income | 3,510 | $113,414 |
| Median Household Income | 6,668 | $60,180 |
| Mean Household Income | 6,668 | $83,373 |
| Income Deficit | 3,510 | $0 |
| Wage / Income Gap (%) | 15,421 | 21.25% |
| Wage / Income Gap ($) | 15,421 | 78.75¢ per $1 |
| Gini / Inequality Index | 15,421 | 0.44 |
Earnings by Sex in Yankton
Average Earnings in Yankton are $40,424, $45,412 for men and $35,760 for women, a difference of 21.2%.
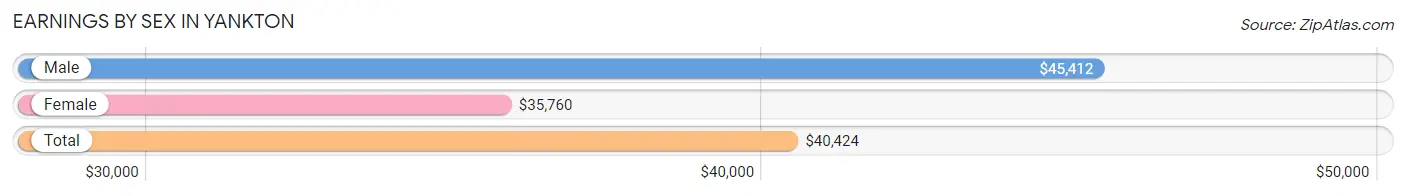
| Sex | Number | Average Earnings |
| Male | 5,017 (56.3%) | $45,412 |
| Female | 3,894 (43.7%) | $35,760 |
| Total | 8,911 (100.0%) | $40,424 |
Earnings by Sex by Income Bracket in Yankton
The most common earnings brackets in Yankton are $55,000 to $64,999 for men (635 | 12.7%) and $40,000 to $44,999 for women (494 | 12.7%).
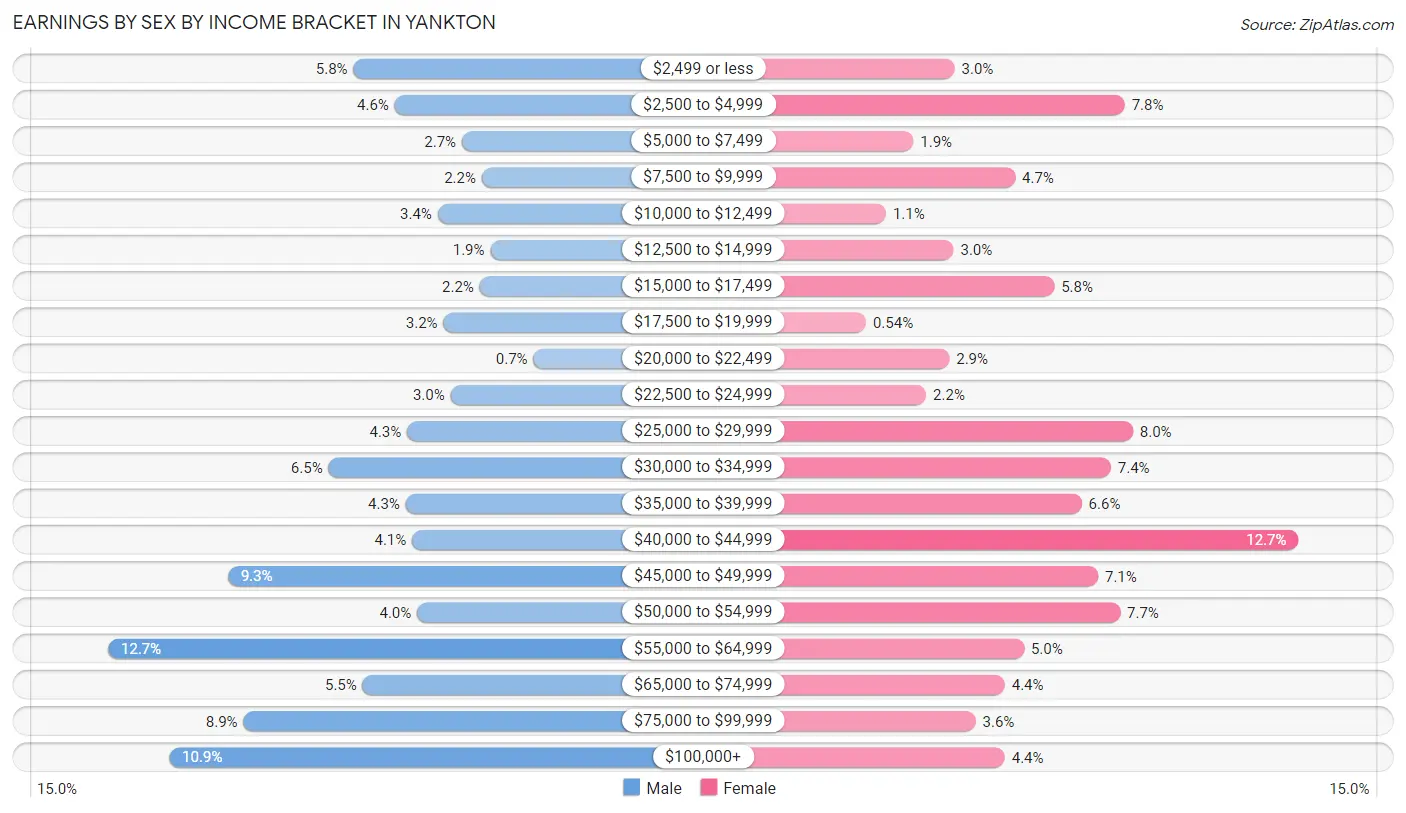
| Income | Male | Female |
| $2,499 or less | 289 (5.8%) | 118 (3.0%) |
| $2,500 to $4,999 | 231 (4.6%) | 304 (7.8%) |
| $5,000 to $7,499 | 136 (2.7%) | 73 (1.9%) |
| $7,500 to $9,999 | 108 (2.1%) | 184 (4.7%) |
| $10,000 to $12,499 | 170 (3.4%) | 43 (1.1%) |
| $12,500 to $14,999 | 96 (1.9%) | 117 (3.0%) |
| $15,000 to $17,499 | 111 (2.2%) | 227 (5.8%) |
| $17,500 to $19,999 | 162 (3.2%) | 21 (0.5%) |
| $20,000 to $22,499 | 35 (0.7%) | 112 (2.9%) |
| $22,500 to $24,999 | 152 (3.0%) | 87 (2.2%) |
| $25,000 to $29,999 | 213 (4.3%) | 313 (8.0%) |
| $30,000 to $34,999 | 324 (6.5%) | 289 (7.4%) |
| $35,000 to $39,999 | 215 (4.3%) | 257 (6.6%) |
| $40,000 to $44,999 | 206 (4.1%) | 494 (12.7%) |
| $45,000 to $49,999 | 466 (9.3%) | 275 (7.1%) |
| $50,000 to $54,999 | 199 (4.0%) | 299 (7.7%) |
| $55,000 to $64,999 | 635 (12.7%) | 194 (5.0%) |
| $65,000 to $74,999 | 276 (5.5%) | 173 (4.4%) |
| $75,000 to $99,999 | 444 (8.8%) | 141 (3.6%) |
| $100,000+ | 549 (10.9%) | 173 (4.4%) |
| Total | 5,017 (100.0%) | 3,894 (100.0%) |
Earnings by Sex by Educational Attainment in Yankton
Average earnings in Yankton are $47,477 for men and $40,866 for women, a difference of 13.9%. Men with an educational attainment of graduate degree enjoy the highest average annual earnings of $78,983, while those with high school diploma education earn the least with $32,205. Women with an educational attainment of graduate degree earn the most with the average annual earnings of $56,630, while those with high school diploma education have the smallest earnings of $29,207.
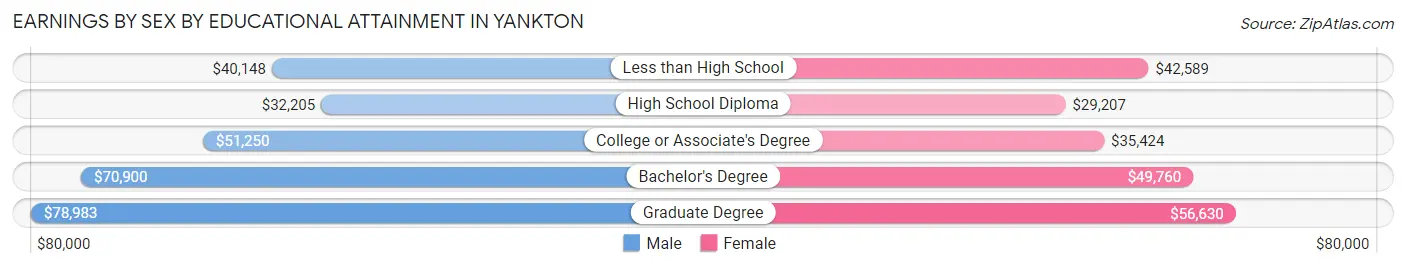
| Educational Attainment | Male Income | Female Income |
| Less than High School | $40,148 | $42,589 |
| High School Diploma | $32,205 | $29,207 |
| College or Associate's Degree | $51,250 | $35,424 |
| Bachelor's Degree | $70,900 | $49,760 |
| Graduate Degree | $78,983 | $56,630 |
| Total | $47,477 | $40,866 |
Family Income in Yankton
Family Income Brackets in Yankton
According to the Yankton family income data, there are 776 families falling into the $100,000 to $149,999 income range, which is the most common income bracket and makes up 22.1% of all families.
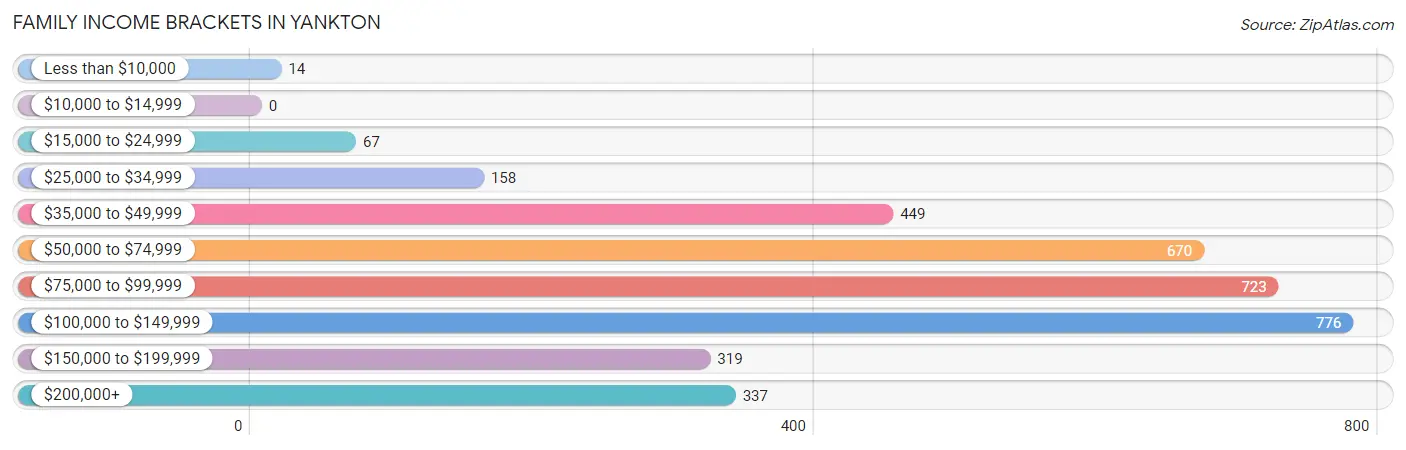
| Income Bracket | # Families | % Families |
| Less than $10,000 | 14 | 0.4% |
| $10,000 to $14,999 | 0 | 0.0% |
| $15,000 to $24,999 | 67 | 1.9% |
| $25,000 to $34,999 | 158 | 4.5% |
| $35,000 to $49,999 | 449 | 12.8% |
| $50,000 to $74,999 | 670 | 19.1% |
| $75,000 to $99,999 | 723 | 20.6% |
| $100,000 to $149,999 | 776 | 22.1% |
| $150,000 to $199,999 | 319 | 9.1% |
| $200,000+ | 337 | 9.6% |
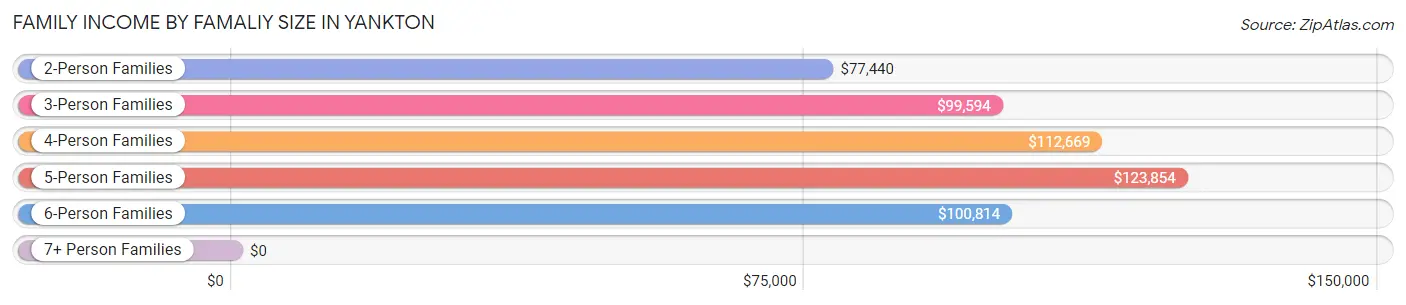
Family Income by Famaliy Size in Yankton
5-person families (187 | 5.3%) account for the highest median family income in Yankton with $123,854 per family, while 2-person families (1,795 | 51.1%) have the highest median income of $38,720 per family member.
| Income Bracket | # Families | Median Income |
| 2-Person Families | 1,795 (51.1%) | $77,440 |
| 3-Person Families | 775 (22.1%) | $99,594 |
| 4-Person Families | 585 (16.7%) | $112,669 |
| 5-Person Families | 187 (5.3%) | $123,854 |
| 6-Person Families | 94 (2.7%) | $100,814 |
| 7+ Person Families | 74 (2.1%) | $0 |
| Total | 3,510 (100.0%) | $87,760 |
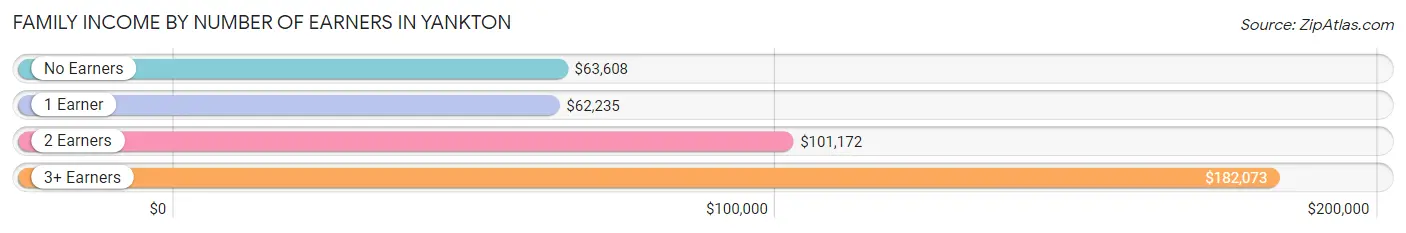
Family Income by Number of Earners in Yankton
The median family income in Yankton is $87,760, with families comprising 3+ earners (462) having the highest median family income of $182,073, while families with 1 earner (1,131) have the lowest median family income of $62,235, accounting for 13.2% and 32.2% of families, respectively.
| Number of Earners | # Families | Median Income |
| No Earners | 467 (13.3%) | $63,608 |
| 1 Earner | 1,131 (32.2%) | $62,235 |
| 2 Earners | 1,450 (41.3%) | $101,172 |
| 3+ Earners | 462 (13.2%) | $182,073 |
| Total | 3,510 (100.0%) | $87,760 |
Household Income in Yankton
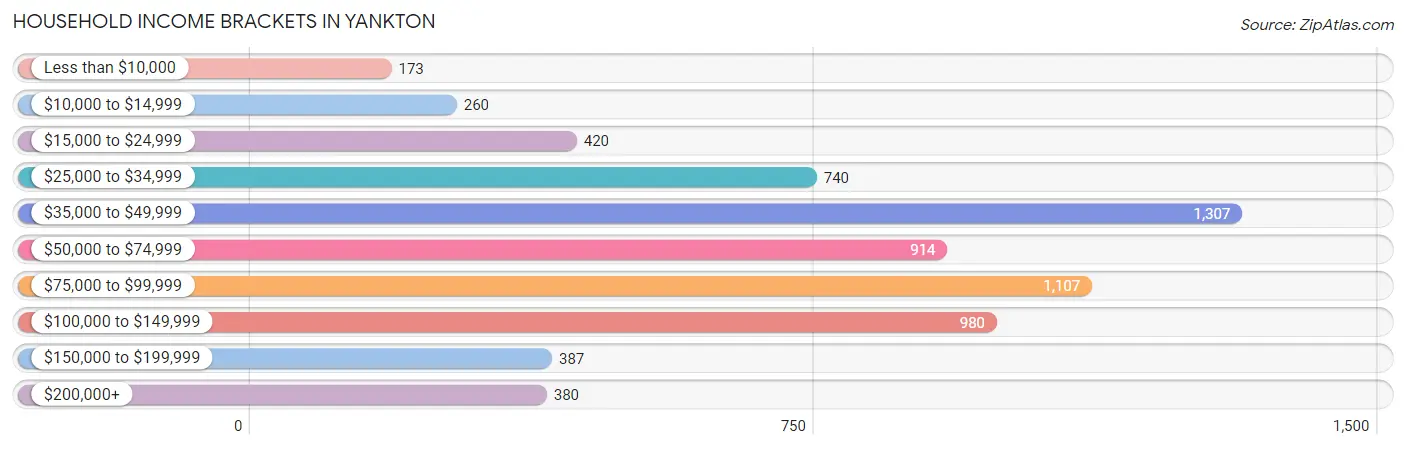
Household Income Brackets in Yankton
With 1,307 households falling in the category, the $35,000 to $49,999 income range is the most frequent in Yankton, accounting for 19.6% of all households. In contrast, only 173 households (2.6%) fall into the less than $10,000 income bracket, making it the least populous group.
| Income Bracket | # Households | % Households |
| Less than $10,000 | 173 | 2.6% |
| $10,000 to $14,999 | 260 | 3.9% |
| $15,000 to $24,999 | 420 | 6.3% |
| $25,000 to $34,999 | 740 | 11.1% |
| $35,000 to $49,999 | 1,307 | 19.6% |
| $50,000 to $74,999 | 914 | 13.7% |
| $75,000 to $99,999 | 1,107 | 16.6% |
| $100,000 to $149,999 | 980 | 14.7% |
| $150,000 to $199,999 | 387 | 5.8% |
| $200,000+ | 380 | 5.7% |
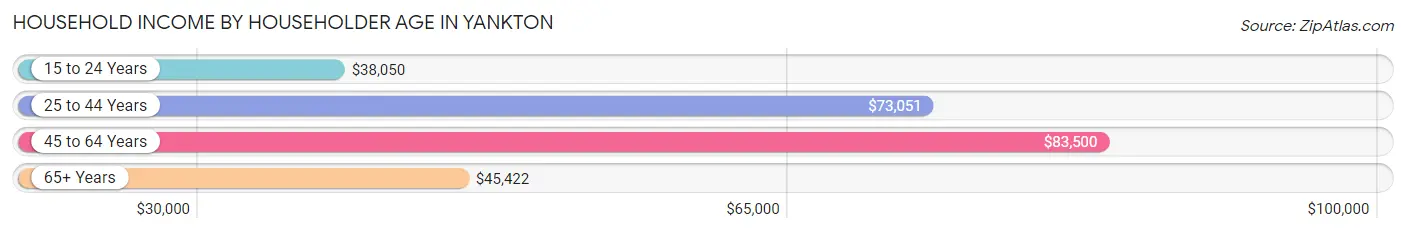
Household Income by Householder Age in Yankton
The median household income in Yankton is $60,180, with the highest median household income of $83,500 found in the 45 to 64 years age bracket for the primary householder. A total of 1,976 households (29.6%) fall into this category. Meanwhile, the 15 to 24 years age bracket for the primary householder has the lowest median household income of $38,050, with 745 households (11.2%) in this group.
| Income Bracket | # Households | Median Income |
| 15 to 24 Years | 745 (11.2%) | $38,050 |
| 25 to 44 Years | 1,935 (29.0%) | $73,051 |
| 45 to 64 Years | 1,976 (29.6%) | $83,500 |
| 65+ Years | 2,012 (30.2%) | $45,422 |
| Total | 6,668 (100.0%) | $60,180 |
Poverty in Yankton
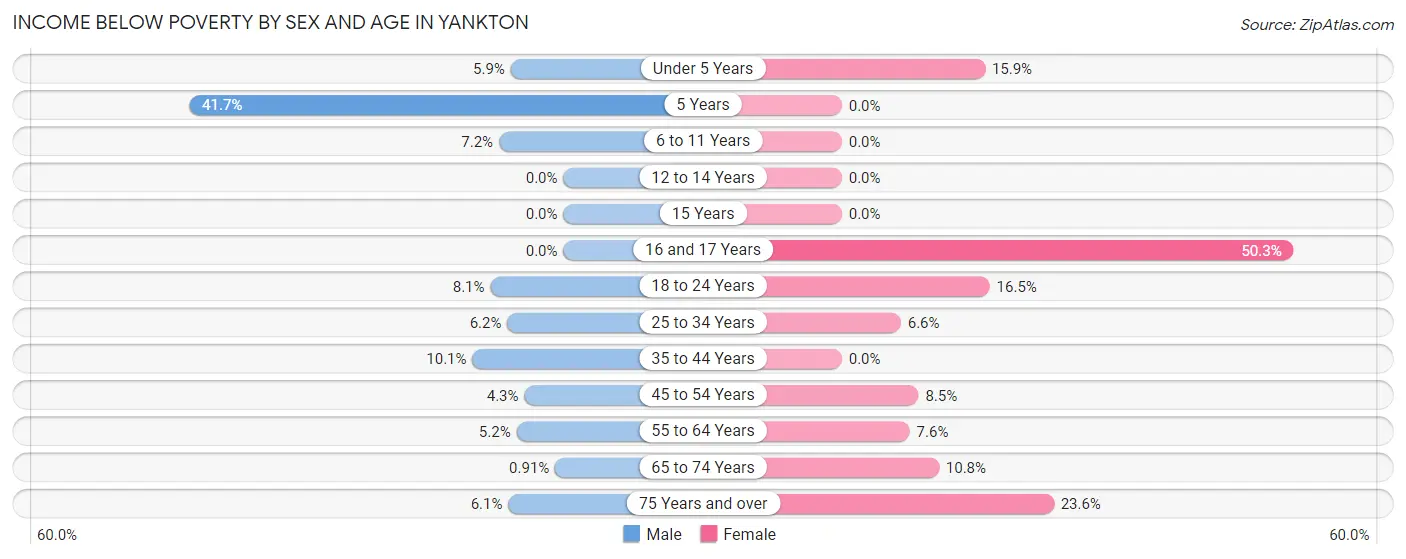
Income Below Poverty by Sex and Age in Yankton
With 5.7% poverty level for males and 10.3% for females among the residents of Yankton, 5 year old males and 16 and 17 year old females are the most vulnerable to poverty, with 15 males (41.7%) and 83 females (50.3%) in their respective age groups living below the poverty level.
| Age Bracket | Male | Female |
| Under 5 Years | 29 (5.9%) | 55 (15.9%) |
| 5 Years | 15 (41.7%) | 0 (0.0%) |
| 6 to 11 Years | 42 (7.2%) | 0 (0.0%) |
| 12 to 14 Years | 0 (0.0%) | 0 (0.0%) |
| 15 Years | 0 (0.0%) | 0 (0.0%) |
| 16 and 17 Years | 0 (0.0%) | 83 (50.3%) |
| 18 to 24 Years | 63 (8.1%) | 126 (16.5%) |
| 25 to 34 Years | 59 (6.2%) | 47 (6.6%) |
| 35 to 44 Years | 84 (10.1%) | 0 (0.0%) |
| 45 to 54 Years | 36 (4.3%) | 64 (8.5%) |
| 55 to 64 Years | 40 (5.2%) | 75 (7.6%) |
| 65 to 74 Years | 7 (0.9%) | 89 (10.8%) |
| 75 Years and over | 34 (6.1%) | 206 (23.6%) |
| Total | 409 (5.7%) | 745 (10.3%) |
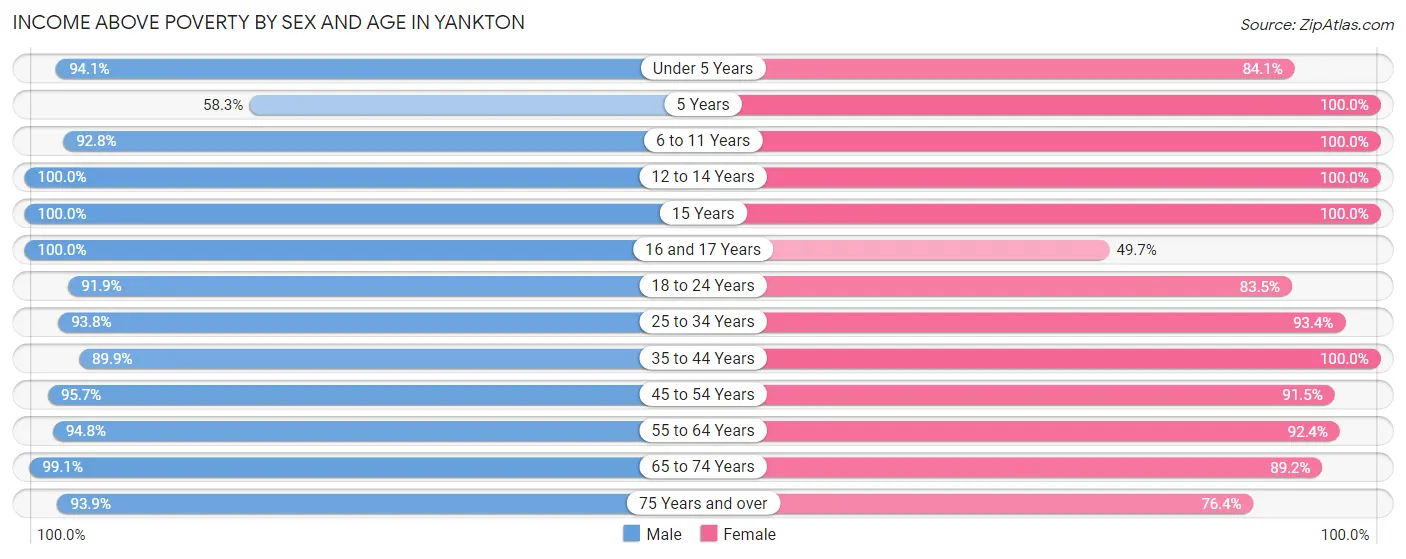
Income Above Poverty by Sex and Age in Yankton
According to the poverty statistics in Yankton, males aged 12 to 14 years and females aged 5 years are the age groups that are most secure financially, with 100.0% of males and 100.0% of females in these age groups living above the poverty line.
| Age Bracket | Male | Female |
| Under 5 Years | 465 (94.1%) | 290 (84.1%) |
| 5 Years | 21 (58.3%) | 63 (100.0%) |
| 6 to 11 Years | 544 (92.8%) | 468 (100.0%) |
| 12 to 14 Years | 286 (100.0%) | 263 (100.0%) |
| 15 Years | 88 (100.0%) | 82 (100.0%) |
| 16 and 17 Years | 239 (100.0%) | 82 (49.7%) |
| 18 to 24 Years | 712 (91.9%) | 639 (83.5%) |
| 25 to 34 Years | 886 (93.8%) | 668 (93.4%) |
| 35 to 44 Years | 745 (89.9%) | 904 (100.0%) |
| 45 to 54 Years | 794 (95.7%) | 685 (91.5%) |
| 55 to 64 Years | 726 (94.8%) | 917 (92.4%) |
| 65 to 74 Years | 760 (99.1%) | 734 (89.2%) |
| 75 Years and over | 521 (93.9%) | 667 (76.4%) |
| Total | 6,787 (94.3%) | 6,462 (89.7%) |
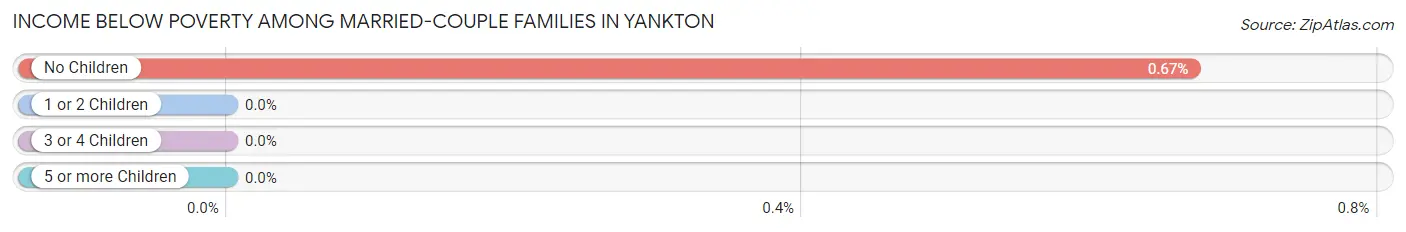
Income Below Poverty Among Married-Couple Families in Yankton
The poverty statistics for married-couple families in Yankton show that 0.4% or 11 of the total 2,705 families live below the poverty line. Families with no children have the highest poverty rate of 0.7%, comprising of 11 families. On the other hand, families with 1 or 2 children have the lowest poverty rate of 0.0%, which includes 0 families.
| Children | Above Poverty | Below Poverty |
| No Children | 1,637 (99.3%) | 11 (0.7%) |
| 1 or 2 Children | 755 (100.0%) | 0 (0.0%) |
| 3 or 4 Children | 287 (100.0%) | 0 (0.0%) |
| 5 or more Children | 15 (100.0%) | 0 (0.0%) |
| Total | 2,694 (99.6%) | 11 (0.4%) |
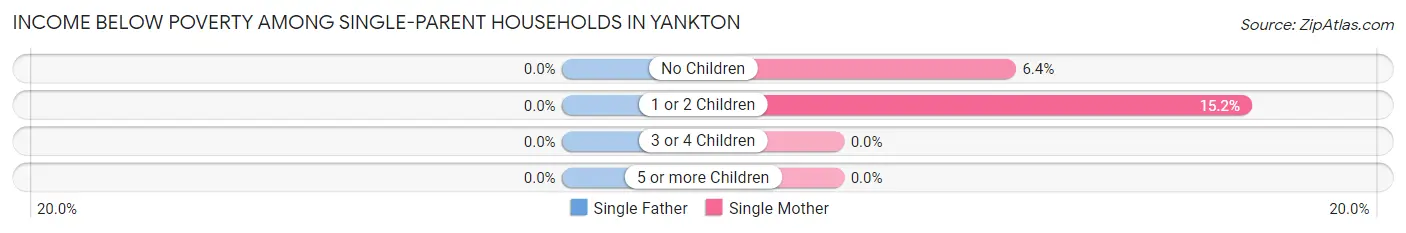
Income Below Poverty Among Single-Parent Households in Yankton
| Children | Single Father | Single Mother |
| No Children | 0 (0.0%) | 11 (6.4%) |
| 1 or 2 Children | 0 (0.0%) | 50 (15.2%) |
| 3 or 4 Children | 0 (0.0%) | 0 (0.0%) |
| 5 or more Children | 0 (0.0%) | 0 (0.0%) |
| Total | 0 (0.0%) | 61 (10.8%) |
Income Below Poverty Among Married-Couple vs Single-Parent Households in Yankton
The poverty data for Yankton shows that 11 of the married-couple family households (0.4%) and 61 of the single-parent households (7.6%) are living below the poverty level. Within the married-couple family households, those with no children have the highest poverty rate, with 11 households (0.7%) falling below the poverty line. Among the single-parent households, those with 1 or 2 children have the highest poverty rate, with 50 household (9.4%) living below poverty.
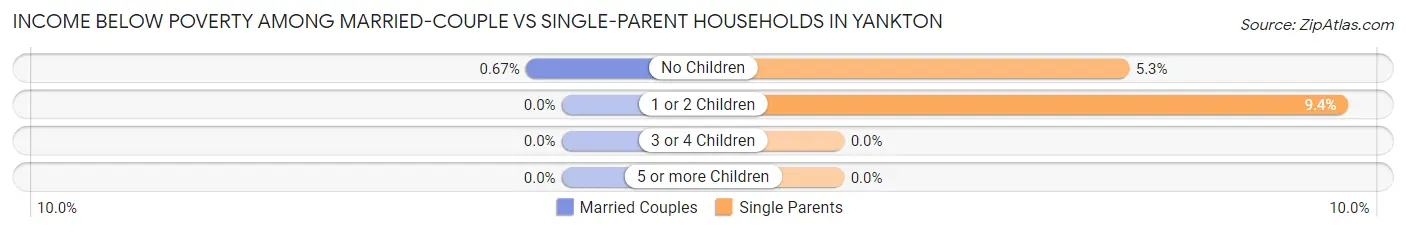
| Children | Married-Couple Families | Single-Parent Households |
| No Children | 11 (0.7%) | 11 (5.3%) |
| 1 or 2 Children | 0 (0.0%) | 50 (9.4%) |
| 3 or 4 Children | 0 (0.0%) | 0 (0.0%) |
| 5 or more Children | 0 (0.0%) | 0 (0.0%) |
| Total | 11 (0.4%) | 61 (7.6%) |
Employment Characteristics in Yankton
Employment by Class of Employer in Yankton
Among the 7,625 employed individuals in Yankton, private company employees (4,952 | 64.9%), not-for-profit organizations (1,017 | 13.3%), and state government employees (546 | 7.2%) make up the most common classes of employment.
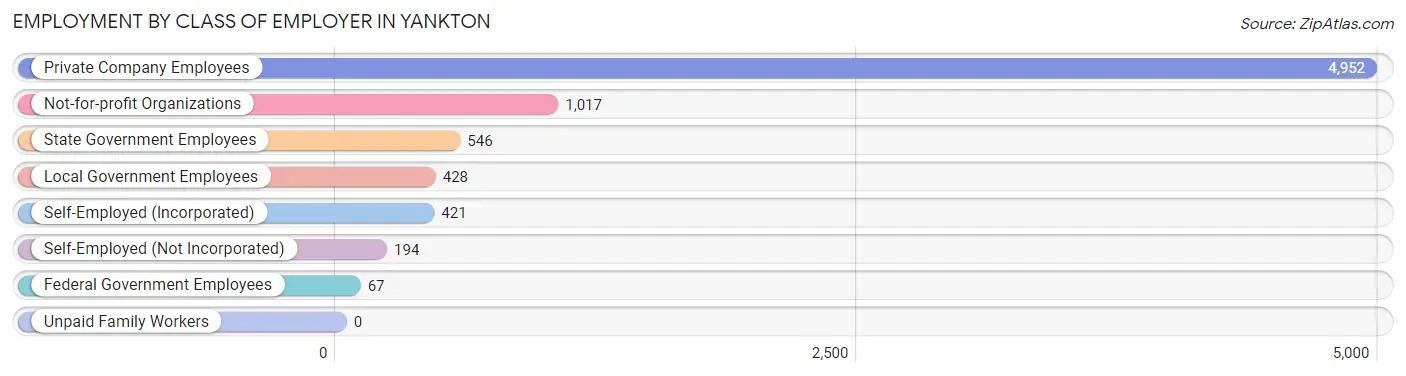
| Employer Class | # Employees | % Employees |
| Private Company Employees | 4,952 | 64.9% |
| Self-Employed (Incorporated) | 421 | 5.5% |
| Self-Employed (Not Incorporated) | 194 | 2.5% |
| Not-for-profit Organizations | 1,017 | 13.3% |
| Local Government Employees | 428 | 5.6% |
| State Government Employees | 546 | 7.2% |
| Federal Government Employees | 67 | 0.9% |
| Unpaid Family Workers | 0 | 0.0% |
| Total | 7,625 | 100.0% |
Employment Status by Age in Yankton
According to the labor force statistics for Yankton, out of the total population over 16 years of age (12,614), 62.3% or 7,859 individuals are in the labor force, with 1.1% or 86 of them unemployed. The age group with the highest labor force participation rate is 25 to 29 years, with 98.1% or 855 individuals in the labor force. Within the labor force, the 60 to 64 years age range has the highest percentage of unemployed individuals, with 2.7% or 19 of them being unemployed.
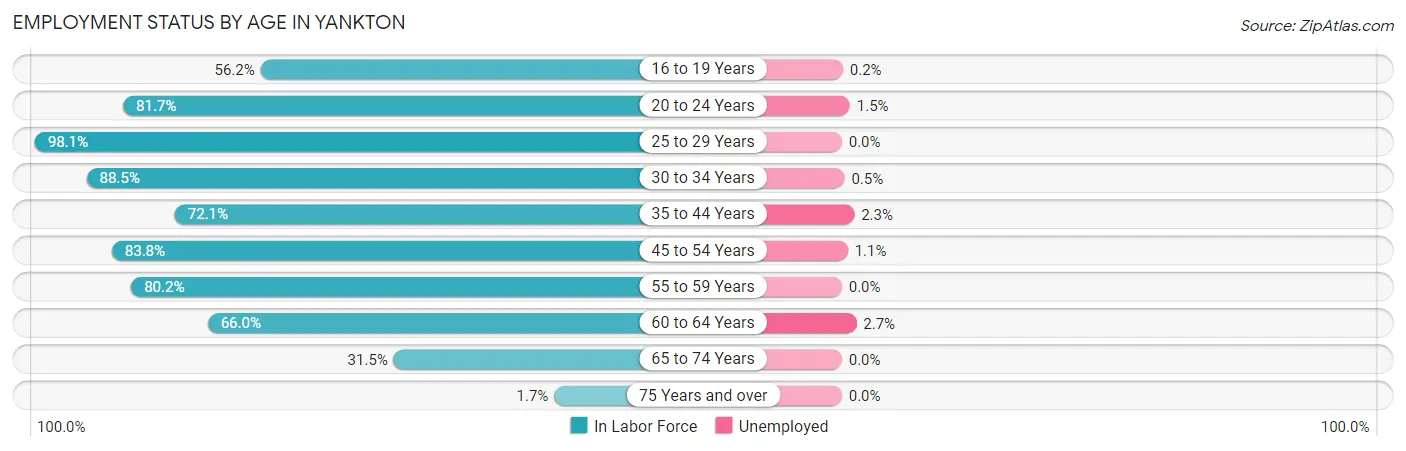
| Age Bracket | In Labor Force | Unemployed |
| 16 to 19 Years | 474 (56.2%) | 1 (0.2%) |
| 20 to 24 Years | 1,041 (81.7%) | 16 (1.5%) |
| 25 to 29 Years | 855 (98.1%) | 0 (0.0%) |
| 30 to 34 Years | 764 (88.5%) | 4 (0.5%) |
| 35 to 44 Years | 1,417 (72.1%) | 33 (2.3%) |
| 45 to 54 Years | 1,442 (83.8%) | 16 (1.1%) |
| 55 to 59 Years | 617 (80.2%) | 0 (0.0%) |
| 60 to 64 Years | 706 (66.0%) | 19 (2.7%) |
| 65 to 74 Years | 515 (31.5%) | 0 (0.0%) |
| 75 Years and over | 27 (1.7%) | 0 (0.0%) |
| Total | 7,859 (62.3%) | 86 (1.1%) |
Employment Status by Educational Attainment in Yankton
According to labor force statistics for Yankton, 79.9% of individuals (5,801) out of the total population between 25 and 64 years of age (7,260) are in the labor force, with 1.2% or 70 of them being unemployed. The group with the highest labor force participation rate are those with the educational attainment of bachelor's degree or higher, with 90.6% or 2,198 individuals in the labor force. Within the labor force, individuals with high school diploma education have the highest percentage of unemployment, with 2.0% or 30 of them being unemployed.
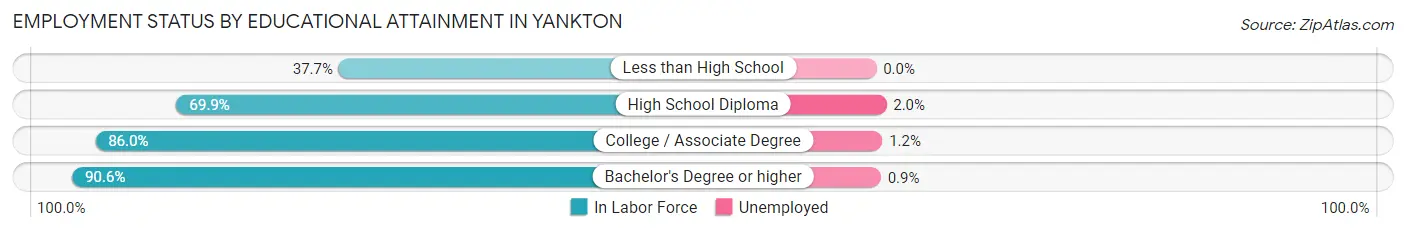
| Educational Attainment | In Labor Force | Unemployed |
| Less than High School | 167 (37.7%) | 0 (0.0%) |
| High School Diploma | 1,483 (69.9%) | 42 (2.0%) |
| College / Associate Degree | 1,951 (86.0%) | 27 (1.2%) |
| Bachelor's Degree or higher | 2,198 (90.6%) | 22 (0.9%) |
| Total | 5,801 (79.9%) | 87 (1.2%) |
Employment Occupations by Sex in Yankton
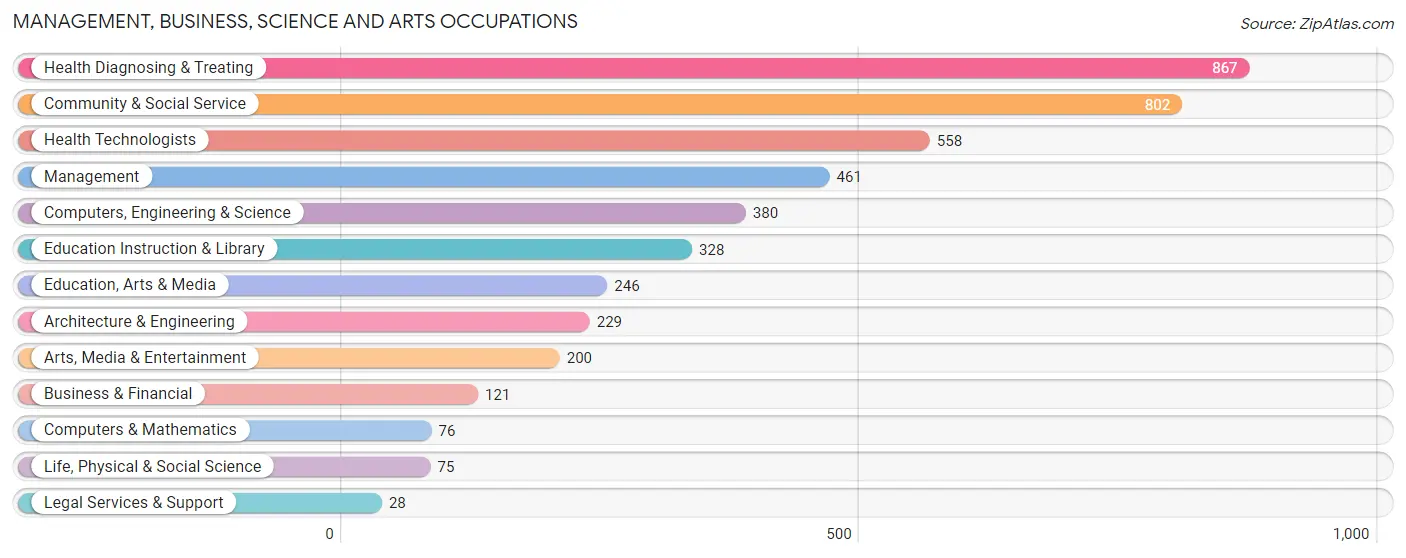
Management, Business, Science and Arts Occupations
The most common Management, Business, Science and Arts occupations in Yankton are Health Diagnosing & Treating (867 | 11.2%), Community & Social Service (802 | 10.3%), Health Technologists (558 | 7.2%), Management (461 | 5.9%), and Computers, Engineering & Science (380 | 4.9%).
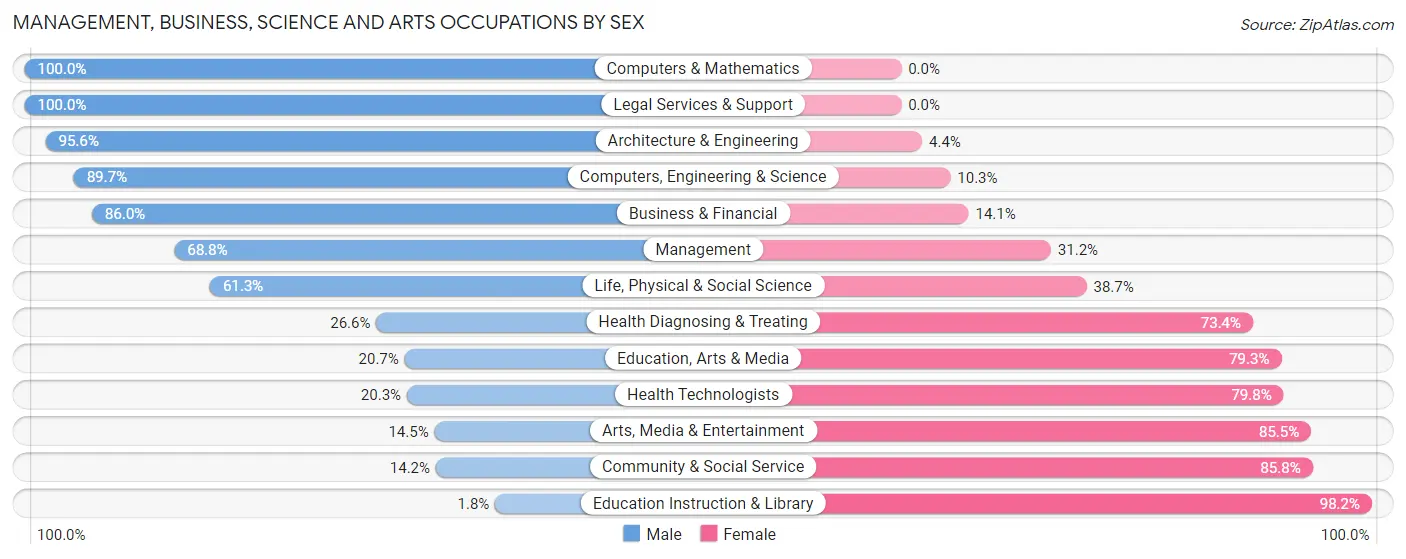
Management, Business, Science and Arts Occupations by Sex
Within the Management, Business, Science and Arts occupations in Yankton, the most male-oriented occupations are Computers & Mathematics (100.0%), Legal Services & Support (100.0%), and Architecture & Engineering (95.6%), while the most female-oriented occupations are Education Instruction & Library (98.2%), Community & Social Service (85.8%), and Arts, Media & Entertainment (85.5%).
| Occupation | Male | Female |
| Management | 317 (68.8%) | 144 (31.2%) |
| Business & Financial | 104 (86.0%) | 17 (14.1%) |
| Computers, Engineering & Science | 341 (89.7%) | 39 (10.3%) |
| Computers & Mathematics | 76 (100.0%) | 0 (0.0%) |
| Architecture & Engineering | 219 (95.6%) | 10 (4.4%) |
| Life, Physical & Social Science | 46 (61.3%) | 29 (38.7%) |
| Community & Social Service | 114 (14.2%) | 688 (85.8%) |
| Education, Arts & Media | 51 (20.7%) | 195 (79.3%) |
| Legal Services & Support | 28 (100.0%) | 0 (0.0%) |
| Education Instruction & Library | 6 (1.8%) | 322 (98.2%) |
| Arts, Media & Entertainment | 29 (14.5%) | 171 (85.5%) |
| Health Diagnosing & Treating | 231 (26.6%) | 636 (73.4%) |
| Health Technologists | 113 (20.3%) | 445 (79.7%) |
| Total (Category) | 1,107 (42.1%) | 1,524 (57.9%) |
| Total (Overall) | 4,110 (52.9%) | 3,658 (47.1%) |
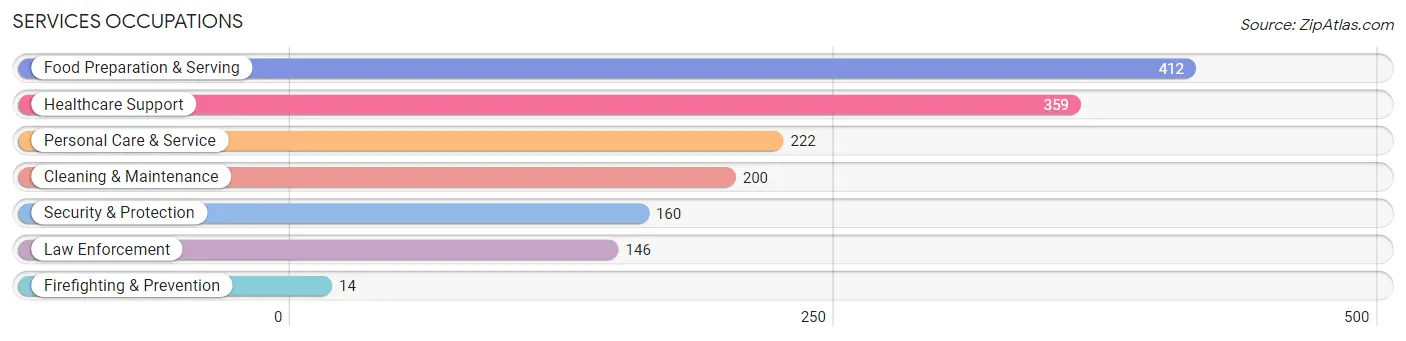
Services Occupations
The most common Services occupations in Yankton are Food Preparation & Serving (412 | 5.3%), Healthcare Support (359 | 4.6%), Personal Care & Service (222 | 2.9%), Cleaning & Maintenance (200 | 2.6%), and Security & Protection (160 | 2.1%).
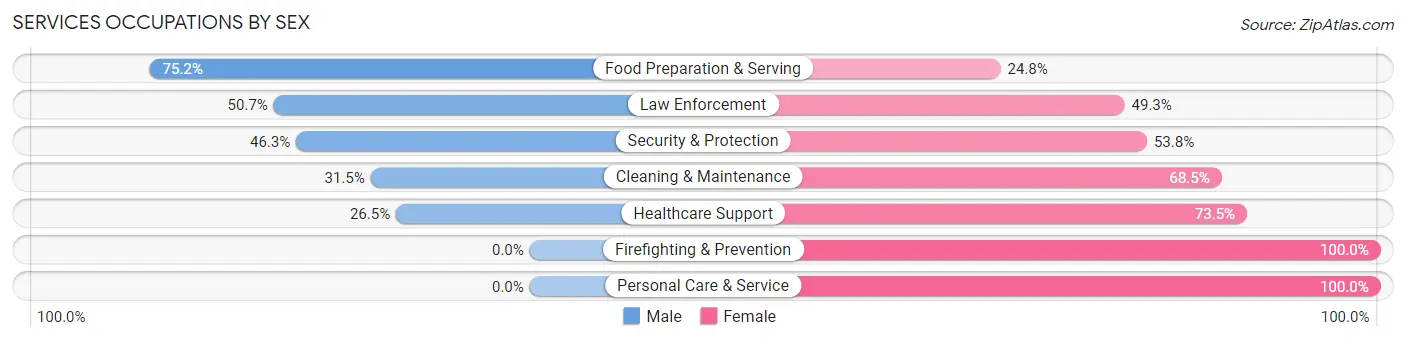
Services Occupations by Sex
Within the Services occupations in Yankton, the most male-oriented occupations are Food Preparation & Serving (75.2%), Law Enforcement (50.7%), and Security & Protection (46.3%), while the most female-oriented occupations are Firefighting & Prevention (100.0%), Personal Care & Service (100.0%), and Healthcare Support (73.5%).
| Occupation | Male | Female |
| Healthcare Support | 95 (26.5%) | 264 (73.5%) |
| Security & Protection | 74 (46.3%) | 86 (53.7%) |
| Firefighting & Prevention | 0 (0.0%) | 14 (100.0%) |
| Law Enforcement | 74 (50.7%) | 72 (49.3%) |
| Food Preparation & Serving | 310 (75.2%) | 102 (24.8%) |
| Cleaning & Maintenance | 63 (31.5%) | 137 (68.5%) |
| Personal Care & Service | 0 (0.0%) | 222 (100.0%) |
| Total (Category) | 542 (40.1%) | 811 (59.9%) |
| Total (Overall) | 4,110 (52.9%) | 3,658 (47.1%) |
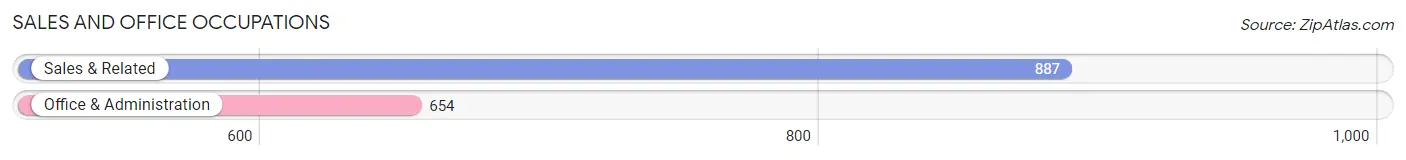
Sales and Office Occupations
The most common Sales and Office occupations in Yankton are Sales & Related (887 | 11.4%), and Office & Administration (654 | 8.4%).
Sales and Office Occupations by Sex
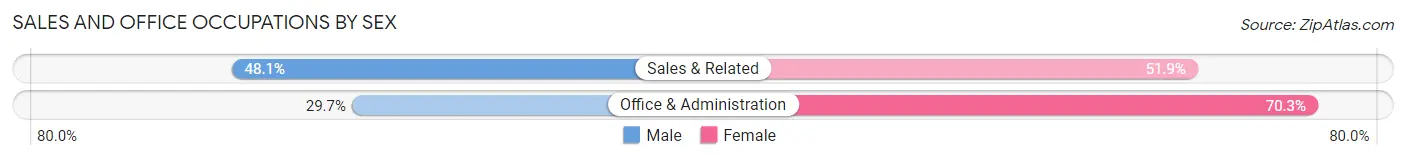
| Occupation | Male | Female |
| Sales & Related | 427 (48.1%) | 460 (51.9%) |
| Office & Administration | 194 (29.7%) | 460 (70.3%) |
| Total (Category) | 621 (40.3%) | 920 (59.7%) |
| Total (Overall) | 4,110 (52.9%) | 3,658 (47.1%) |
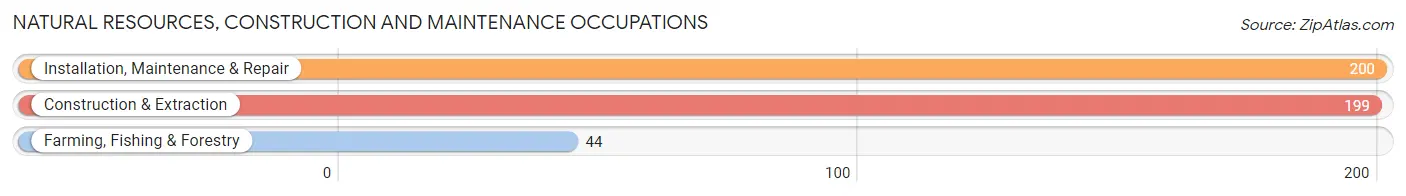
Natural Resources, Construction and Maintenance Occupations
The most common Natural Resources, Construction and Maintenance occupations in Yankton are Installation, Maintenance & Repair (200 | 2.6%), Construction & Extraction (199 | 2.6%), and Farming, Fishing & Forestry (44 | 0.6%).
Natural Resources, Construction and Maintenance Occupations by Sex
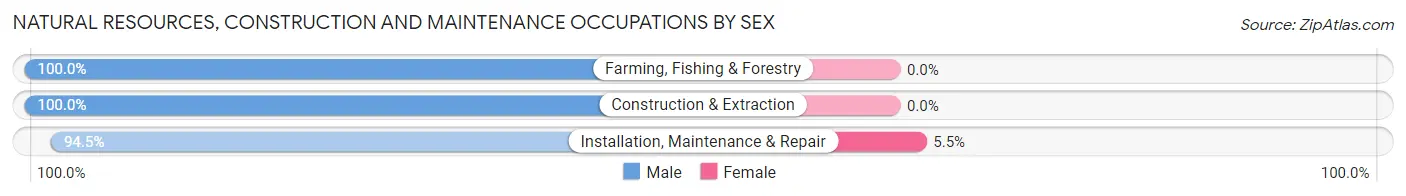
| Occupation | Male | Female |
| Farming, Fishing & Forestry | 44 (100.0%) | 0 (0.0%) |
| Construction & Extraction | 199 (100.0%) | 0 (0.0%) |
| Installation, Maintenance & Repair | 189 (94.5%) | 11 (5.5%) |
| Total (Category) | 432 (97.5%) | 11 (2.5%) |
| Total (Overall) | 4,110 (52.9%) | 3,658 (47.1%) |
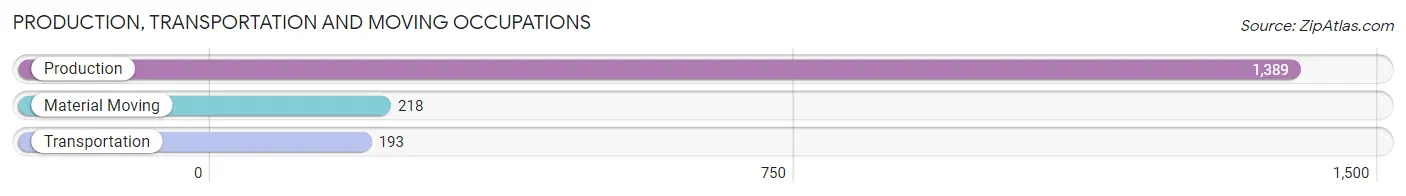
Production, Transportation and Moving Occupations
The most common Production, Transportation and Moving occupations in Yankton are Production (1,389 | 17.9%), Material Moving (218 | 2.8%), and Transportation (193 | 2.5%).
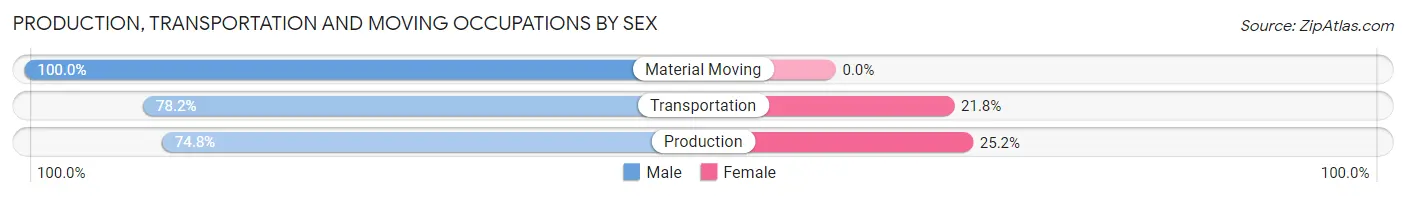
Production, Transportation and Moving Occupations by Sex
| Occupation | Male | Female |
| Production | 1,039 (74.8%) | 350 (25.2%) |
| Transportation | 151 (78.2%) | 42 (21.8%) |
| Material Moving | 218 (100.0%) | 0 (0.0%) |
| Total (Category) | 1,408 (78.2%) | 392 (21.8%) |
| Total (Overall) | 4,110 (52.9%) | 3,658 (47.1%) |
Employment Industries by Sex in Yankton
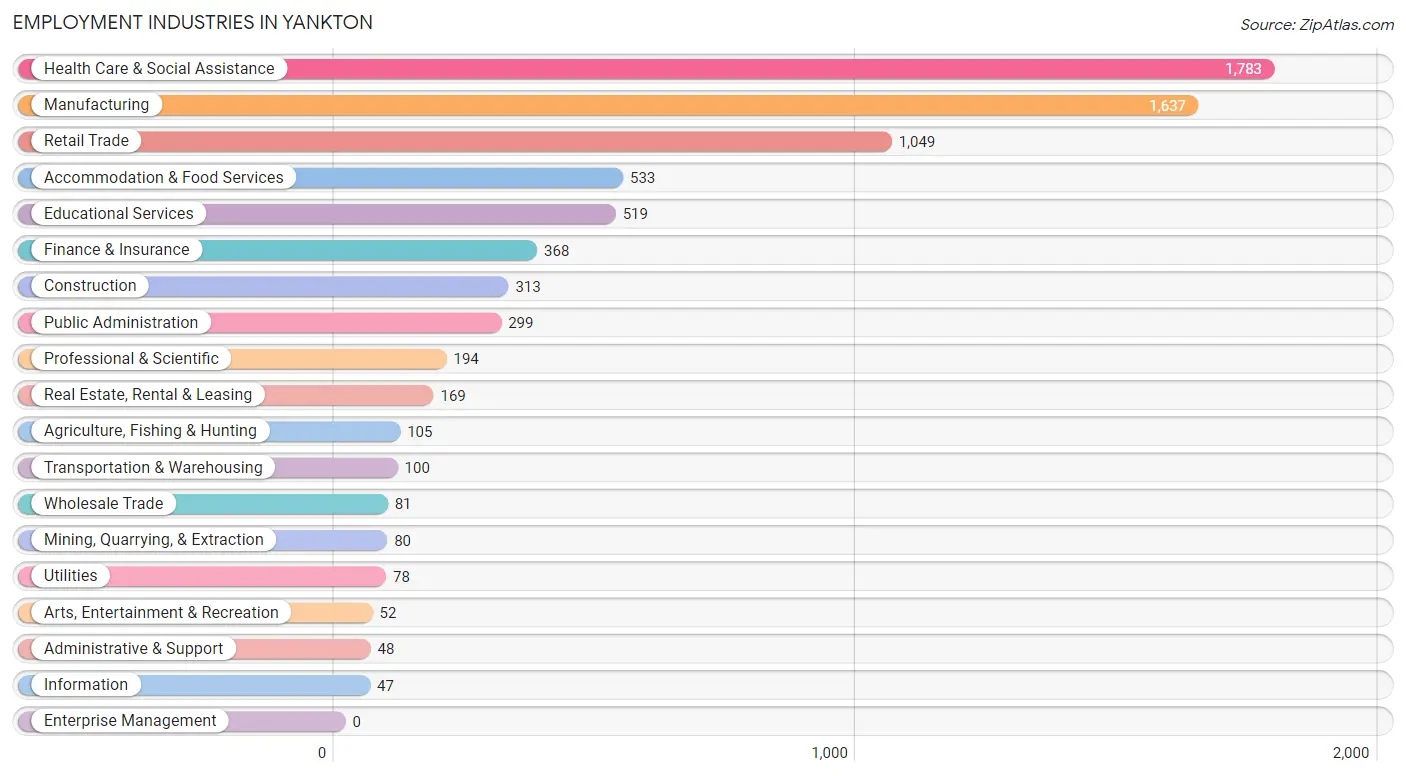
Employment Industries in Yankton
The major employment industries in Yankton include Health Care & Social Assistance (1,783 | 23.0%), Manufacturing (1,637 | 21.1%), Retail Trade (1,049 | 13.5%), Accommodation & Food Services (533 | 6.9%), and Educational Services (519 | 6.7%).
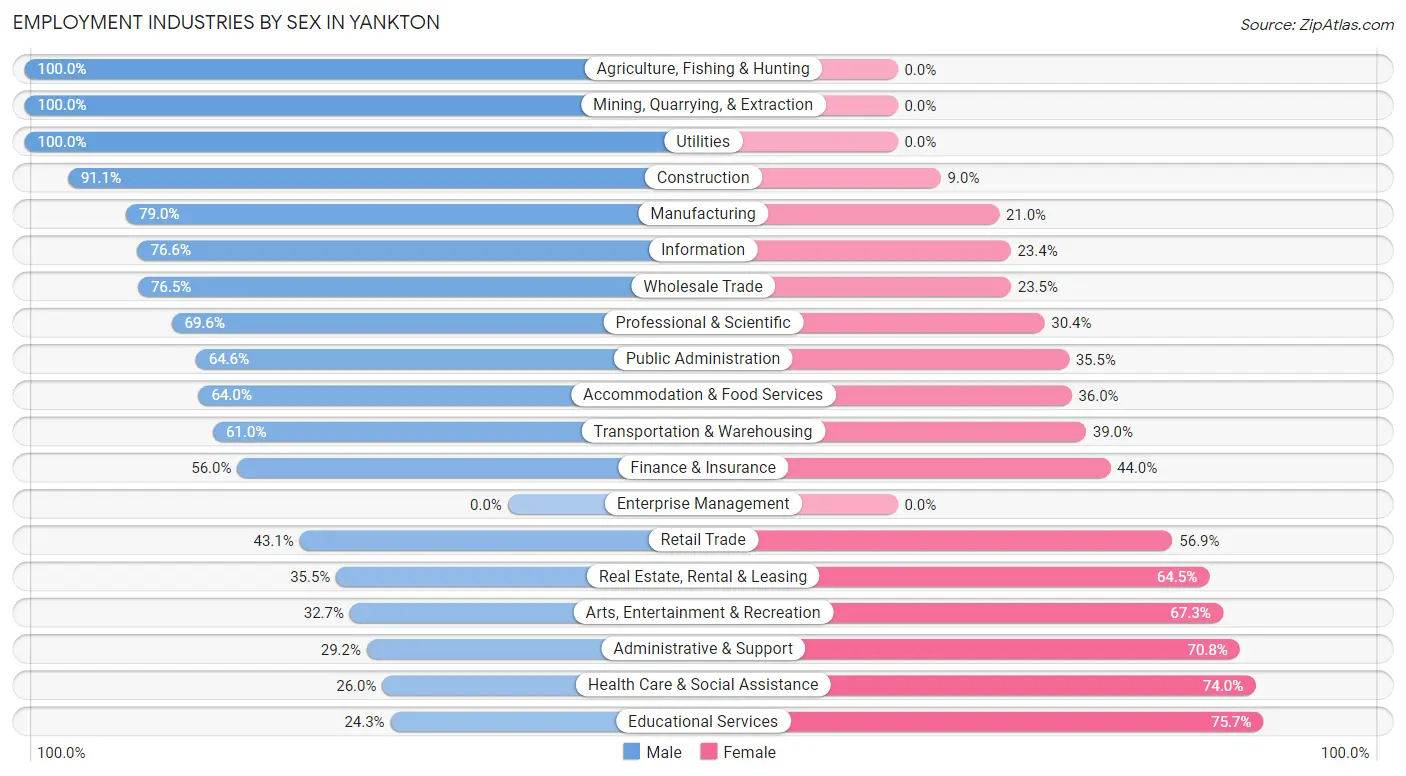
Employment Industries by Sex in Yankton
The Yankton industries that see more men than women are Agriculture, Fishing & Hunting (100.0%), Mining, Quarrying, & Extraction (100.0%), and Utilities (100.0%), whereas the industries that tend to have a higher number of women are Educational Services (75.7%), Health Care & Social Assistance (74.0%), and Administrative & Support (70.8%).
| Industry | Male | Female |
| Agriculture, Fishing & Hunting | 105 (100.0%) | 0 (0.0%) |
| Mining, Quarrying, & Extraction | 80 (100.0%) | 0 (0.0%) |
| Construction | 285 (91.0%) | 28 (8.9%) |
| Manufacturing | 1,293 (79.0%) | 344 (21.0%) |
| Wholesale Trade | 62 (76.5%) | 19 (23.5%) |
| Retail Trade | 452 (43.1%) | 597 (56.9%) |
| Transportation & Warehousing | 61 (61.0%) | 39 (39.0%) |
| Utilities | 78 (100.0%) | 0 (0.0%) |
| Information | 36 (76.6%) | 11 (23.4%) |
| Finance & Insurance | 206 (56.0%) | 162 (44.0%) |
| Real Estate, Rental & Leasing | 60 (35.5%) | 109 (64.5%) |
| Professional & Scientific | 135 (69.6%) | 59 (30.4%) |
| Enterprise Management | 0 (0.0%) | 0 (0.0%) |
| Administrative & Support | 14 (29.2%) | 34 (70.8%) |
| Educational Services | 126 (24.3%) | 393 (75.7%) |
| Health Care & Social Assistance | 463 (26.0%) | 1,320 (74.0%) |
| Arts, Entertainment & Recreation | 17 (32.7%) | 35 (67.3%) |
| Accommodation & Food Services | 341 (64.0%) | 192 (36.0%) |
| Public Administration | 193 (64.5%) | 106 (35.4%) |
| Total | 4,110 (52.9%) | 3,658 (47.1%) |
Education in Yankton
School Enrollment in Yankton
The most common levels of schooling among the 3,493 students in Yankton are high school (960 | 27.5%), middle school (817 | 23.4%), and college / undergraduate (623 | 17.8%).
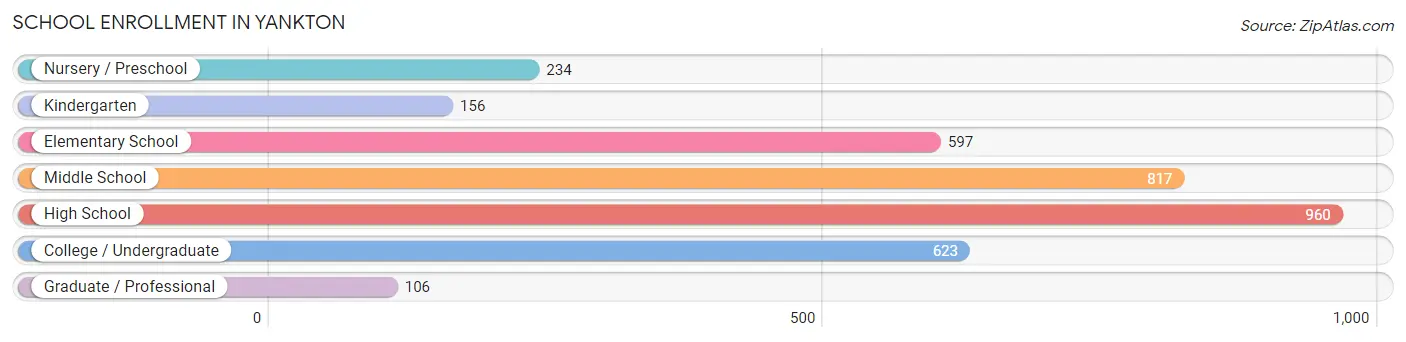
| School Level | # Students | % Students |
| Nursery / Preschool | 234 | 6.7% |
| Kindergarten | 156 | 4.5% |
| Elementary School | 597 | 17.1% |
| Middle School | 817 | 23.4% |
| High School | 960 | 27.5% |
| College / Undergraduate | 623 | 17.8% |
| Graduate / Professional | 106 | 3.0% |
| Total | 3,493 | 100.0% |
School Enrollment by Age by Funding Source in Yankton
Out of a total of 3,493 students who are enrolled in schools in Yankton, 545 (15.6%) attend a private institution, while the remaining 2,948 (84.4%) are enrolled in public schools. The age group of 20 to 24 year olds has the highest likelihood of being enrolled in private schools, with 217 (70.0% in the age bracket) enrolled. Conversely, the age group of 15 to 17 year olds has the lowest likelihood of being enrolled in a private school, with 574 (100.0% in the age bracket) attending a public institution.
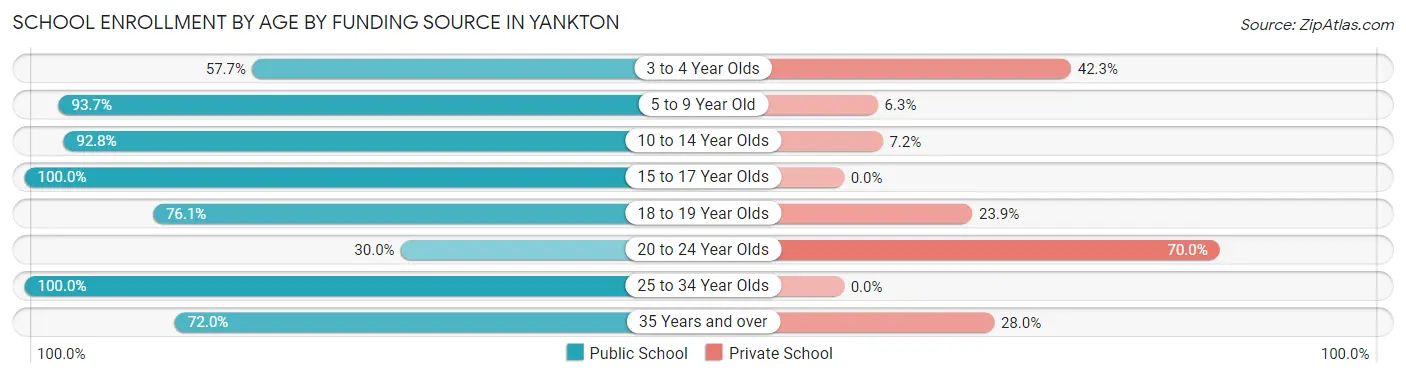
| Age Bracket | Public School | Private School |
| 3 to 4 Year Olds | 90 (57.7%) | 66 (42.3%) |
| 5 to 9 Year Old | 621 (93.7%) | 42 (6.3%) |
| 10 to 14 Year Olds | 1,053 (92.8%) | 82 (7.2%) |
| 15 to 17 Year Olds | 574 (100.0%) | 0 (0.0%) |
| 18 to 19 Year Olds | 280 (76.1%) | 88 (23.9%) |
| 20 to 24 Year Olds | 93 (30.0%) | 217 (70.0%) |
| 25 to 34 Year Olds | 112 (100.0%) | 0 (0.0%) |
| 35 Years and over | 126 (72.0%) | 49 (28.0%) |
| Total | 2,948 (84.4%) | 545 (15.6%) |
Educational Attainment by Field of Study in Yankton
Education (861 | 24.6%), science & technology (641 | 18.3%), business (415 | 11.8%), bio, nature & agricultural (292 | 8.3%), and arts & humanities (229 | 6.5%) are the most common fields of study among 3,503 individuals in Yankton who have obtained a bachelor's degree or higher.
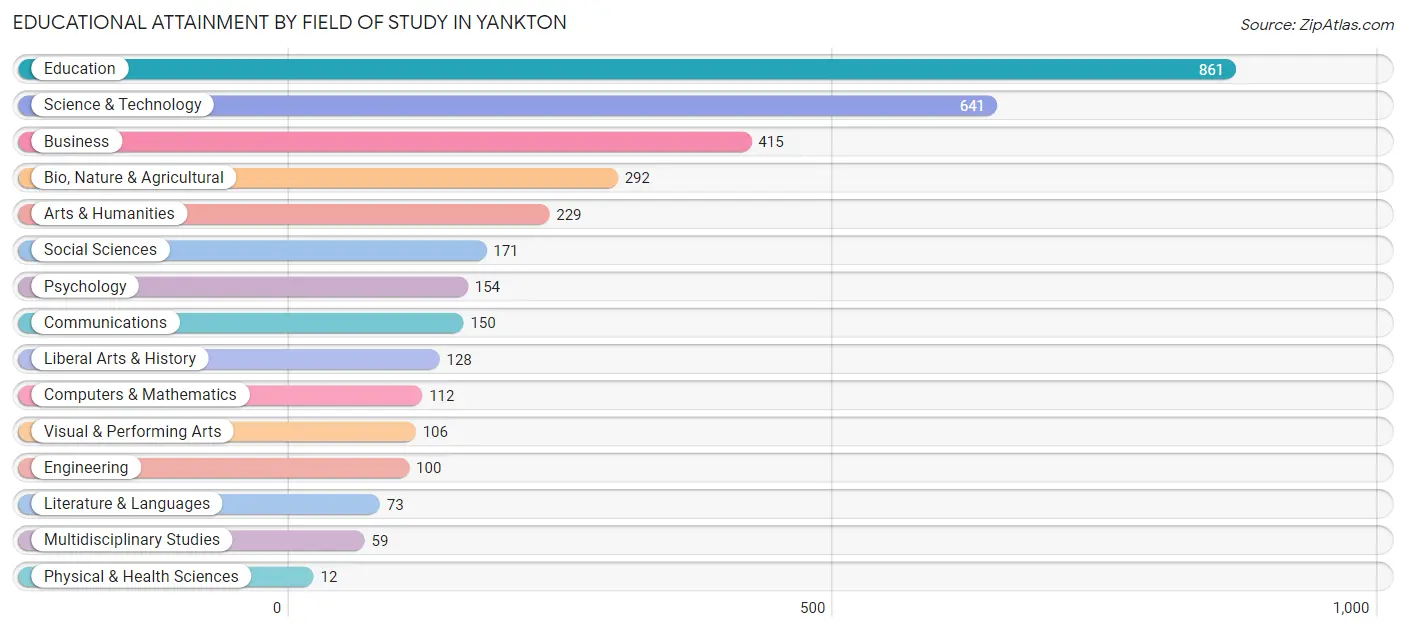
| Field of Study | # Graduates | % Graduates |
| Computers & Mathematics | 112 | 3.2% |
| Bio, Nature & Agricultural | 292 | 8.3% |
| Physical & Health Sciences | 12 | 0.3% |
| Psychology | 154 | 4.4% |
| Social Sciences | 171 | 4.9% |
| Engineering | 100 | 2.9% |
| Multidisciplinary Studies | 59 | 1.7% |
| Science & Technology | 641 | 18.3% |
| Business | 415 | 11.8% |
| Education | 861 | 24.6% |
| Literature & Languages | 73 | 2.1% |
| Liberal Arts & History | 128 | 3.6% |
| Visual & Performing Arts | 106 | 3.0% |
| Communications | 150 | 4.3% |
| Arts & Humanities | 229 | 6.5% |
| Total | 3,503 | 100.0% |
Transportation & Commute in Yankton
Vehicle Availability by Sex in Yankton
The most prevalent vehicle ownership categories in Yankton are males with 2 vehicles (1,613, accounting for 40.3%) and females with 2 vehicles (1,372, making up 46.3%).
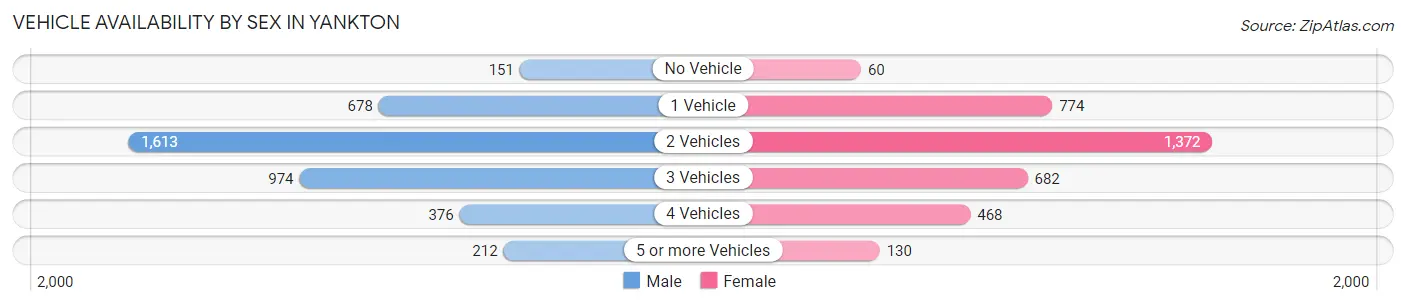
| Vehicles Available | Male | Female |
| No Vehicle | 151 (3.8%) | 60 (1.7%) |
| 1 Vehicle | 678 (16.9%) | 774 (22.2%) |
| 2 Vehicles | 1,613 (40.3%) | 1,372 (39.4%) |
| 3 Vehicles | 974 (24.3%) | 682 (19.6%) |
| 4 Vehicles | 376 (9.4%) | 468 (13.4%) |
| 5 or more Vehicles | 212 (5.3%) | 130 (3.7%) |
| Total | 4,004 (100.0%) | 3,486 (100.0%) |
Commute Time in Yankton
The most frequently occuring commute durations in Yankton are 5 to 9 minutes (2,984 commuters, 41.0%), 10 to 14 minutes (1,671 commuters, 23.0%), and less than 5 minutes (885 commuters, 12.2%).
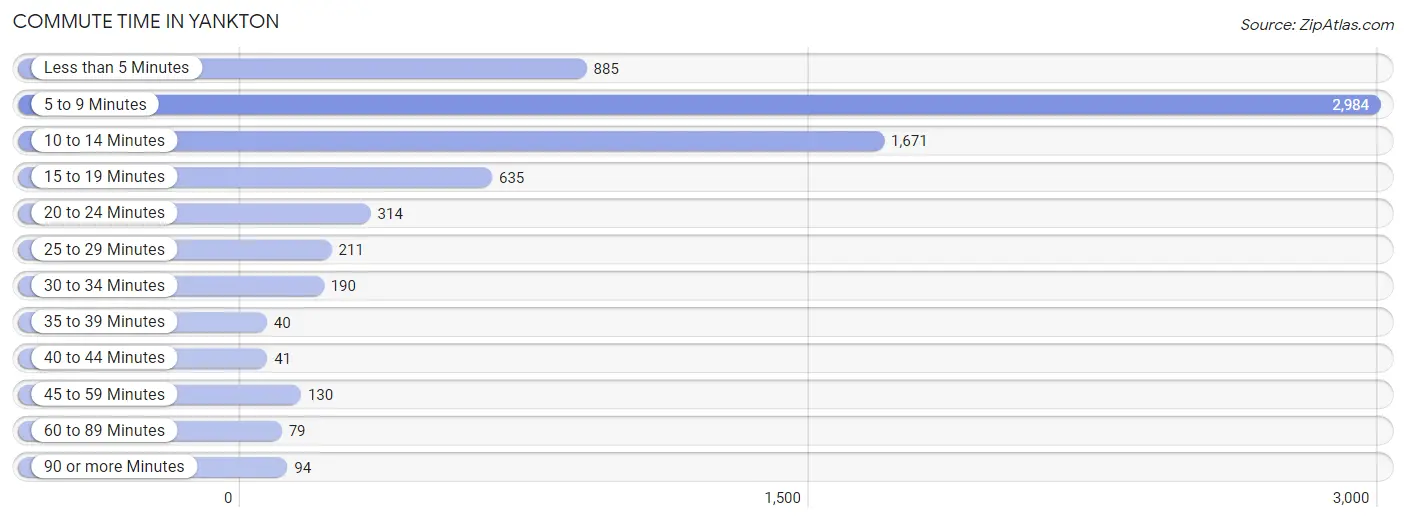
| Commute Time | # Commuters | % Commuters |
| Less than 5 Minutes | 885 | 12.2% |
| 5 to 9 Minutes | 2,984 | 41.0% |
| 10 to 14 Minutes | 1,671 | 23.0% |
| 15 to 19 Minutes | 635 | 8.7% |
| 20 to 24 Minutes | 314 | 4.3% |
| 25 to 29 Minutes | 211 | 2.9% |
| 30 to 34 Minutes | 190 | 2.6% |
| 35 to 39 Minutes | 40 | 0.5% |
| 40 to 44 Minutes | 41 | 0.6% |
| 45 to 59 Minutes | 130 | 1.8% |
| 60 to 89 Minutes | 79 | 1.1% |
| 90 or more Minutes | 94 | 1.3% |
Commute Time by Sex in Yankton
The most common commute times in Yankton are 5 to 9 minutes (1,690 commuters, 42.7%) for males and 5 to 9 minutes (1,294 commuters, 39.0%) for females.
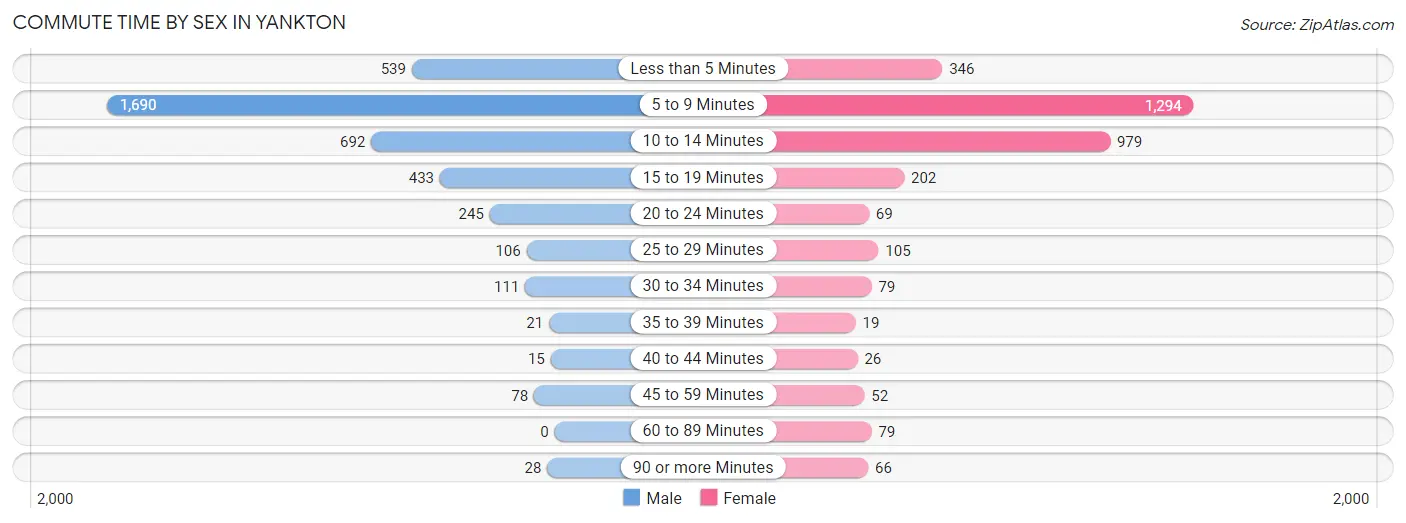
| Commute Time | Male | Female |
| Less than 5 Minutes | 539 (13.6%) | 346 (10.4%) |
| 5 to 9 Minutes | 1,690 (42.7%) | 1,294 (39.0%) |
| 10 to 14 Minutes | 692 (17.5%) | 979 (29.5%) |
| 15 to 19 Minutes | 433 (10.9%) | 202 (6.1%) |
| 20 to 24 Minutes | 245 (6.2%) | 69 (2.1%) |
| 25 to 29 Minutes | 106 (2.7%) | 105 (3.2%) |
| 30 to 34 Minutes | 111 (2.8%) | 79 (2.4%) |
| 35 to 39 Minutes | 21 (0.5%) | 19 (0.6%) |
| 40 to 44 Minutes | 15 (0.4%) | 26 (0.8%) |
| 45 to 59 Minutes | 78 (2.0%) | 52 (1.6%) |
| 60 to 89 Minutes | 0 (0.0%) | 79 (2.4%) |
| 90 or more Minutes | 28 (0.7%) | 66 (2.0%) |
Time of Departure to Work by Sex in Yankton
The most frequent times of departure to work in Yankton are 7:30 AM to 7:59 AM (660, 16.7%) for males and 7:30 AM to 7:59 AM (633, 19.1%) for females.
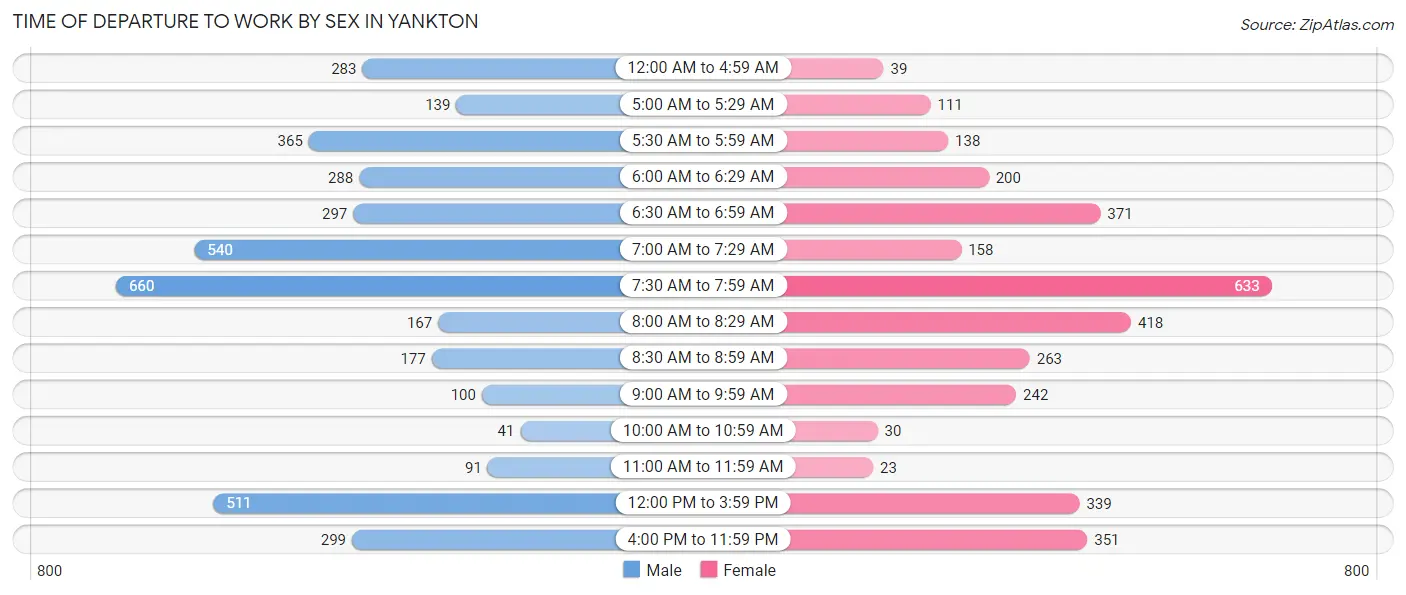
| Time of Departure | Male | Female |
| 12:00 AM to 4:59 AM | 283 (7.1%) | 39 (1.2%) |
| 5:00 AM to 5:29 AM | 139 (3.5%) | 111 (3.4%) |
| 5:30 AM to 5:59 AM | 365 (9.2%) | 138 (4.2%) |
| 6:00 AM to 6:29 AM | 288 (7.3%) | 200 (6.0%) |
| 6:30 AM to 6:59 AM | 297 (7.5%) | 371 (11.2%) |
| 7:00 AM to 7:29 AM | 540 (13.6%) | 158 (4.8%) |
| 7:30 AM to 7:59 AM | 660 (16.7%) | 633 (19.1%) |
| 8:00 AM to 8:29 AM | 167 (4.2%) | 418 (12.6%) |
| 8:30 AM to 8:59 AM | 177 (4.5%) | 263 (7.9%) |
| 9:00 AM to 9:59 AM | 100 (2.5%) | 242 (7.3%) |
| 10:00 AM to 10:59 AM | 41 (1.0%) | 30 (0.9%) |
| 11:00 AM to 11:59 AM | 91 (2.3%) | 23 (0.7%) |
| 12:00 PM to 3:59 PM | 511 (12.9%) | 339 (10.2%) |
| 4:00 PM to 11:59 PM | 299 (7.5%) | 351 (10.6%) |
| Total | 3,958 (100.0%) | 3,316 (100.0%) |
Housing Occupancy in Yankton
Occupancy by Ownership in Yankton
Of the total 6,668 dwellings in Yankton, owner-occupied units account for 4,305 (64.6%), while renter-occupied units make up 2,363 (35.4%).
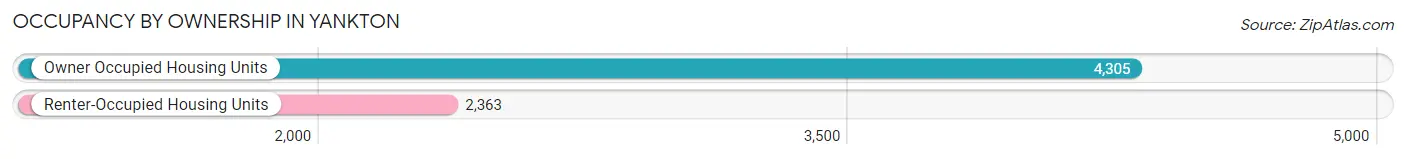
| Occupancy | # Housing Units | % Housing Units |
| Owner Occupied Housing Units | 4,305 | 64.6% |
| Renter-Occupied Housing Units | 2,363 | 35.4% |
| Total Occupied Housing Units | 6,668 | 100.0% |
Occupancy by Household Size in Yankton
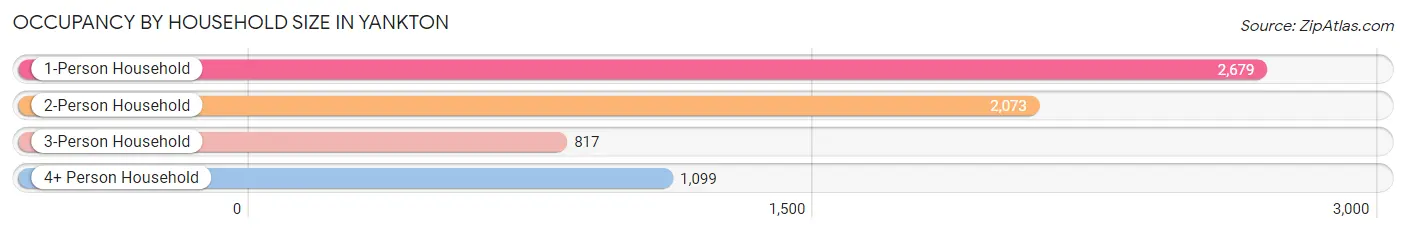
| Household Size | # Housing Units | % Housing Units |
| 1-Person Household | 2,679 | 40.2% |
| 2-Person Household | 2,073 | 31.1% |
| 3-Person Household | 817 | 12.2% |
| 4+ Person Household | 1,099 | 16.5% |
| Total Housing Units | 6,668 | 100.0% |
Occupancy by Ownership by Household Size in Yankton
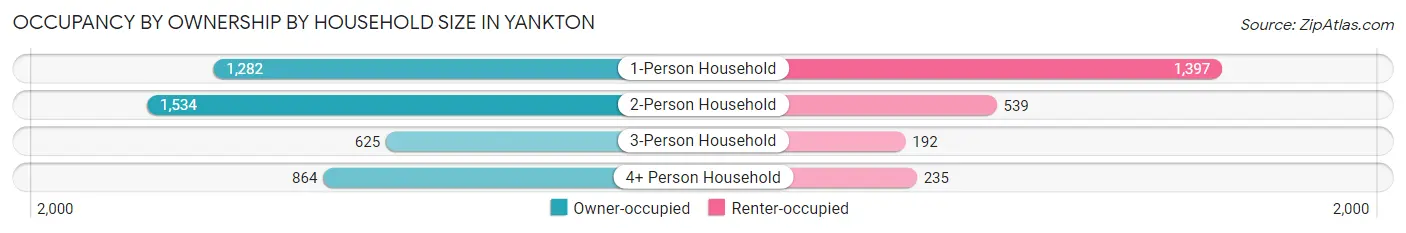
| Household Size | Owner-occupied | Renter-occupied |
| 1-Person Household | 1,282 (47.8%) | 1,397 (52.1%) |
| 2-Person Household | 1,534 (74.0%) | 539 (26.0%) |
| 3-Person Household | 625 (76.5%) | 192 (23.5%) |
| 4+ Person Household | 864 (78.6%) | 235 (21.4%) |
| Total Housing Units | 4,305 (64.6%) | 2,363 (35.4%) |
Occupancy by Educational Attainment in Yankton
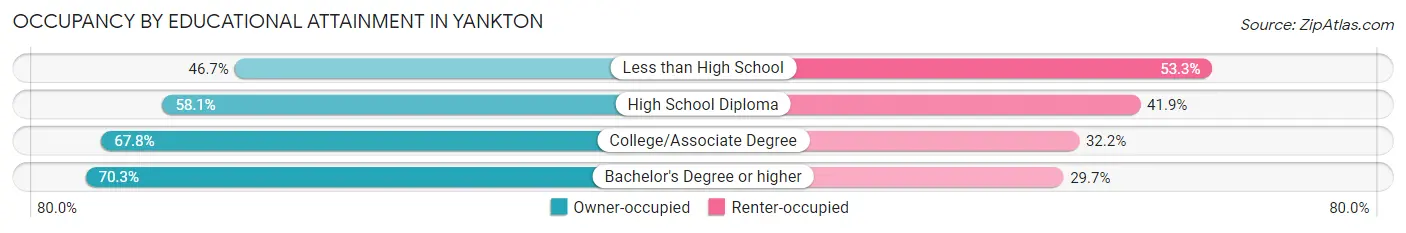
| Household Size | Owner-occupied | Renter-occupied |
| Less than High School | 162 (46.7%) | 185 (53.3%) |
| High School Diploma | 1,180 (58.1%) | 850 (41.9%) |
| College/Associate Degree | 1,491 (67.8%) | 707 (32.2%) |
| Bachelor's Degree or higher | 1,472 (70.3%) | 621 (29.7%) |
Occupancy by Age of Householder in Yankton
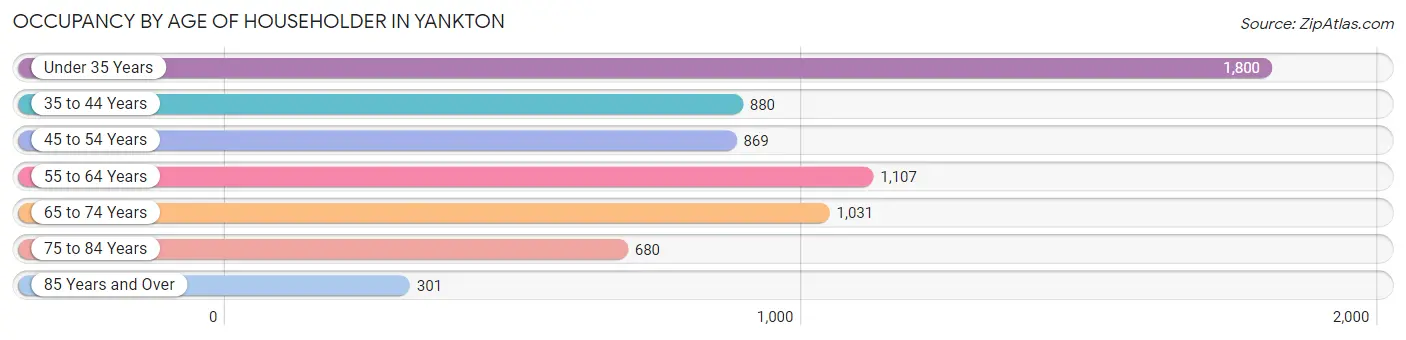
| Age Bracket | # Households | % Households |
| Under 35 Years | 1,800 | 27.0% |
| 35 to 44 Years | 880 | 13.2% |
| 45 to 54 Years | 869 | 13.0% |
| 55 to 64 Years | 1,107 | 16.6% |
| 65 to 74 Years | 1,031 | 15.5% |
| 75 to 84 Years | 680 | 10.2% |
| 85 Years and Over | 301 | 4.5% |
| Total | 6,668 | 100.0% |
Housing Finances in Yankton
Median Income by Occupancy in Yankton
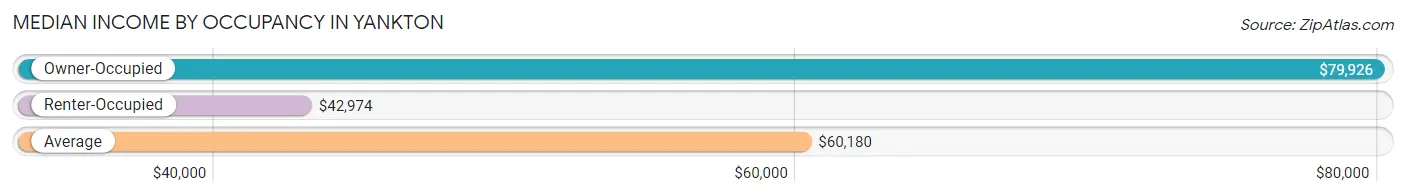
| Occupancy Type | # Households | Median Income |
| Owner-Occupied | 4,305 (64.6%) | $79,926 |
| Renter-Occupied | 2,363 (35.4%) | $42,974 |
| Average | 6,668 (100.0%) | $60,180 |
Occupancy by Householder Income Bracket in Yankton
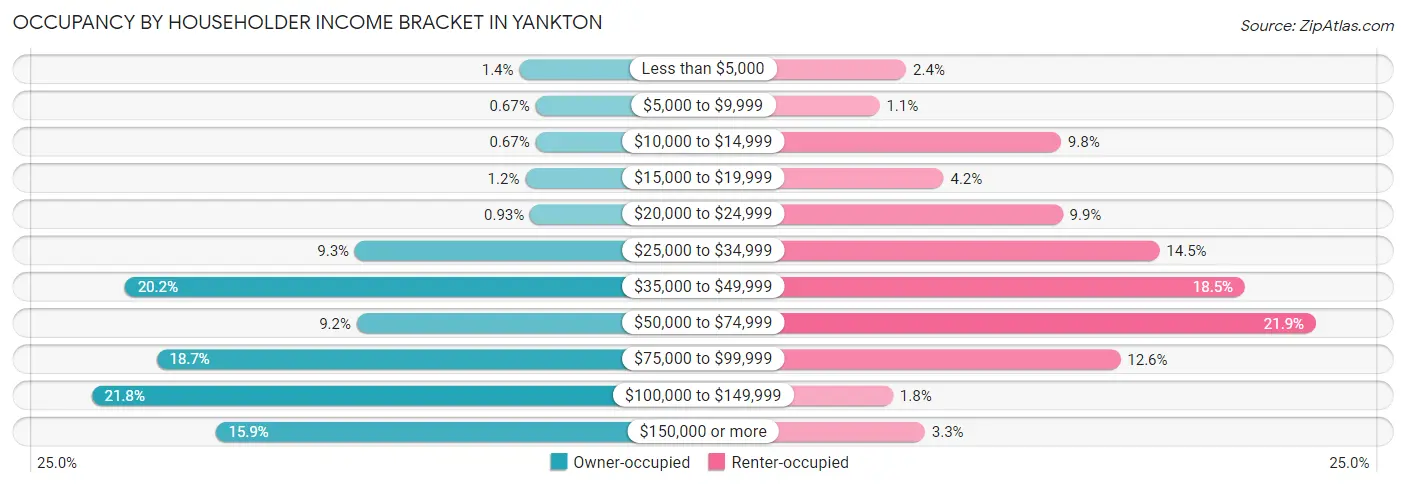
| Income Bracket | Owner-occupied | Renter-occupied |
| Less than $5,000 | 62 (1.4%) | 57 (2.4%) |
| $5,000 to $9,999 | 29 (0.7%) | 27 (1.1%) |
| $10,000 to $14,999 | 29 (0.7%) | 231 (9.8%) |
| $15,000 to $19,999 | 50 (1.2%) | 99 (4.2%) |
| $20,000 to $24,999 | 40 (0.9%) | 233 (9.9%) |
| $25,000 to $34,999 | 399 (9.3%) | 342 (14.5%) |
| $35,000 to $49,999 | 871 (20.2%) | 438 (18.5%) |
| $50,000 to $74,999 | 395 (9.2%) | 518 (21.9%) |
| $75,000 to $99,999 | 806 (18.7%) | 298 (12.6%) |
| $100,000 to $149,999 | 939 (21.8%) | 42 (1.8%) |
| $150,000 or more | 685 (15.9%) | 78 (3.3%) |
| Total | 4,305 (100.0%) | 2,363 (100.0%) |
Monthly Housing Cost Tiers in Yankton
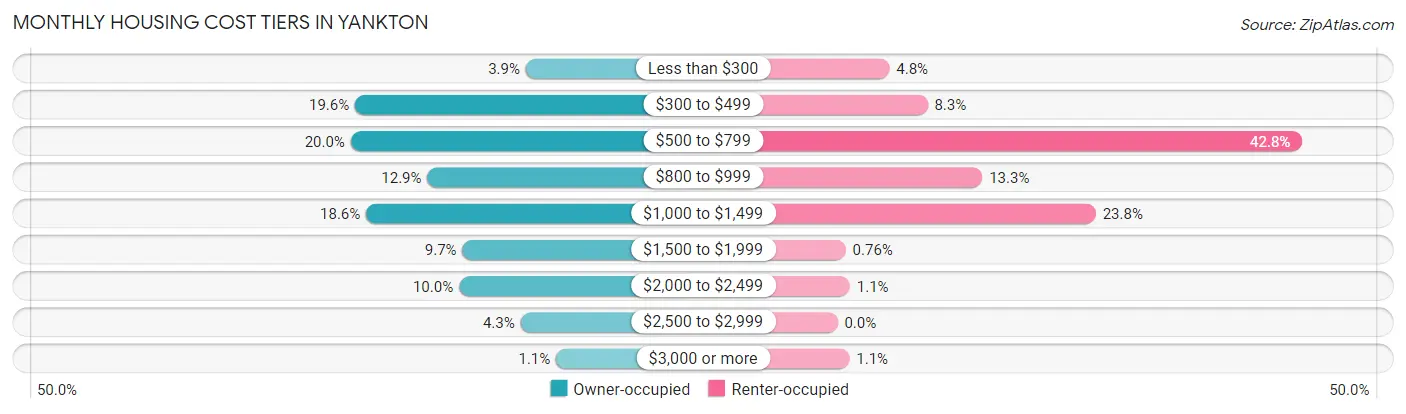
| Monthly Cost | Owner-occupied | Renter-occupied |
| Less than $300 | 166 (3.9%) | 113 (4.8%) |
| $300 to $499 | 843 (19.6%) | 196 (8.3%) |
| $500 to $799 | 860 (20.0%) | 1,011 (42.8%) |
| $800 to $999 | 556 (12.9%) | 315 (13.3%) |
| $1,000 to $1,499 | 799 (18.6%) | 562 (23.8%) |
| $1,500 to $1,999 | 417 (9.7%) | 18 (0.8%) |
| $2,000 to $2,499 | 431 (10.0%) | 27 (1.1%) |
| $2,500 to $2,999 | 187 (4.3%) | 0 (0.0%) |
| $3,000 or more | 46 (1.1%) | 26 (1.1%) |
| Total | 4,305 (100.0%) | 2,363 (100.0%) |
Physical Housing Characteristics in Yankton
Housing Structures in Yankton
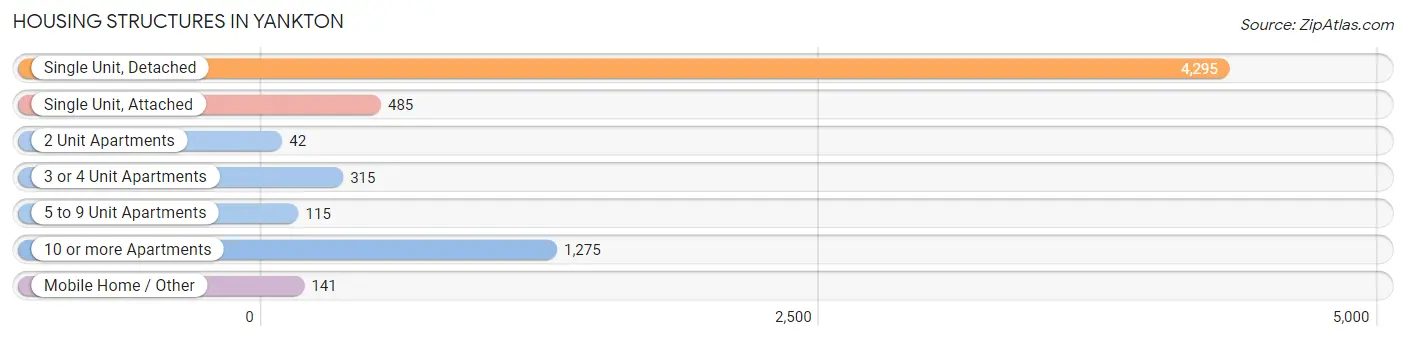
| Structure Type | # Housing Units | % Housing Units |
| Single Unit, Detached | 4,295 | 64.4% |
| Single Unit, Attached | 485 | 7.3% |
| 2 Unit Apartments | 42 | 0.6% |
| 3 or 4 Unit Apartments | 315 | 4.7% |
| 5 to 9 Unit Apartments | 115 | 1.7% |
| 10 or more Apartments | 1,275 | 19.1% |
| Mobile Home / Other | 141 | 2.1% |
| Total | 6,668 | 100.0% |
Housing Structures by Occupancy in Yankton
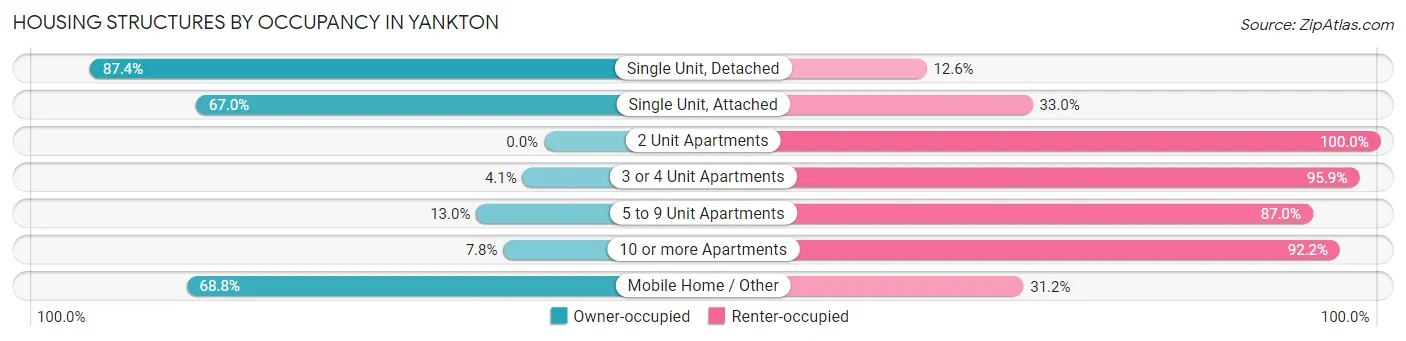
| Structure Type | Owner-occupied | Renter-occupied |
| Single Unit, Detached | 3,755 (87.4%) | 540 (12.6%) |
| Single Unit, Attached | 325 (67.0%) | 160 (33.0%) |
| 2 Unit Apartments | 0 (0.0%) | 42 (100.0%) |
| 3 or 4 Unit Apartments | 13 (4.1%) | 302 (95.9%) |
| 5 to 9 Unit Apartments | 15 (13.0%) | 100 (87.0%) |
| 10 or more Apartments | 100 (7.8%) | 1,175 (92.2%) |
| Mobile Home / Other | 97 (68.8%) | 44 (31.2%) |
| Total | 4,305 (64.6%) | 2,363 (35.4%) |
Housing Structures by Number of Rooms in Yankton
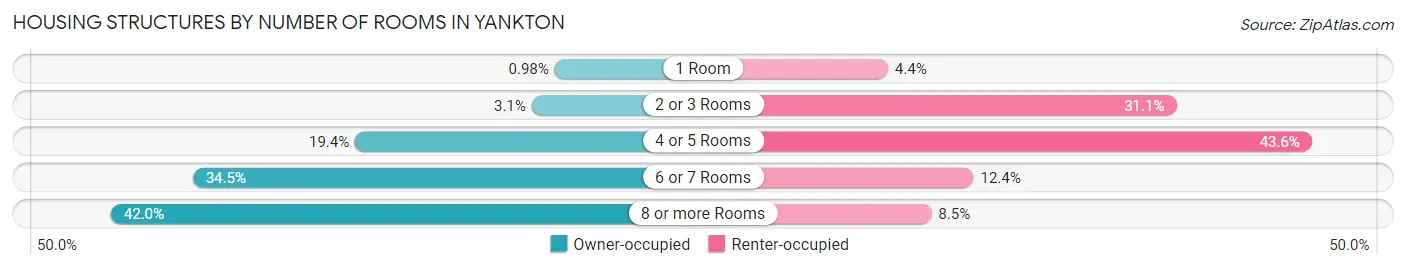
| Number of Rooms | Owner-occupied | Renter-occupied |
| 1 Room | 42 (1.0%) | 105 (4.4%) |
| 2 or 3 Rooms | 134 (3.1%) | 735 (31.1%) |
| 4 or 5 Rooms | 837 (19.4%) | 1,031 (43.6%) |
| 6 or 7 Rooms | 1,483 (34.4%) | 292 (12.4%) |
| 8 or more Rooms | 1,809 (42.0%) | 200 (8.5%) |
| Total | 4,305 (100.0%) | 2,363 (100.0%) |
Housing Structure by Heating Type in Yankton
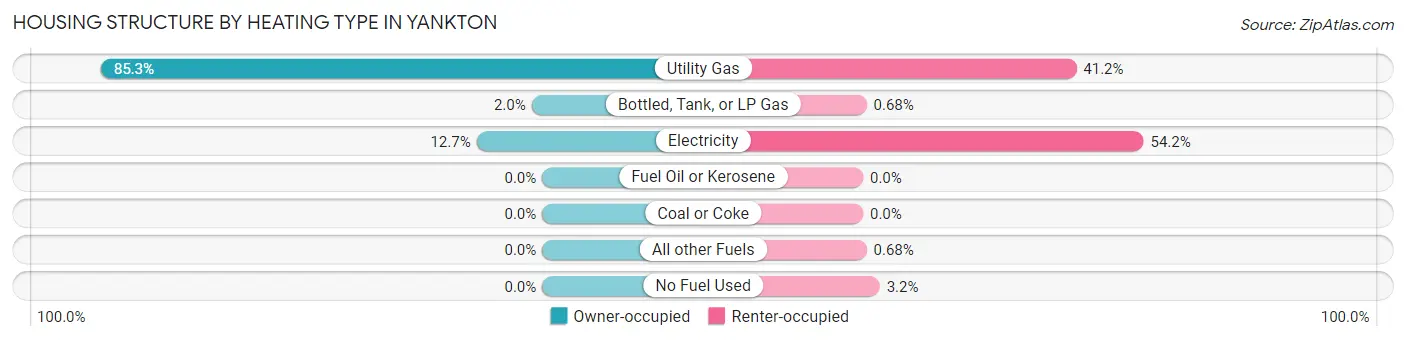
| Heating Type | Owner-occupied | Renter-occupied |
| Utility Gas | 3,671 (85.3%) | 974 (41.2%) |
| Bottled, Tank, or LP Gas | 88 (2.0%) | 16 (0.7%) |
| Electricity | 546 (12.7%) | 1,281 (54.2%) |
| Fuel Oil or Kerosene | 0 (0.0%) | 0 (0.0%) |
| Coal or Coke | 0 (0.0%) | 0 (0.0%) |
| All other Fuels | 0 (0.0%) | 16 (0.7%) |
| No Fuel Used | 0 (0.0%) | 76 (3.2%) |
| Total | 4,305 (100.0%) | 2,363 (100.0%) |
Household Vehicle Usage in Yankton
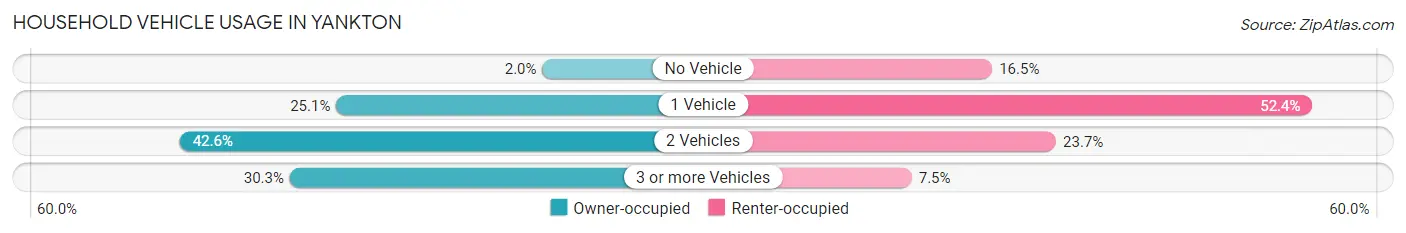
| Vehicles per Household | Owner-occupied | Renter-occupied |
| No Vehicle | 86 (2.0%) | 390 (16.5%) |
| 1 Vehicle | 1,080 (25.1%) | 1,237 (52.3%) |
| 2 Vehicles | 1,835 (42.6%) | 559 (23.7%) |
| 3 or more Vehicles | 1,304 (30.3%) | 177 (7.5%) |
| Total | 4,305 (100.0%) | 2,363 (100.0%) |
Real Estate & Mortgages in Yankton
Real Estate and Mortgage Overview in Yankton
| Characteristic | Without Mortgage | With Mortgage |
| Housing Units | 2,012 | 2,293 |
| Median Property Value | $183,400 | $197,900 |
| Median Household Income | $54,367 | $427 |
| Monthly Housing Costs | $499 | $46 |
| Real Estate Taxes | $2,204 | $27 |
Property Value by Mortgage Status in Yankton
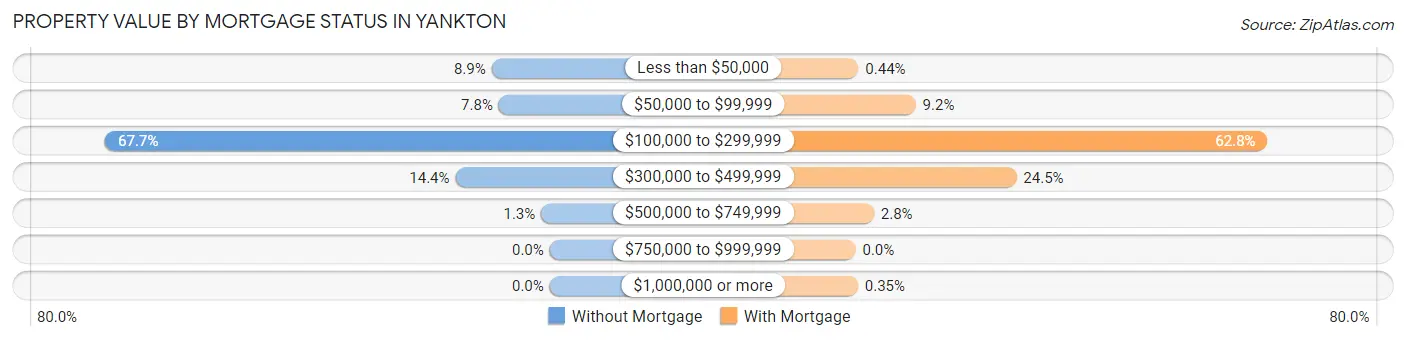
| Property Value | Without Mortgage | With Mortgage |
| Less than $50,000 | 178 (8.8%) | 10 (0.4%) |
| $50,000 to $99,999 | 156 (7.7%) | 210 (9.2%) |
| $100,000 to $299,999 | 1,363 (67.7%) | 1,439 (62.8%) |
| $300,000 to $499,999 | 289 (14.4%) | 562 (24.5%) |
| $500,000 to $749,999 | 26 (1.3%) | 64 (2.8%) |
| $750,000 to $999,999 | 0 (0.0%) | 0 (0.0%) |
| $1,000,000 or more | 0 (0.0%) | 8 (0.4%) |
| Total | 2,012 (100.0%) | 2,293 (100.0%) |
Household Income by Mortgage Status in Yankton
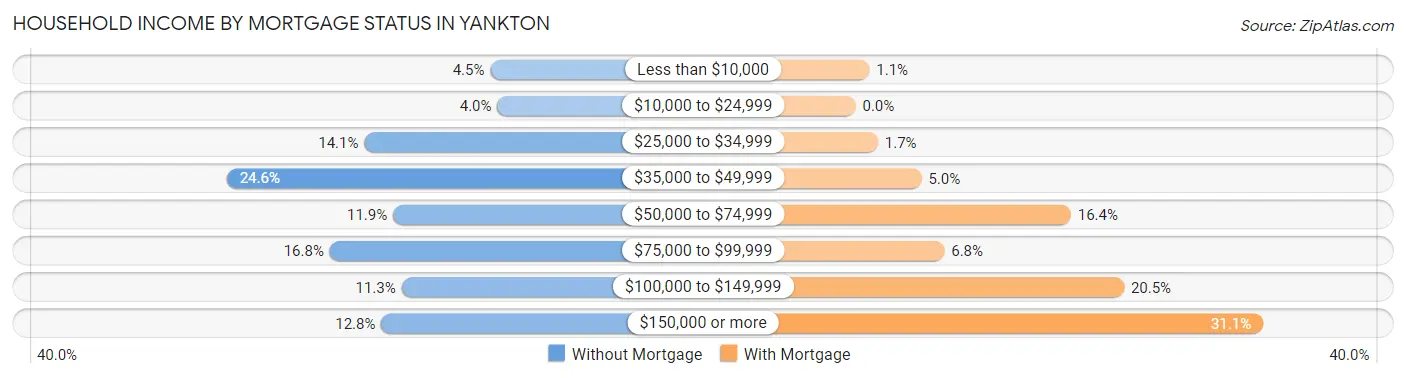
| Household Income | Without Mortgage | With Mortgage |
| Less than $10,000 | 91 (4.5%) | 24 (1.1%) |
| $10,000 to $24,999 | 80 (4.0%) | 0 (0.0%) |
| $25,000 to $34,999 | 284 (14.1%) | 39 (1.7%) |
| $35,000 to $49,999 | 495 (24.6%) | 115 (5.0%) |
| $50,000 to $74,999 | 240 (11.9%) | 376 (16.4%) |
| $75,000 to $99,999 | 337 (16.8%) | 155 (6.8%) |
| $100,000 to $149,999 | 227 (11.3%) | 469 (20.4%) |
| $150,000 or more | 258 (12.8%) | 712 (31.0%) |
| Total | 2,012 (100.0%) | 2,293 (100.0%) |
Property Value to Household Income Ratio in Yankton
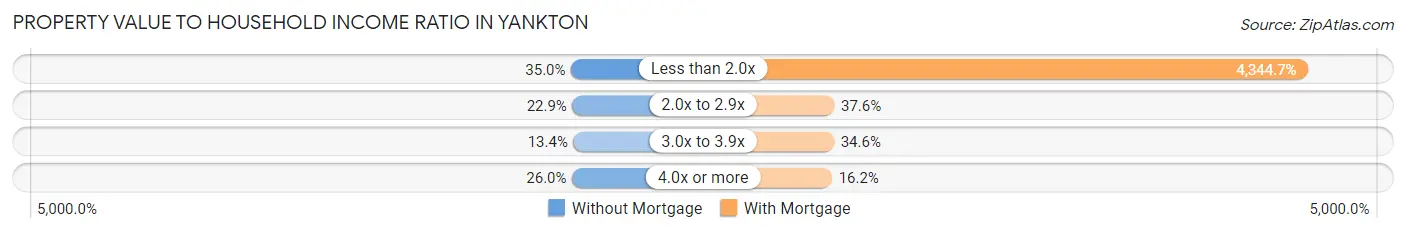
| Value-to-Income Ratio | Without Mortgage | With Mortgage |
| Less than 2.0x | 704 (35.0%) | 99,625 (4,344.7%) |
| 2.0x to 2.9x | 461 (22.9%) | 863 (37.6%) |
| 3.0x to 3.9x | 270 (13.4%) | 793 (34.6%) |
| 4.0x or more | 524 (26.0%) | 371 (16.2%) |
| Total | 2,012 (100.0%) | 2,293 (100.0%) |
Real Estate Taxes by Mortgage Status in Yankton
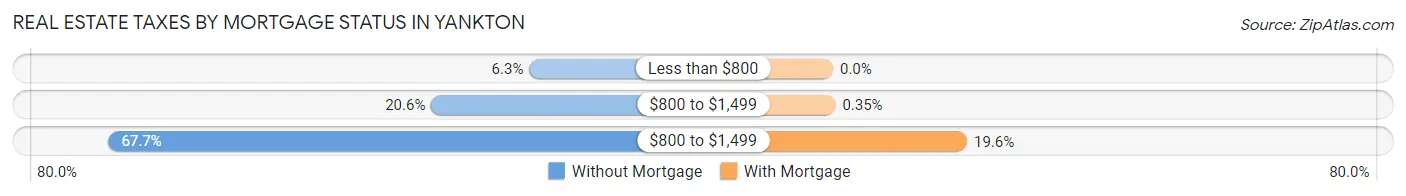
| Property Taxes | Without Mortgage | With Mortgage |
| Less than $800 | 126 (6.3%) | 0 (0.0%) |
| $800 to $1,499 | 414 (20.6%) | 8 (0.4%) |
| $800 to $1,499 | 1,363 (67.7%) | 449 (19.6%) |
| Total | 2,012 (100.0%) | 2,293 (100.0%) |
Health & Disability in Yankton
Health Insurance Coverage by Age in Yankton
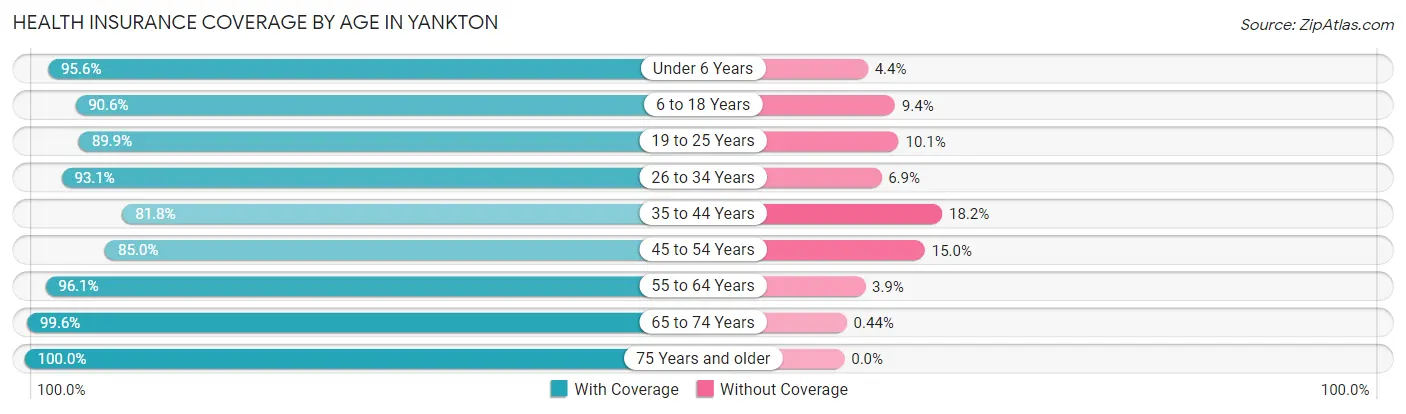
| Age Bracket | With Coverage | Without Coverage |
| Under 6 Years | 897 (95.6%) | 41 (4.4%) |
| 6 to 18 Years | 2,246 (90.6%) | 234 (9.4%) |
| 19 to 25 Years | 1,368 (89.9%) | 154 (10.1%) |
| 26 to 34 Years | 1,475 (93.1%) | 109 (6.9%) |
| 35 to 44 Years | 1,417 (81.8%) | 316 (18.2%) |
| 45 to 54 Years | 1,342 (85.0%) | 237 (15.0%) |
| 55 to 64 Years | 1,690 (96.1%) | 68 (3.9%) |
| 65 to 74 Years | 1,583 (99.6%) | 7 (0.4%) |
| 75 Years and older | 1,428 (100.0%) | 0 (0.0%) |
| Total | 13,446 (92.0%) | 1,166 (8.0%) |
Health Insurance Coverage by Citizenship Status in Yankton
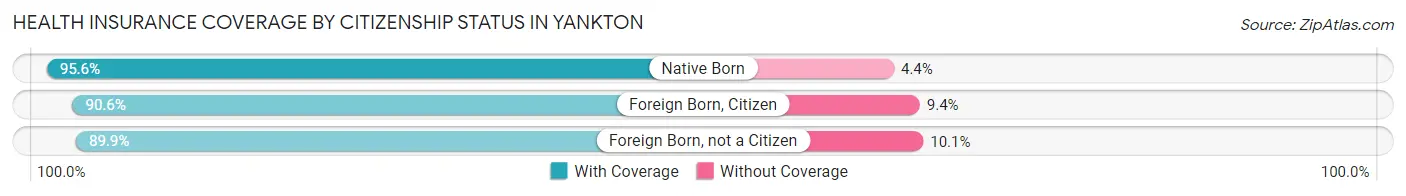
| Citizenship Status | With Coverage | Without Coverage |
| Native Born | 897 (95.6%) | 41 (4.4%) |
| Foreign Born, Citizen | 2,246 (90.6%) | 234 (9.4%) |
| Foreign Born, not a Citizen | 1,368 (89.9%) | 154 (10.1%) |
Health Insurance Coverage by Household Income in Yankton
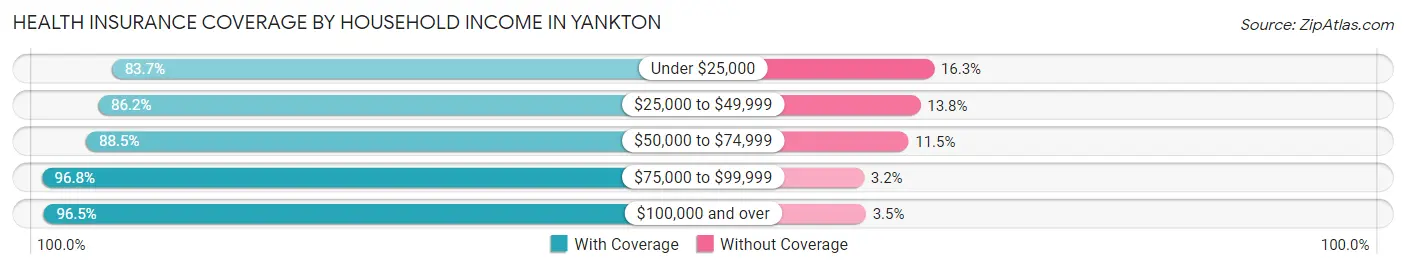
| Household Income | With Coverage | Without Coverage |
| Under $25,000 | 835 (83.7%) | 163 (16.3%) |
| $25,000 to $49,999 | 2,649 (86.2%) | 423 (13.8%) |
| $50,000 to $74,999 | 2,012 (88.5%) | 262 (11.5%) |
| $75,000 to $99,999 | 2,330 (96.8%) | 77 (3.2%) |
| $100,000 and over | 5,207 (96.5%) | 191 (3.5%) |
Public vs Private Health Insurance Coverage by Age in Yankton
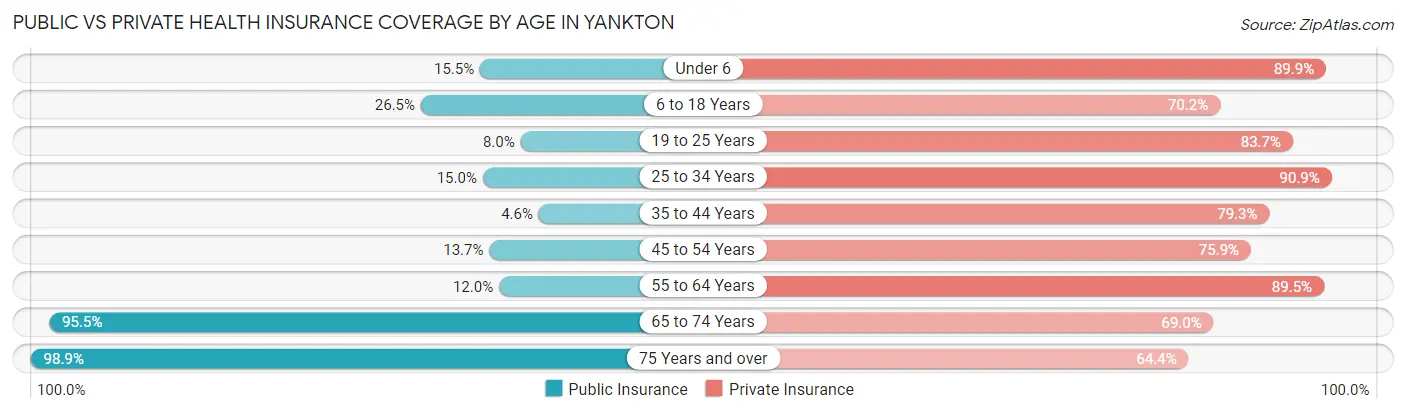
| Age Bracket | Public Insurance | Private Insurance |
| Under 6 | 145 (15.5%) | 843 (89.9%) |
| 6 to 18 Years | 656 (26.5%) | 1,741 (70.2%) |
| 19 to 25 Years | 121 (8.0%) | 1,274 (83.7%) |
| 25 to 34 Years | 237 (15.0%) | 1,440 (90.9%) |
| 35 to 44 Years | 79 (4.6%) | 1,375 (79.3%) |
| 45 to 54 Years | 217 (13.7%) | 1,199 (75.9%) |
| 55 to 64 Years | 210 (11.9%) | 1,573 (89.5%) |
| 65 to 74 Years | 1,518 (95.5%) | 1,097 (69.0%) |
| 75 Years and over | 1,412 (98.9%) | 919 (64.4%) |
| Total | 4,595 (31.5%) | 11,461 (78.4%) |
Disability Status by Sex by Age in Yankton
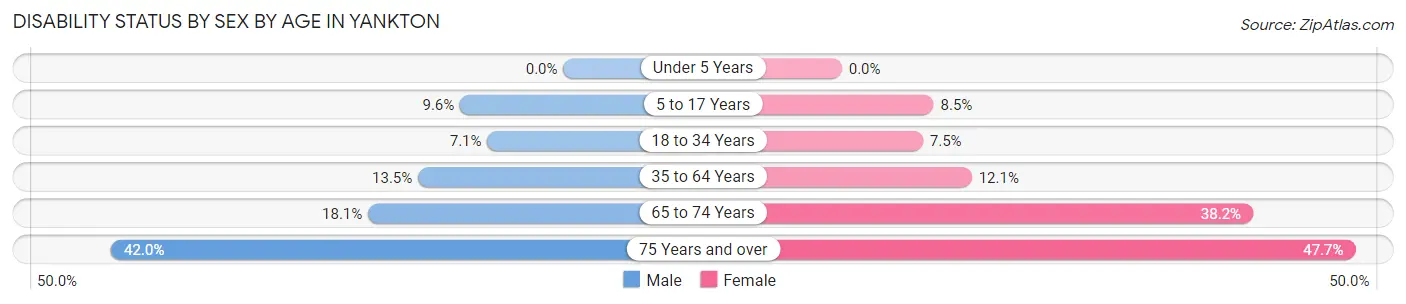
| Age Bracket | Male | Female |
| Under 5 Years | 0 (0.0%) | 0 (0.0%) |
| 5 to 17 Years | 120 (9.6%) | 95 (8.5%) |
| 18 to 34 Years | 127 (7.0%) | 114 (7.5%) |
| 35 to 64 Years | 327 (13.5%) | 319 (12.1%) |
| 65 to 74 Years | 139 (18.1%) | 314 (38.2%) |
| 75 Years and over | 233 (42.0%) | 416 (47.6%) |
Disability Class by Sex by Age in Yankton
Disability Class: Hearing Difficulty
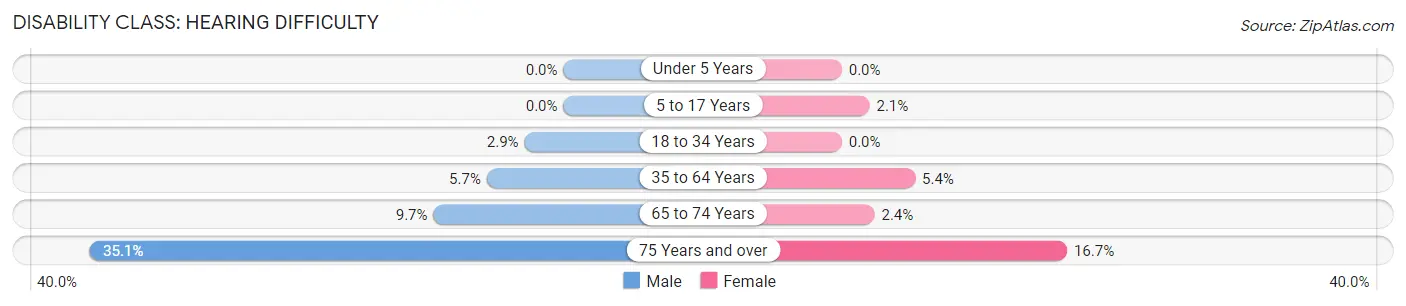
| Age Bracket | Male | Female |
| Under 5 Years | 0 (0.0%) | 0 (0.0%) |
| 5 to 17 Years | 0 (0.0%) | 23 (2.1%) |
| 18 to 34 Years | 52 (2.9%) | 0 (0.0%) |
| 35 to 64 Years | 138 (5.7%) | 144 (5.4%) |
| 65 to 74 Years | 74 (9.7%) | 20 (2.4%) |
| 75 Years and over | 195 (35.1%) | 146 (16.7%) |
Disability Class: Vision Difficulty
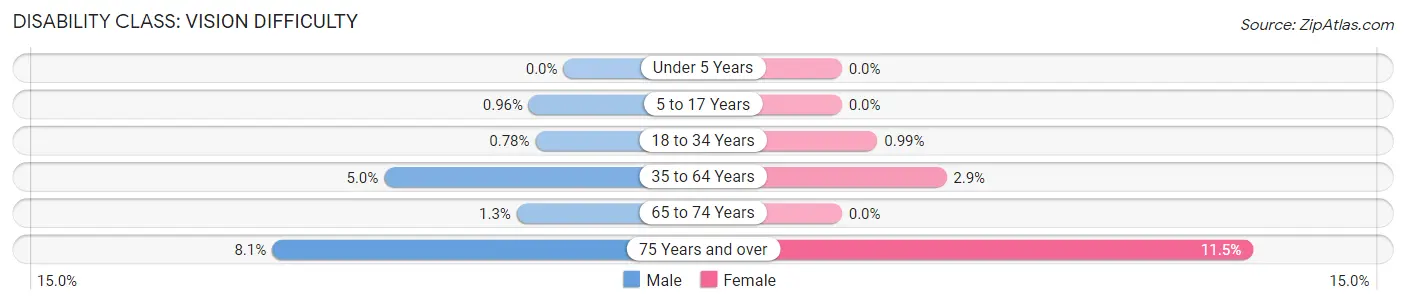
| Age Bracket | Male | Female |
| Under 5 Years | 0 (0.0%) | 0 (0.0%) |
| 5 to 17 Years | 12 (1.0%) | 0 (0.0%) |
| 18 to 34 Years | 14 (0.8%) | 15 (1.0%) |
| 35 to 64 Years | 121 (5.0%) | 77 (2.9%) |
| 65 to 74 Years | 10 (1.3%) | 0 (0.0%) |
| 75 Years and over | 45 (8.1%) | 100 (11.5%) |
Disability Class: Cognitive Difficulty
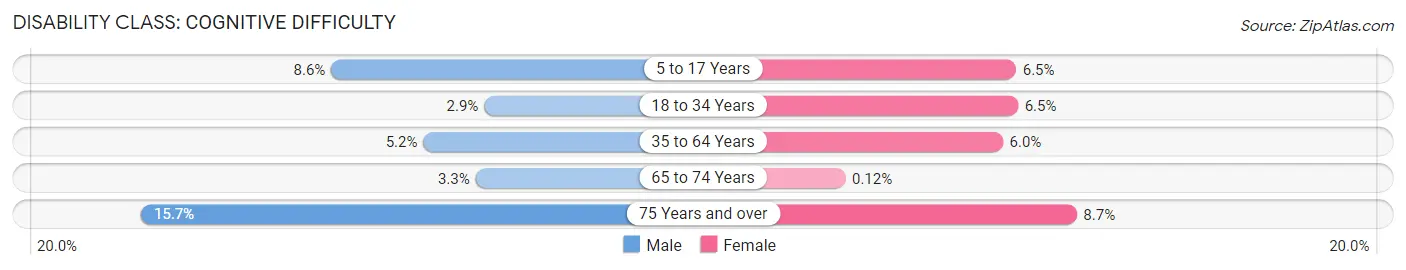
| Age Bracket | Male | Female |
| 5 to 17 Years | 108 (8.6%) | 72 (6.5%) |
| 18 to 34 Years | 53 (2.9%) | 99 (6.5%) |
| 35 to 64 Years | 126 (5.2%) | 158 (6.0%) |
| 65 to 74 Years | 25 (3.3%) | 1 (0.1%) |
| 75 Years and over | 87 (15.7%) | 76 (8.7%) |
Disability Class: Ambulatory Difficulty
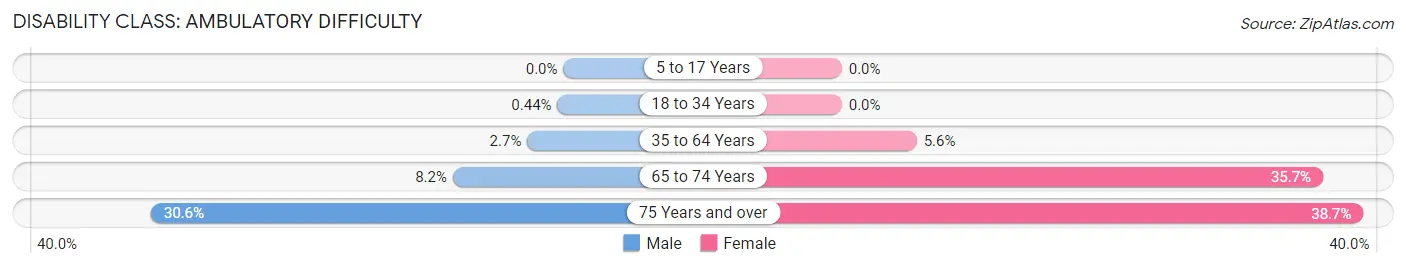
| Age Bracket | Male | Female |
| 5 to 17 Years | 0 (0.0%) | 0 (0.0%) |
| 18 to 34 Years | 8 (0.4%) | 0 (0.0%) |
| 35 to 64 Years | 65 (2.7%) | 147 (5.6%) |
| 65 to 74 Years | 63 (8.2%) | 294 (35.7%) |
| 75 Years and over | 170 (30.6%) | 338 (38.7%) |
Disability Class: Self-Care Difficulty
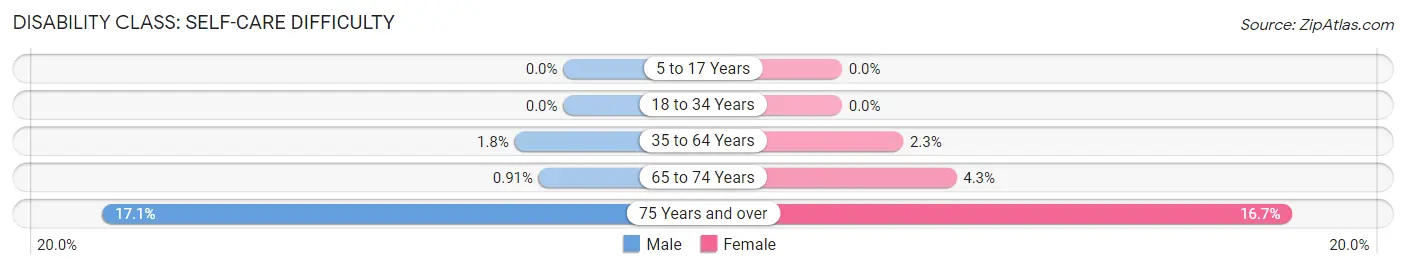
| Age Bracket | Male | Female |
| 5 to 17 Years | 0 (0.0%) | 0 (0.0%) |
| 18 to 34 Years | 0 (0.0%) | 0 (0.0%) |
| 35 to 64 Years | 44 (1.8%) | 60 (2.3%) |
| 65 to 74 Years | 7 (0.9%) | 35 (4.3%) |
| 75 Years and over | 95 (17.1%) | 146 (16.7%) |
Technology Access in Yankton
Computing Device Access in Yankton
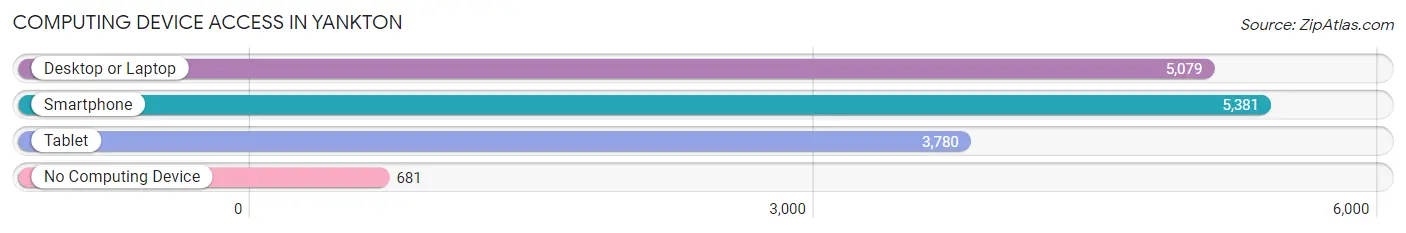
| Device Type | # Households | % Households |
| Desktop or Laptop | 5,079 | 76.2% |
| Smartphone | 5,381 | 80.7% |
| Tablet | 3,780 | 56.7% |
| No Computing Device | 681 | 10.2% |
| Total | 6,668 | 100.0% |
Internet Access in Yankton
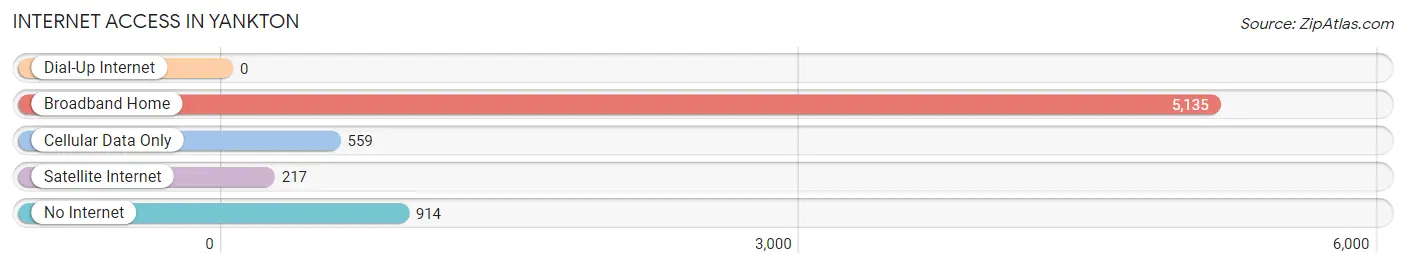
| Internet Type | # Households | % Households |
| Dial-Up Internet | 0 | 0.0% |
| Broadband Home | 5,135 | 77.0% |
| Cellular Data Only | 559 | 8.4% |
| Satellite Internet | 217 | 3.3% |
| No Internet | 914 | 13.7% |
| Total | 6,668 | 100.0% |
Yankton Summary
Yankton, South Dakota is a city located in the southeastern corner of the state, along the Missouri River. It is the county seat of Yankton County and the principal city of the Yankton Micropolitan Statistical Area. The population of Yankton was 14,454 at the 2010 census, making it the fourth largest city in South Dakota.
History
Yankton was founded in 1859 by the Yankton Sioux Tribe, who had been living in the area for centuries. The city was named after Chief Yankton, a leader of the tribe. The city was incorporated in 1881 and became the county seat of Yankton County in 1883.
Yankton was an important trading post for the Sioux and other Native American tribes in the area. It was also a major stop on the Lewis and Clark Expedition, which passed through the area in 1804.
In the late 19th century, Yankton became an important transportation hub, with the construction of the Yankton and Vermillion Railroad in 1879. The railroad connected Yankton to Sioux City, Iowa, and allowed for the transportation of goods and people between the two cities.
In the early 20th century, Yankton was a major center for the lumber industry. The city was home to several sawmills and lumber yards, and the lumber industry was a major employer in the area.
Geography
Yankton is located in the southeastern corner of South Dakota, along the Missouri River. It is situated at the intersection of Interstate 29 and U.S. Route 81. The city is located approximately 60 miles north of Sioux Falls and 120 miles south of Pierre.
The city has a total area of 8.3 square miles, of which 8.2 square miles is land and 0.1 square miles is water. The city is located in a hilly region, with the highest point being the summit of Yankton Hill, which is located just south of the city.
Economy
Yankton’s economy is largely based on agriculture, manufacturing, and tourism. The city is home to several manufacturing companies, including a Tyson Foods plant, a John Deere plant, and a 3M plant.
Agriculture is also an important part of the local economy. The city is home to several large farms, and the surrounding area is known for its production of corn, soybeans, and wheat.
Tourism is also an important part of the local economy. Yankton is home to several attractions, including the Lewis and Clark Recreation Area, the Yankton Riverfront Park, and the Yankton Trail State Park.
Demographics
As of the 2010 census, the population of Yankton was 14,454. The racial makeup of the city was 94.2% White, 1.2% African American, 0.7% Native American, 0.7% Asian, 0.1% Pacific Islander, 1.3% from other races, and 1.9% from two or more races. Hispanic or Latino of any race were 3.2% of the population.
The median income for a household in Yankton was $41,945, and the median income for a family was $50,945. The per capita income for the city was $20,945. About 8.2% of families and 10.7% of the population were below the poverty line, including 14.2% of those under age 18 and 8.2% of those age 65 or over.
Common Questions
What is the Total Population of Yankton?
Total Population of Yankton is 15,421.
What is the Total Male Population of Yankton?
Total Male Population of Yankton is 7,925.
What is the Total Female Population of Yankton?
Total Female Population of Yankton is 7,496.
What is the Ratio of Males per 100 Females in Yankton?
There are 105.72 Males per 100 Females in Yankton.
What is the Ratio of Females per 100 Males in Yankton?
There are 94.59 Females per 100 Males in Yankton.
What is the Median Population Age in Yankton?
Median Population Age in Yankton is 39.9 Years.
What is the Average Family Size in Yankton
Average Family Size in Yankton is 2.9 People.
What is the Average Household Size in Yankton
Average Household Size in Yankton is 2.1 People.
What is Per Capita Income in Yankton?
Per Capita income in Yankton is $36,680.
What is the Median Family Income in Yankton?
Median Family Income in Yankton is $87,760.
What is the Median Household income in Yankton?
Median Household Income in Yankton is $60,180.
What is Income or Wage Gap in Yankton?
Income or Wage Gap in Yankton is 21.3%.
Women in Yankton earn 78.7 cents for every dollar earned by a man.
What is Inequality or Gini Index in Yankton?
Inequality or Gini Index in Yankton is 0.44.
How Large is the Labor Force in Yankton?
There are 7,859 People in the Labor Forcein in Yankton.
What is the Percentage of People in the Labor Force in Yankton?
62.3% of People are in the Labor Force in Yankton.
What is the Unemployment Rate in Yankton?
Unemployment Rate in Yankton is 1.1%.