Immigrants from Saudi Arabia vs Bangladeshi Married-Couple Family Poverty

COMPARE

Immigrants from Saudi Arabia
Race
Ancestry
AfghanAfricanAlaska NativeAlaskan AthabascanAlbanianAleutAlsatianAmericanApacheArabArapahoArgentineanArmenianAssyrian/Chaldean/SyriacAustralianAustrianBahamianBarbadianBasqueBelgianBelizeanBermudanBhutaneseBlackfeetBolivianBrazilianBritishBritish West IndianBulgarianBurmeseCajunCambodianCanadianCape VerdeanCarpatho RusynCelticCentral AmericanCentral American IndianCherokeeCheyenneChickasawChileanChineseChippewaChoctawColombianColvilleComancheCosta RicanCreeCreekCroatianCrowCubanCypriotCzechCzechoslovakianDanishDelawareDominicanDutchDutch West IndianEastern EuropeanEcuadorianEgyptianEnglishEstonianEthiopianEuropeanFijianFilipinoFinnishFrenchFrench American IndianFrench CanadianGermanGerman RussianGhanaianGreekGuamanian/ChamorroGuatemalanGuyaneseHaitianHmongHonduranHopiHoumaHungarianIcelanderIndian (Asian)IndonesianInupiatIranianIraqiIrishIroquoisIsraeliItalianJamaicanJapaneseJordanianKenyanKiowaKoreanLaotianLatvianLebaneseLiberianLithuanianLumbeeLuxembourgerMacedonianMalaysianMalteseMarshalleseMenomineeMexicanMexican American IndianMongolianMoroccanNative HawaiianNavajoNepaleseNew ZealanderNicaraguanNigerianNorthern EuropeanNorwegianOkinawanOsageOttawaPaiutePakistaniPalestinianPanamanianParaguayanPennsylvania GermanPeruvianPimaPolishPortuguesePotawatomiPuebloPuerto RicanPuget Sound SalishRomanianRussianSalvadoranSamoanScandinavianScotch-IrishScottishSeminoleSenegaleseSerbianShoshoneSierra LeoneanSiouxSlavicSlovakSloveneSomaliSouth AfricanSouth AmericanSouth American IndianSoviet UnionSpaniardSpanishSpanish AmericanSpanish American IndianSri LankanSubsaharan AfricanSudaneseSwedishSwissSyrianTaiwaneseThaiTlingit-HaidaTohono O'OdhamTonganTrinidadian and TobagonianTsimshianTurkishU.S. Virgin IslanderUgandanUkrainianUruguayanUteVenezuelanVietnameseWelshWest IndianYakamaYaquiYugoslavianYumanYup'ikZimbabwean
Immigration
NonimmigrantsImmigrantsAfghanistanAfricaAlbaniaArgentinaArmeniaAsiaAustraliaAustriaBahamasBangladeshBarbadosBelarusBelgiumBelizeBoliviaBosnia and HerzegovinaBrazilBulgariaBurma/MyanmarCabo VerdeCambodiaCameroonCanadaCaribbeanCentral AmericaChileChinaColombiaCongoCosta RicaCroatiaCubaCzechoslovakiaDenmarkDominicaDominican RepublicEastern AfricaEastern AsiaEastern EuropeEcuadorEgyptEl SalvadorEnglandEritreaEthiopiaEuropeFijiFranceGermanyGhanaGreeceGrenadaGuatemalaGuyanaHaitiHondurasHong KongHungaryIndiaIndonesiaIranIraqIrelandIsraelItalyJamaicaJapanJordanKazakhstanKenyaKoreaKuwaitLaosLatin AmericaLatviaLebanonLiberiaLithuaniaMalaysiaMexicoMicronesiaMiddle AfricaMoldovaMoroccoNepalNetherlandsNicaraguaNigeriaNorth AmericaNorth MacedoniaNorthern AfricaNorthern EuropeNorwayOceaniaPakistanPanamaPeruPhilippinesPolandPortugalRomaniaRussiaSaudi ArabiaScotlandSenegalSerbiaSierra LeoneSingaporeSomaliaSouth AfricaSouth AmericaSouth Central AsiaSouth Eastern AsiaSouthern EuropeSpainSri LankaSt. Vincent and the GrenadinesSudanSwedenSwitzerlandSyriaTaiwanThailandTrinidad and TobagoTurkeyUgandaUkraineUruguayUzbekistanVenezuelaVietnamWest IndiesWestern AfricaWestern AsiaWestern EuropeYemenZaireZimbabweAzores
Bangladeshi
Race
Ancestry
AfghanAfricanAlaska NativeAlaskan AthabascanAlbanianAleutAlsatianAmericanApacheArabArapahoArgentineanArmenianAssyrian/Chaldean/SyriacAustralianAustrianBahamianBangladeshiBarbadianBasqueBelgianBelizeanBermudanBhutaneseBlackfeetBolivianBrazilianBritishBritish West IndianBulgarianBurmeseCajunCambodianCanadianCape VerdeanCarpatho RusynCelticCentral AmericanCentral American IndianCherokeeCheyenneChickasawChileanChineseChippewaChoctawColombianColvilleComancheCosta RicanCreeCreekCroatianCrowCubanCypriotCzechCzechoslovakianDanishDelawareDominicanDutchDutch West IndianEastern EuropeanEcuadorianEgyptianEnglishEstonianEthiopianEuropeanFijianFilipinoFinnishFrenchFrench American IndianFrench CanadianGermanGerman RussianGhanaianGreekGuamanian/ChamorroGuatemalanGuyaneseHaitianHmongHonduranHopiHoumaHungarianIcelanderIndian (Asian)IndonesianInupiatIranianIraqiIrishIroquoisIsraeliItalianJamaicanJapaneseJordanianKenyanKiowaKoreanLaotianLatvianLebaneseLiberianLithuanianLumbeeLuxembourgerMacedonianMalaysianMalteseMarshalleseMenomineeMexicanMexican American IndianMongolianMoroccanNative HawaiianNavajoNepaleseNew ZealanderNicaraguanNigerianNorthern EuropeanNorwegianOkinawanOsageOttawaPaiutePakistaniPalestinianPanamanianParaguayanPennsylvania GermanPeruvianPimaPolishPortuguesePotawatomiPuebloPuerto RicanPuget Sound SalishRomanianRussianSalvadoranSamoanScandinavianScotch-IrishScottishSeminoleSenegaleseSerbianShoshoneSierra LeoneanSiouxSlavicSlovakSloveneSomaliSouth AfricanSouth AmericanSouth American IndianSoviet UnionSpaniardSpanishSpanish AmericanSpanish American IndianSri LankanSubsaharan AfricanSudaneseSwedishSwissSyrianTaiwaneseThaiTlingit-HaidaTohono O'OdhamTonganTrinidadian and TobagonianTsimshianTurkishU.S. Virgin IslanderUgandanUkrainianUruguayanUteVenezuelanVietnameseWelshWest IndianYakamaYaquiYugoslavianYumanYup'ikZimbabwean
Immigration
NonimmigrantsImmigrantsAfghanistanAfricaAlbaniaArgentinaArmeniaAsiaAustraliaAustriaBahamasBangladeshBarbadosBelarusBelgiumBelizeBoliviaBosnia and HerzegovinaBrazilBulgariaBurma/MyanmarCabo VerdeCambodiaCameroonCanadaCaribbeanCentral AmericaChileChinaColombiaCongoCosta RicaCroatiaCubaCzechoslovakiaDenmarkDominicaDominican RepublicEastern AfricaEastern AsiaEastern EuropeEcuadorEgyptEl SalvadorEnglandEritreaEthiopiaEuropeFijiFranceGermanyGhanaGreeceGrenadaGuatemalaGuyanaHaitiHondurasHong KongHungaryIndiaIndonesiaIranIraqIrelandIsraelItalyJamaicaJapanJordanKazakhstanKenyaKoreaKuwaitLaosLatin AmericaLatviaLebanonLiberiaLithuaniaMalaysiaMexicoMicronesiaMiddle AfricaMoldovaMoroccoNepalNetherlandsNicaraguaNigeriaNorth AmericaNorth MacedoniaNorthern AfricaNorthern EuropeNorwayOceaniaPakistanPanamaPeruPhilippinesPolandPortugalRomaniaRussiaScotlandSenegalSerbiaSierra LeoneSingaporeSomaliaSouth AfricaSouth AmericaSouth Central AsiaSouth Eastern AsiaSouthern EuropeSpainSri LankaSt. Vincent and the GrenadinesSudanSwedenSwitzerlandSyriaTaiwanThailandTrinidad and TobagoTurkeyUgandaUkraineUruguayUzbekistanVenezuelaVietnamWest IndiesWestern AfricaWestern AsiaWestern EuropeYemenZaireZimbabweAzores
Married-Couple Family Poverty
Income
Poverty
Unemployment
Labor Participation
Family Structure
Vehicle Availability
Education Level
Disability

Married-Couple Family Poverty Comparison

Immigrants from Saudi Arabia

Bangladeshis

Good
Tragic
5.1%
MARRIED-COUPLE FAMILY POVERTY
70.3/ 100
METRIC RATING
159th/ 347
METRIC RANK
6.0%
MARRIED-COUPLE FAMILY POVERTY
0.5/ 100
METRIC RATING
256th/ 347
METRIC RANK

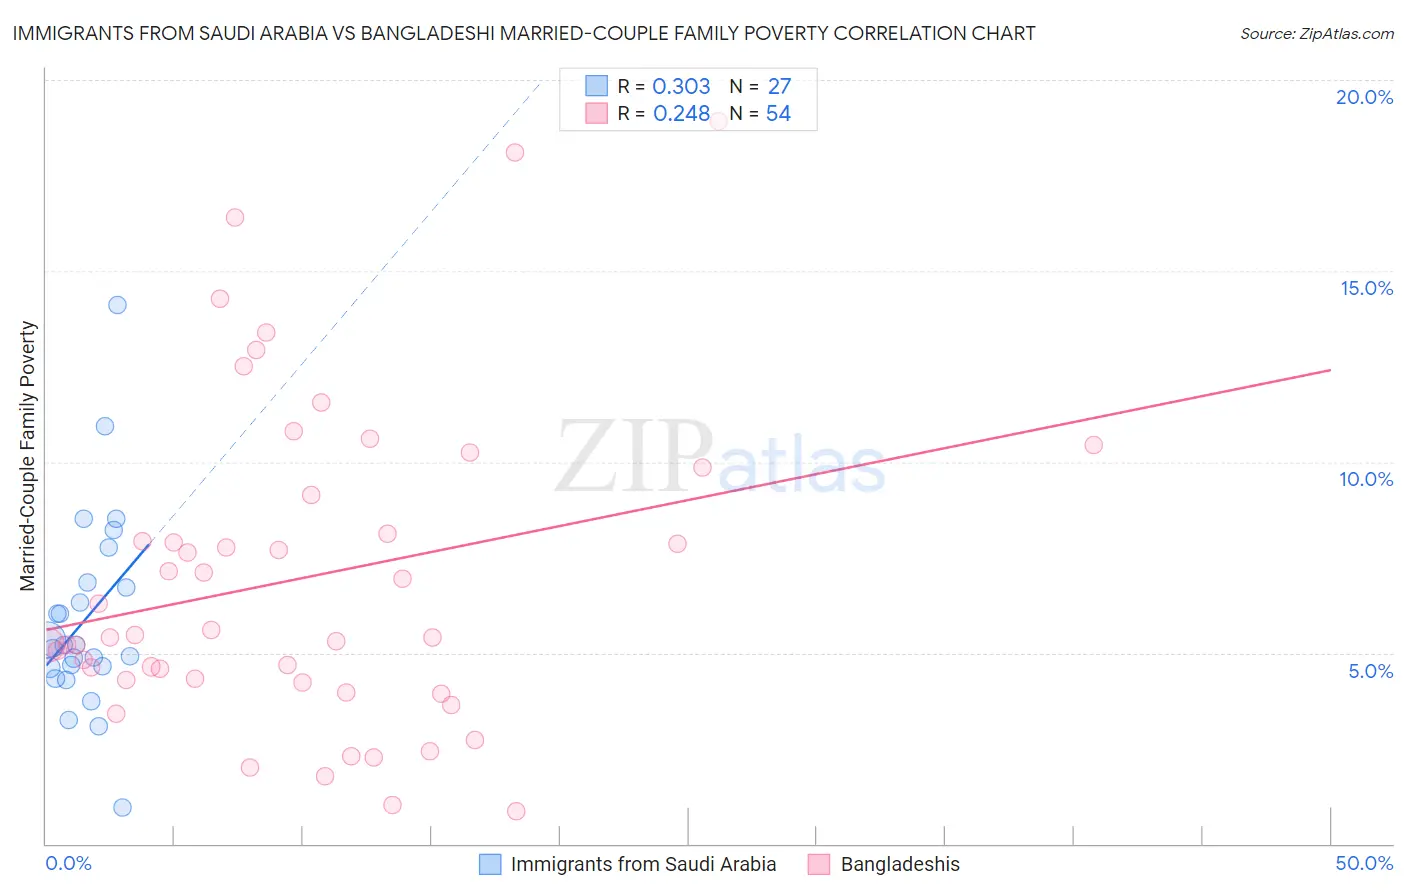
Immigrants from Saudi Arabia vs Bangladeshi Married-Couple Family Poverty Correlation Chart

The statistical analysis conducted on geographies consisting of 163,790,795 people shows a mild positive correlation between the proportion of Immigrants from Saudi Arabia and poverty level among married-couple families in the United States with a correlation coefficient (R) of 0.303 and weighted average of 5.1%. Similarly, the statistical analysis conducted on geographies consisting of 140,885,862 people shows a weak positive correlation between the proportion of Bangladeshis and poverty level among married-couple families in the United States with a correlation coefficient (R) of 0.248 and weighted average of 6.0%, a difference of 18.1%.
Immigrants from Saudi Arabia vs Bangladeshi Married-Couple Family Poverty

Married-Couple Family Poverty Correlation Summary

MeasurementImmigrants from Saudi ArabiaBangladeshi
Minimum0.95%0.85%
Maximum14.1%18.9%
Range13.2%18.1%
Mean5.9%7.0%
Median5.2%5.4%
Interquartile 25% (IQ1)4.6%4.3%
Interquartile 75% (IQ3)6.8%9.1%
Interquartile Range (IQR)2.2%4.9%
Standard Deviation (Sample)2.6%4.2%
Standard Deviation (Population)2.6%4.2%

Similar Demographics by Married-Couple Family Poverty

Demographics Similar to Immigrants from Saudi Arabia by Married-Couple Family Poverty

In terms of married-couple family poverty, the demographic groups most similar to Immigrants from Saudi Arabia are Immigrants from South Eastern Asia (5.1%, a difference of 0.0%), Argentinean (5.1%, a difference of 0.050%), Pennsylvania German (5.1%, a difference of 0.26%), Sri Lankan (5.1%, a difference of 0.27%), and Immigrants from Ethiopia (5.1%, a difference of 0.31%).
DemographicsRating | RankMarried-Couple Family Poverty
Albanians
77.2
/100
|
#152
Good
5.0%
Immigrants | Kuwait
76.3
/100
|
#153
Good
5.0%
Delaware
73.7
/100
|
#154
Good
5.1%
Immigrants | Ethiopia
72.4
/100
|
#155
Good
5.1%
Sri Lankans
72.2
/100
|
#156
Good
5.1%
Argentineans
70.7
/100
|
#157
Good
5.1%
Immigrants | South Eastern Asia
70.4
/100
|
#158
Good
5.1%
Immigrants | Saudi Arabia
70.3
/100
|
#159
Good
5.1%
Pennsylvania Germans
68.5
/100
|
#160
Good
5.1%
Ethiopians
68.1
/100
|
#161
Good
5.1%
Immigrants | Jordan
66.5
/100
|
#162
Good
5.1%
Sierra Leoneans
64.1
/100
|
#163
Good
5.1%
Hawaiians
62.3
/100
|
#164
Good
5.1%
Immigrants | Malaysia
62.2
/100
|
#165
Good
5.1%
Paraguayans
61.5
/100
|
#166
Good
5.1%

Demographics Similar to Bangladeshis by Married-Couple Family Poverty

In terms of married-couple family poverty, the demographic groups most similar to Bangladeshis are Immigrants from Burma/Myanmar (6.0%, a difference of 0.24%), Immigrants (6.0%, a difference of 0.37%), Comanche (6.0%, a difference of 0.50%), Immigrants from Somalia (6.0%, a difference of 0.65%), and African (6.0%, a difference of 0.71%).
DemographicsRating | RankMarried-Couple Family Poverty
Tsimshian
1.1
/100
|
#249
Tragic
5.9%
Immigrants | Eritrea
1.1
/100
|
#250
Tragic
5.9%
Immigrants | Ghana
1.0
/100
|
#251
Tragic
5.9%
Immigrants | Western Asia
0.7
/100
|
#252
Tragic
6.0%
Africans
0.7
/100
|
#253
Tragic
6.0%
Immigrants | Somalia
0.7
/100
|
#254
Tragic
6.0%
Comanche
0.7
/100
|
#255
Tragic
6.0%
Bangladeshis
0.5
/100
|
#256
Tragic
6.0%
Immigrants | Burma/Myanmar
0.5
/100
|
#257
Tragic
6.0%
Immigrants | Immigrants
0.5
/100
|
#258
Tragic
6.0%
Alaskan Athabascans
0.4
/100
|
#259
Tragic
6.1%
Jamaicans
0.3
/100
|
#260
Tragic
6.1%
Senegalese
0.3
/100
|
#261
Tragic
6.1%
Shoshone
0.3
/100
|
#262
Tragic
6.1%
Immigrants | Senegal
0.3
/100
|
#263
Tragic
6.1%