Zip Codes with the Highest Percentage of Households with Income Below $10,000 in Mckeesport, PA
RELATED REPORTS & OPTIONS
Household Income | $0-10k
Mckeesport
Compare Zip Codes
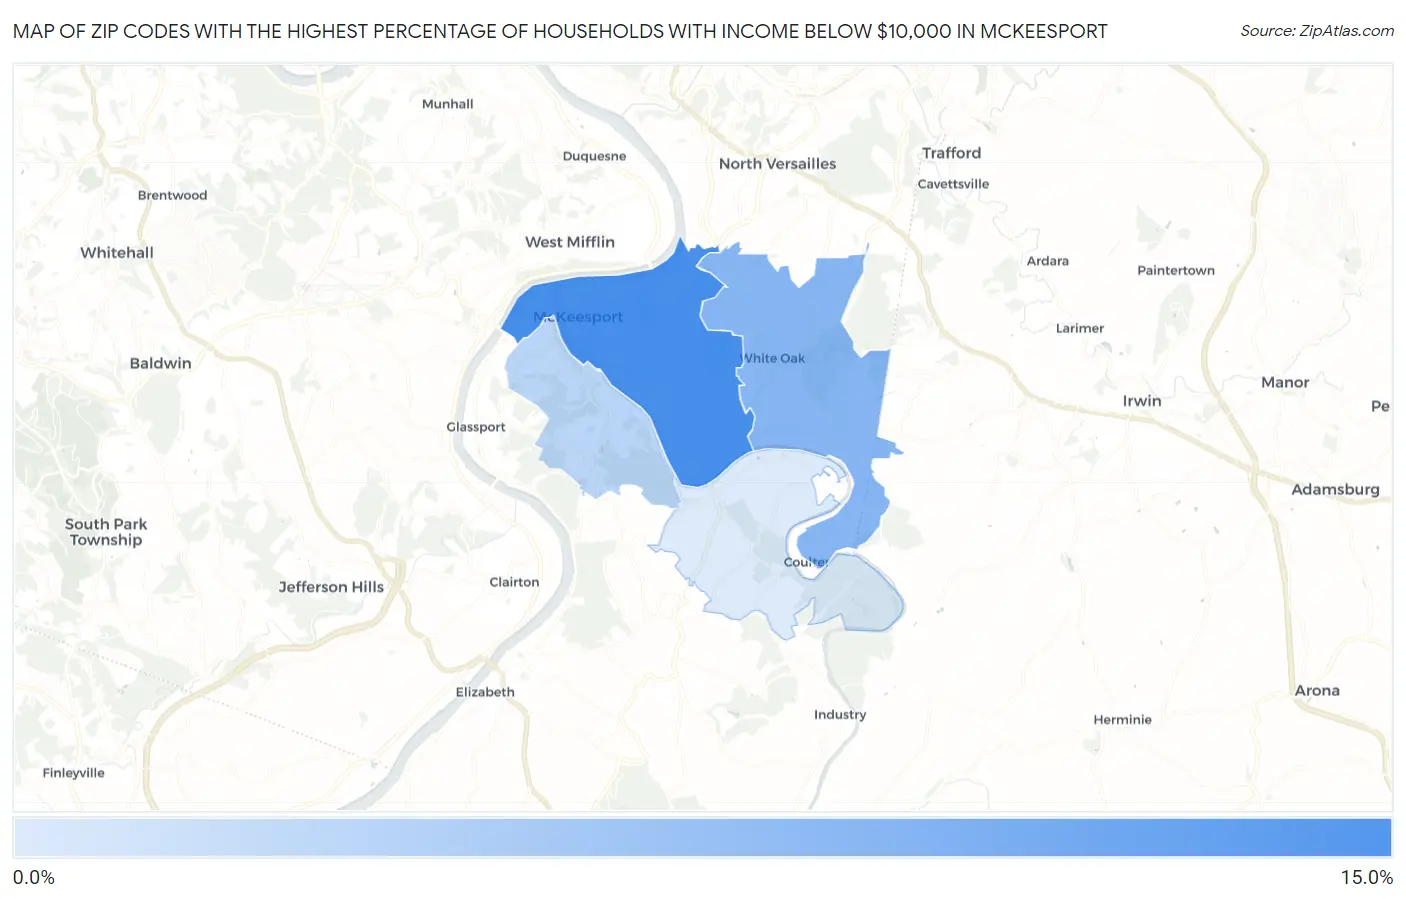
Map of Zip Codes with the Highest Percentage of Households with Income Below $10,000 in Mckeesport
0.0%
15.0%
Zip Codes with the Highest Percentage of Households with Income Below $10,000 in Mckeesport, PA
| Zip Code | Households with Income < $10k | vs State | vs National | |
| 1. | 15132 | 10.8% | 4.8%(+6.00)#112 | 4.9%(+5.90)#3,063 |
| 2. | 15131 | 6.6% | 4.8%(+1.80)#302 | 4.9%(+1.70)#7,768 |
| 3. | 15133 | 3.2% | 4.8%(-1.60)#874 | 4.9%(-1.70)#18,656 |
| 4. | 15135 | 1.0% | 4.8%(-3.80)#1,380 | 4.9%(-3.90)#26,853 |
1
Common Questions
What are the Top 3 Zip Codes with the Highest Percentage of Households with Income Below $10,000 in Mckeesport, PA?
Top 3 Zip Codes with the Highest Percentage of Households with Income Below $10,000 in Mckeesport, PA are:
What zip code has the Highest Percentage of Households with Income Below $10,000 in Mckeesport, PA?
15132 has the Highest Percentage of Households with Income Below $10,000 in Mckeesport, PA with 10.8%.
What is the Percentage of Households with Income Below $10,000 in Mckeesport, PA?
Percentage of Households with Income Below $10,000 in Mckeesport is 11.4%.
What is the Percentage of Households with Income Below $10,000 in Pennsylvania?
Percentage of Households with Income Below $10,000 in Pennsylvania is 4.8%.
What is the Percentage of Households with Income Below $10,000 in the United States?
Percentage of Households with Income Below $10,000 in the United States is 4.9%.