Zip Codes with the Highest Percentage of Hispanic or Latino Population in Mckeesport, PA
RELATED REPORTS & OPTIONS
Hispanic or Latino
Mckeesport
Compare Zip Codes
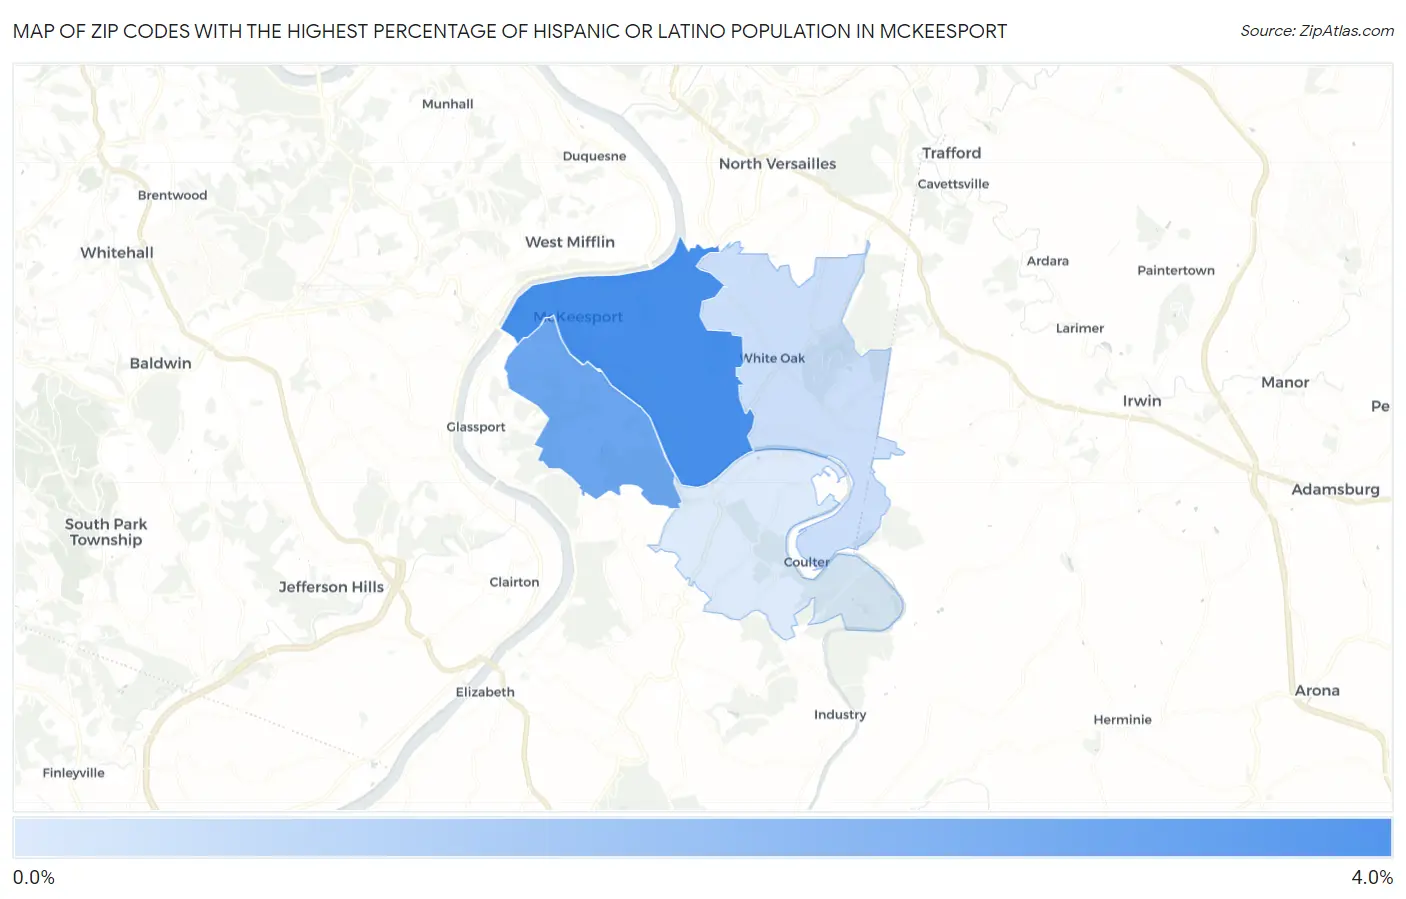
Map of Zip Codes with the Highest Percentage of Hispanic or Latino Population in Mckeesport
0.0%
4.0%
Zip Codes with the Highest Percentage of Hispanic or Latino Population in Mckeesport, PA
| Zip Code | Hispanic or Latino | vs State | vs National | |
| 1. | 15132 | 3.3% | 8.1%(-4.87)#555 | 18.7%(-15.4)#17,723 |
| 2. | 15133 | 2.5% | 8.1%(-5.60)#678 | 18.7%(-16.1)#19,601 |
| 3. | 15131 | 0.74% | 8.1%(-7.39)#1,114 | 18.7%(-17.9)#24,955 |
| 4. | 15135 | 0.38% | 8.1%(-7.74)#1,203 | 18.7%(-18.3)#26,142 |
1
Common Questions
What are the Top 3 Zip Codes with the Highest Percentage of Hispanic or Latino Population in Mckeesport, PA?
Top 3 Zip Codes with the Highest Percentage of Hispanic or Latino Population in Mckeesport, PA are:
What zip code has the Highest Percentage of Hispanic or Latino Population in Mckeesport, PA?
15132 has the Highest Percentage of Hispanic or Latino Population in Mckeesport, PA with 3.3%.
What is the Percentage of Hispanic or Latino Population in Mckeesport, PA?
Percentage of Hispanic or Latino Population in Mckeesport is 3.5%.
What is the Percentage of Hispanic or Latino Population in Pennsylvania?
Percentage of Hispanic or Latino Population in Pennsylvania is 8.1%.
What is the Percentage of Hispanic or Latino Population in the United States?
Percentage of Hispanic or Latino Population in the United States is 18.7%.