Zip Codes with the Highest Percentage of Population Employed in Architecture & Engineering in Hazleton, PA
RELATED REPORTS & OPTIONS
Architecture & Engineering
Hazleton
Compare Zip Codes
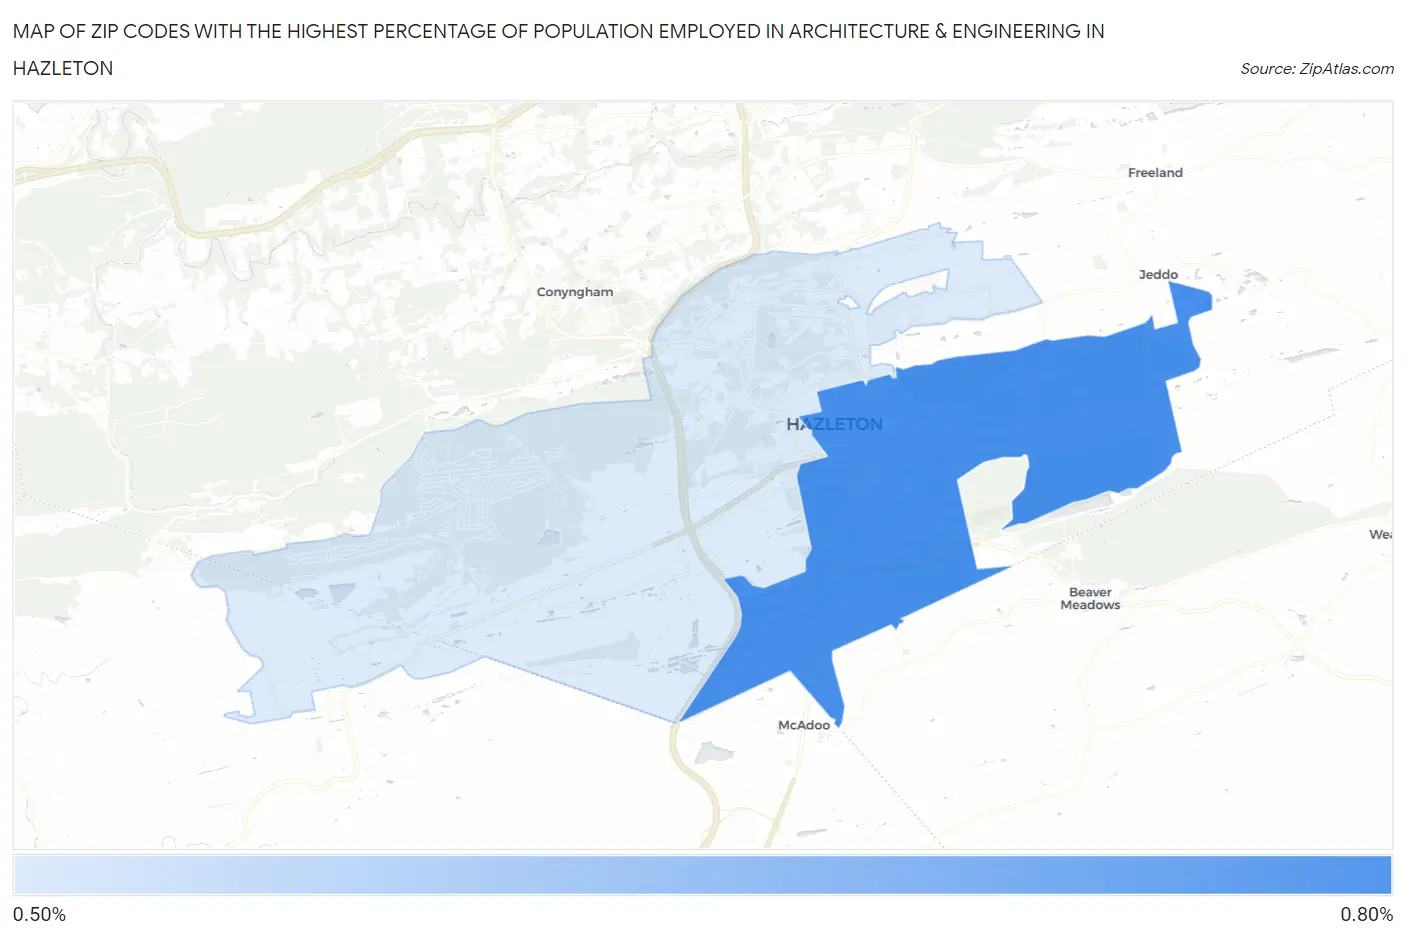
Map of Zip Codes with the Highest Percentage of Population Employed in Architecture & Engineering in Hazleton
0.0%
0.80%
Zip Codes with the Highest Percentage of Population Employed in Architecture & Engineering in Hazleton, PA
| Zip Code | % Employed | vs State | vs National | |
| 1. | 18201 | 0.75% | 2.0%(-1.29)#1,062 | 2.1%(-1.40)#18,553 |
| 2. | 18202 | 0.54% | 2.0%(-1.50)#1,138 | 2.1%(-1.61)#20,017 |
1
Common Questions
What are the Top Zip Codes with the Highest Percentage of Population Employed in Architecture & Engineering in Hazleton, PA?
Top Zip Codes with the Highest Percentage of Population Employed in Architecture & Engineering in Hazleton, PA are:
What zip code has the Highest Percentage of Population Employed in Architecture & Engineering in Hazleton, PA?
18201 has the Highest Percentage of Population Employed in Architecture & Engineering in Hazleton, PA with 0.75%.
What is the Percentage of Population Employed in Architecture & Engineering in Hazleton, PA?
Percentage of Population Employed in Architecture & Engineering in Hazleton is 0.77%.
What is the Percentage of Population Employed in Architecture & Engineering in Pennsylvania?
Percentage of Population Employed in Architecture & Engineering in Pennsylvania is 2.0%.
What is the Percentage of Population Employed in Architecture & Engineering in the United States?
Percentage of Population Employed in Architecture & Engineering in the United States is 2.1%.