Zip Codes with the Highest Percentage of Population with a Degree in Liberal Arts and History in Florissant, MO
RELATED REPORTS & OPTIONS
Liberal Arts and History
Florissant
Compare Zip Codes
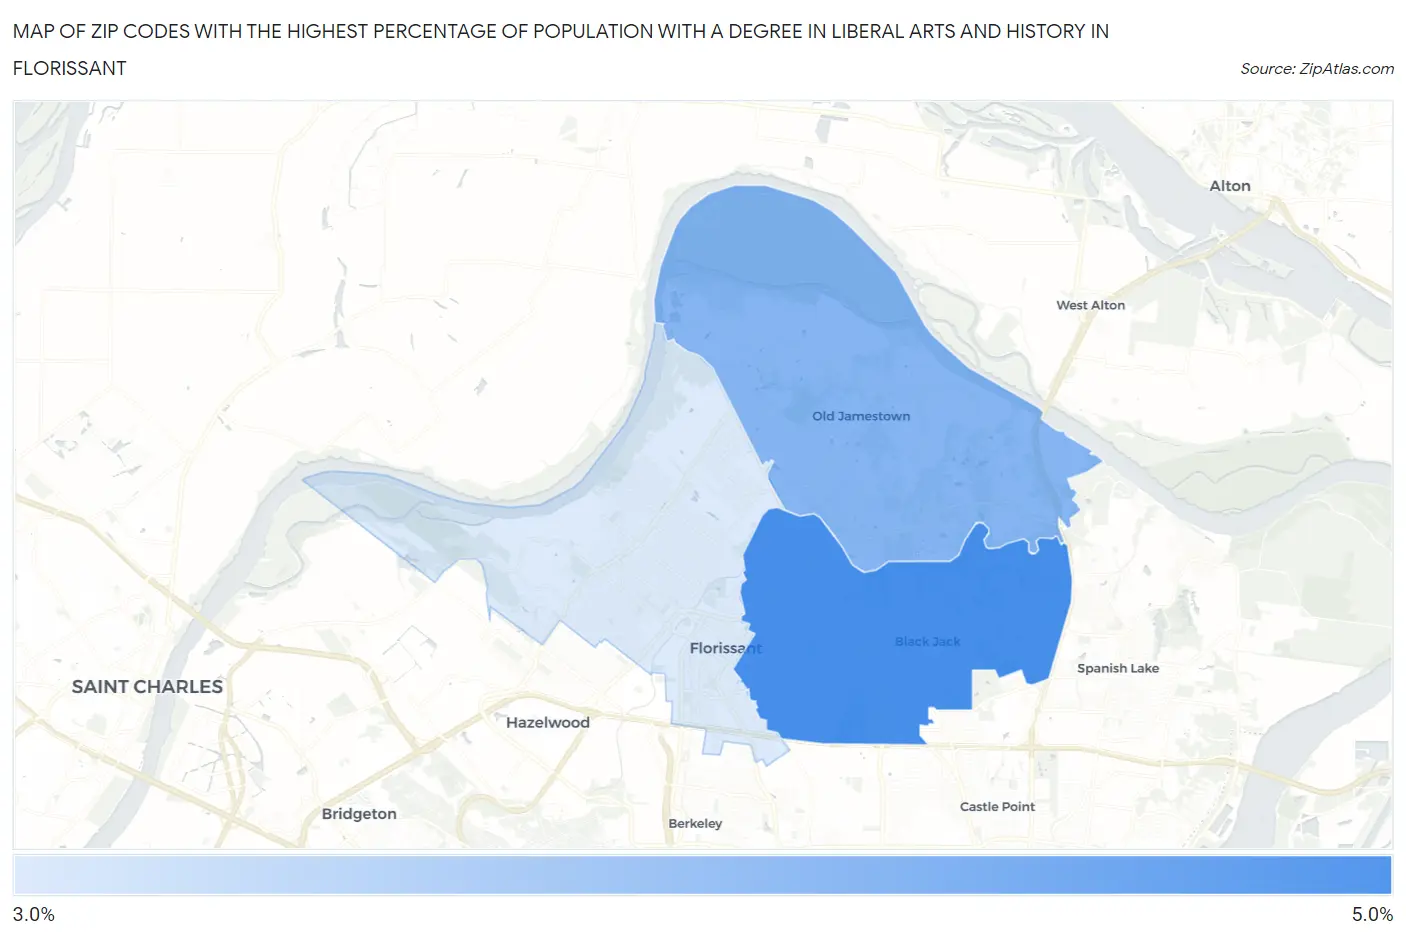
Map of Zip Codes with the Highest Percentage of Population with a Degree in Liberal Arts and History in Florissant
0.0%
5.0%
Zip Codes with the Highest Percentage of Population with a Degree in Liberal Arts and History in Florissant, MO
| Zip Code | % Graduates | vs State | vs National | |
| 1. | 63033 | 4.5% | 4.6%(-0.055)#326 | 4.9%(-0.357)#12,929 |
| 2. | 63034 | 4.2% | 4.6%(-0.418)#356 | 4.9%(-0.719)#14,204 |
| 3. | 63031 | 3.6% | 4.6%(-0.926)#414 | 4.9%(-1.23)#16,085 |
1
Common Questions
What are the Top Zip Codes with the Highest Percentage of Population with a Degree in Liberal Arts and History in Florissant, MO?
Top Zip Codes with the Highest Percentage of Population with a Degree in Liberal Arts and History in Florissant, MO are:
What zip code has the Highest Percentage of Population with a Degree in Liberal Arts and History in Florissant, MO?
63033 has the Highest Percentage of Population with a Degree in Liberal Arts and History in Florissant, MO with 4.5%.
What is the Percentage of Population with a Degree in Liberal Arts and History in Florissant, MO?
Percentage of Population with a Degree in Liberal Arts and History in Florissant is 4.8%.
What is the Percentage of Population with a Degree in Liberal Arts and History in Missouri?
Percentage of Population with a Degree in Liberal Arts and History in Missouri is 4.6%.
What is the Percentage of Population with a Degree in Liberal Arts and History in the United States?
Percentage of Population with a Degree in Liberal Arts and History in the United States is 4.9%.