Cree vs Filipino Wage/Income Gap
COMPARE
Cree
Filipino
Wage/Income Gap
Wage/Income Gap Comparison
Cree
Filipinos
24.5%
WAGE/INCOME GAP
95.6/ 100
METRIC RATING
120th/ 347
METRIC RANK
29.7%
WAGE/INCOME GAP
0.0/ 100
METRIC RATING
338th/ 347
METRIC RANK
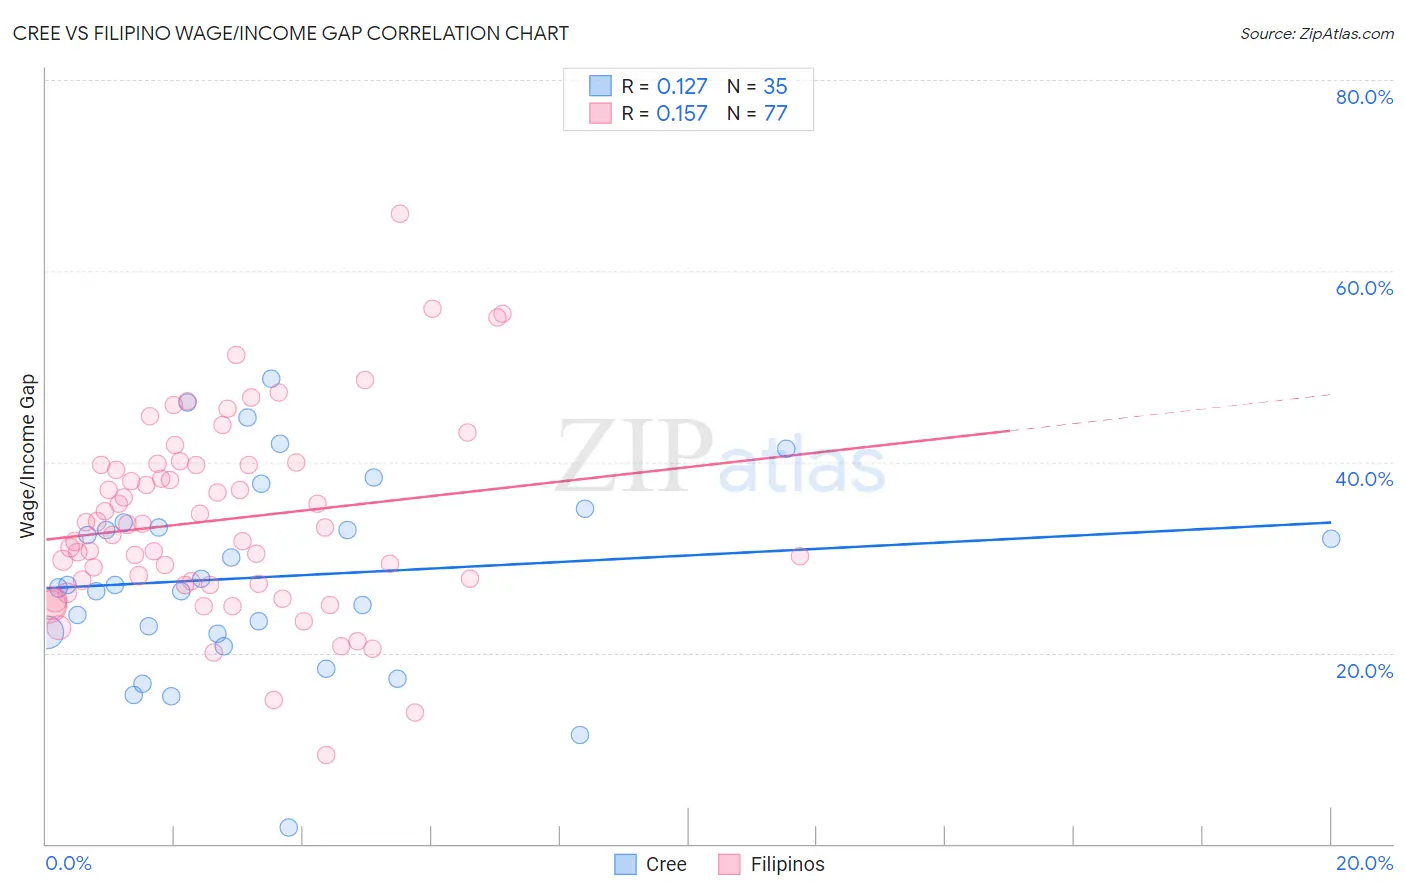
Cree vs Filipino Wage/Income Gap Correlation Chart
The statistical analysis conducted on geographies consisting of 76,178,665 people shows a poor positive correlation between the proportion of Cree and wage/income gap percentage in the United States with a correlation coefficient (R) of 0.127 and weighted average of 24.5%. Similarly, the statistical analysis conducted on geographies consisting of 254,305,942 people shows a poor positive correlation between the proportion of Filipinos and wage/income gap percentage in the United States with a correlation coefficient (R) of 0.157 and weighted average of 29.7%, a difference of 21.3%.
Wage/Income Gap Correlation Summary
| Measurement | Cree | Filipino |
| Minimum | 1.7% | 9.3% |
| Maximum | 48.7% | 66.0% |
| Range | 47.0% | 56.7% |
| Mean | 28.0% | 33.9% |
| Median | 27.1% | 33.2% |
| Interquartile 25% (IQ1) | 21.9% | 27.2% |
| Interquartile 75% (IQ3) | 33.6% | 39.7% |
| Interquartile Range (IQR) | 11.7% | 12.5% |
| Standard Deviation (Sample) | 10.3% | 10.1% |
| Standard Deviation (Population) | 10.2% | 10.1% |
Similar Demographics by Wage/Income Gap
Demographics Similar to Cree by Wage/Income Gap
In terms of wage/income gap, the demographic groups most similar to Cree are Kenyan (24.5%, a difference of 0.070%), Immigrants from Micronesia (24.4%, a difference of 0.090%), Immigrants from Afghanistan (24.4%, a difference of 0.13%), Alaska Native (24.4%, a difference of 0.19%), and Immigrants from Thailand (24.5%, a difference of 0.27%).
| Demographics | Rating | Rank | Wage/Income Gap |
| Sioux | 96.9 /100 | #113 | Exceptional 24.3% |
| Panamanians | 96.5 /100 | #114 | Exceptional 24.4% |
| Immigrants | Kenya | 96.4 /100 | #115 | Exceptional 24.4% |
| Alaska Natives | 96.0 /100 | #116 | Exceptional 24.4% |
| Immigrants | Afghanistan | 95.9 /100 | #117 | Exceptional 24.4% |
| Immigrants | Micronesia | 95.8 /100 | #118 | Exceptional 24.4% |
| Kenyans | 95.8 /100 | #119 | Exceptional 24.5% |
| Cree | 95.6 /100 | #120 | Exceptional 24.5% |
| Immigrants | Thailand | 94.9 /100 | #121 | Exceptional 24.5% |
| Apache | 94.8 /100 | #122 | Exceptional 24.5% |
| Natives/Alaskans | 94.6 /100 | #123 | Exceptional 24.6% |
| Immigrants | South America | 93.9 /100 | #124 | Exceptional 24.6% |
| Spanish Americans | 93.8 /100 | #125 | Exceptional 24.6% |
| Immigrants | Uruguay | 93.8 /100 | #126 | Exceptional 24.6% |
| German Russians | 93.7 /100 | #127 | Exceptional 24.6% |
Demographics Similar to Filipinos by Wage/Income Gap
In terms of wage/income gap, the demographic groups most similar to Filipinos are Iranian (29.7%, a difference of 0.060%), Dutch (29.6%, a difference of 0.22%), English (29.5%, a difference of 0.80%), Immigrants from Taiwan (29.5%, a difference of 0.81%), and Swiss (30.0%, a difference of 0.89%).
| Demographics | Rating | Rank | Wage/Income Gap |
| Czechs | 0.0 /100 | #331 | Tragic 29.2% |
| Immigrants | South Central Asia | 0.0 /100 | #332 | Tragic 29.3% |
| Europeans | 0.0 /100 | #333 | Tragic 29.4% |
| Swedes | 0.0 /100 | #334 | Tragic 29.4% |
| Immigrants | Taiwan | 0.0 /100 | #335 | Tragic 29.5% |
| English | 0.0 /100 | #336 | Tragic 29.5% |
| Dutch | 0.0 /100 | #337 | Tragic 29.6% |
| Filipinos | 0.0 /100 | #338 | Tragic 29.7% |
| Iranians | 0.0 /100 | #339 | Tragic 29.7% |
| Swiss | 0.0 /100 | #340 | Tragic 30.0% |
| Thais | 0.0 /100 | #341 | Tragic 30.5% |
| Pennsylvania Germans | 0.0 /100 | #342 | Tragic 30.7% |
| Danes | 0.0 /100 | #343 | Tragic 31.0% |
| Assyrians/Chaldeans/Syriacs | 0.0 /100 | #344 | Tragic 31.0% |
| Immigrants | India | 0.0 /100 | #345 | Tragic 31.5% |