Zip Codes with the Highest Percentage of Population Employed in Health Care & Social Assistance in Glenview, IL
RELATED REPORTS & OPTIONS
Health Care & Social Assistance
Glenview
Compare Zip Codes
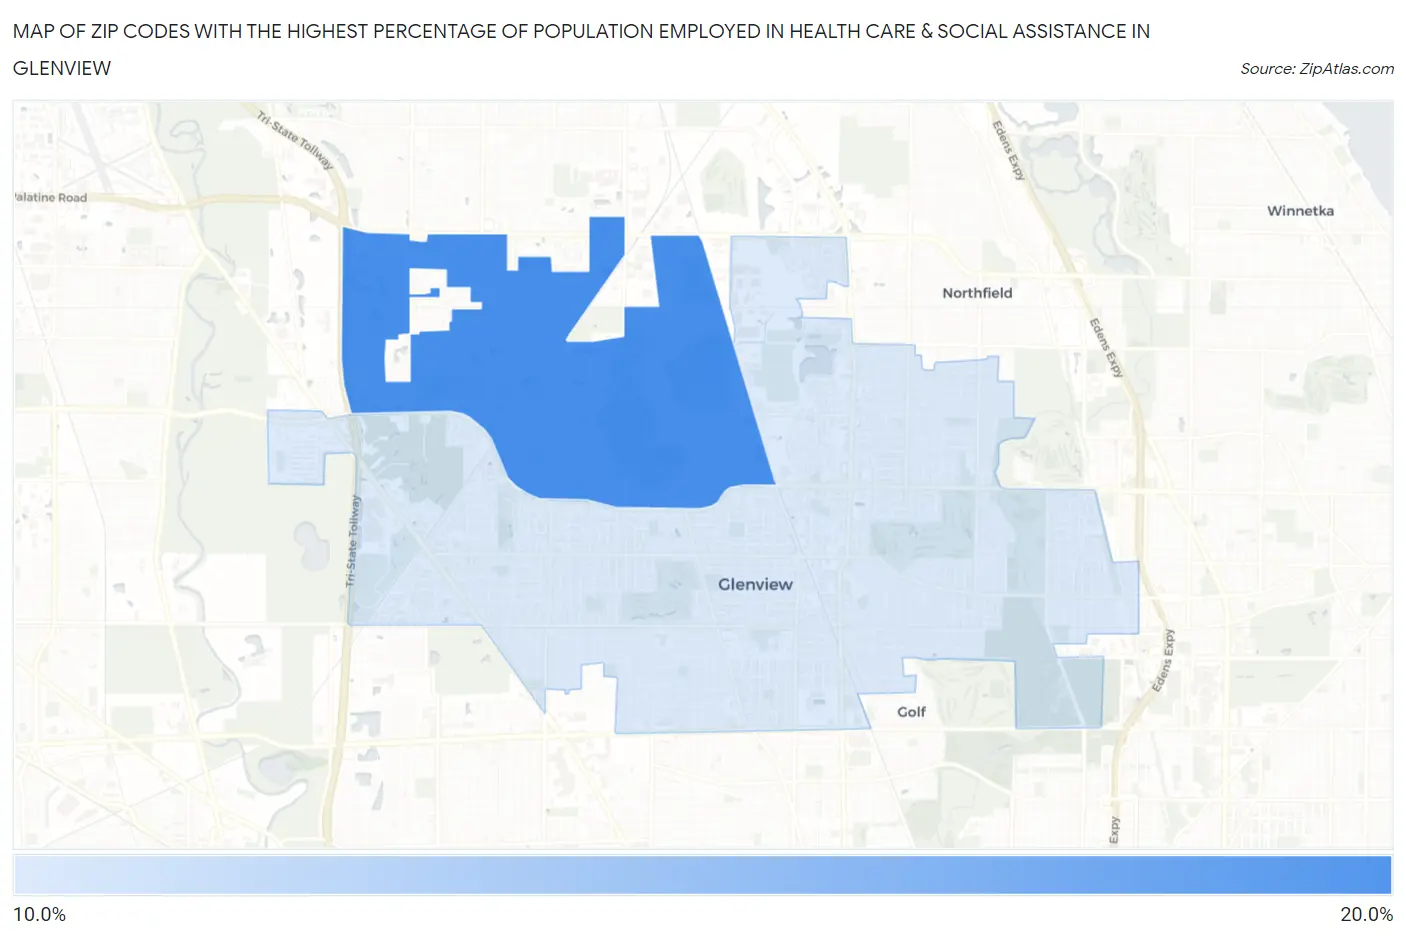
Map of Zip Codes with the Highest Percentage of Population Employed in Health Care & Social Assistance in Glenview
0.0%
20.0%
Zip Codes with the Highest Percentage of Population Employed in Health Care & Social Assistance in Glenview, IL
| Zip Code | % Employed | vs State | vs National | |
| 1. | 60026 | 15.6% | 13.8%(+1.87)#479 | 13.9%(+1.70)#10,229 |
| 2. | 60025 | 14.2% | 13.8%(+0.455)#618 | 13.9%(+0.285)#13,519 |
1
Common Questions
What are the Top Zip Codes with the Highest Percentage of Population Employed in Health Care & Social Assistance in Glenview, IL?
Top Zip Codes with the Highest Percentage of Population Employed in Health Care & Social Assistance in Glenview, IL are:
What zip code has the Highest Percentage of Population Employed in Health Care & Social Assistance in Glenview, IL?
60026 has the Highest Percentage of Population Employed in Health Care & Social Assistance in Glenview, IL with 15.6%.
What is the Percentage of Population Employed in Health Care & Social Assistance in Glenview, IL?
Percentage of Population Employed in Health Care & Social Assistance in Glenview is 14.4%.
What is the Percentage of Population Employed in Health Care & Social Assistance in Illinois?
Percentage of Population Employed in Health Care & Social Assistance in Illinois is 13.8%.
What is the Percentage of Population Employed in Health Care & Social Assistance in the United States?
Percentage of Population Employed in Health Care & Social Assistance in the United States is 13.9%.