Zip Codes with the Highest Percentage of White / Caucasian Population in Glenview, IL
RELATED REPORTS & OPTIONS
White / Caucasian
Glenview
Compare Zip Codes
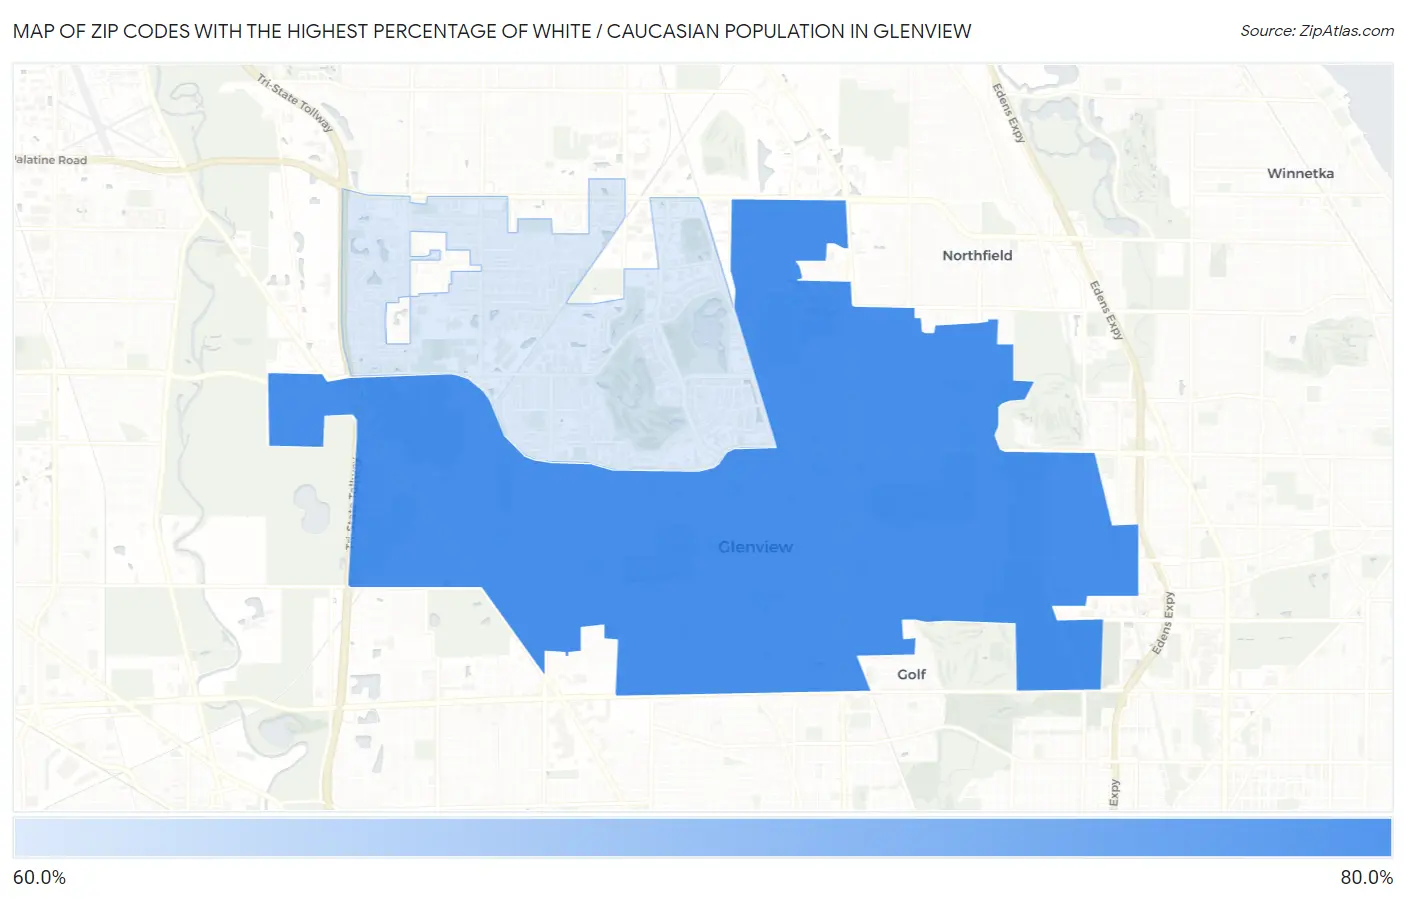
Map of Zip Codes with the Highest Percentage of White / Caucasian Population in Glenview
0.0%
80.0%
Zip Codes with the Highest Percentage of White / Caucasian Population in Glenview, IL
| Zip Code | White / Caucasian | vs State | vs National | |
| 1. | 60025 | 73.6% | 65.8%(+7.89)#1,129 | 65.9%(+7.77)#23,538 |
| 2. | 60026 | 66.1% | 65.8%(+0.379)#1,188 | 65.9%(+0.254)#25,798 |
1
Common Questions
What are the Top Zip Codes with the Highest Percentage of White / Caucasian Population in Glenview, IL?
Top Zip Codes with the Highest Percentage of White / Caucasian Population in Glenview, IL are:
What zip code has the Highest Percentage of White / Caucasian Population in Glenview, IL?
60025 has the Highest Percentage of White / Caucasian Population in Glenview, IL with 73.6%.
What is the Percentage of White / Caucasian Population in Glenview, IL?
Percentage of White / Caucasian Population in Glenview is 74.3%.
What is the Percentage of White / Caucasian Population in Illinois?
Percentage of White / Caucasian Population in Illinois is 65.8%.
What is the Percentage of White / Caucasian Population in the United States?
Percentage of White / Caucasian Population in the United States is 65.9%.