Zip Codes with the Highest Percentage of Population Employed in Life, Physical & Social Science in Danville, IL
RELATED REPORTS & OPTIONS
Life, Physical & Social Science
Danville
Compare Zip Codes
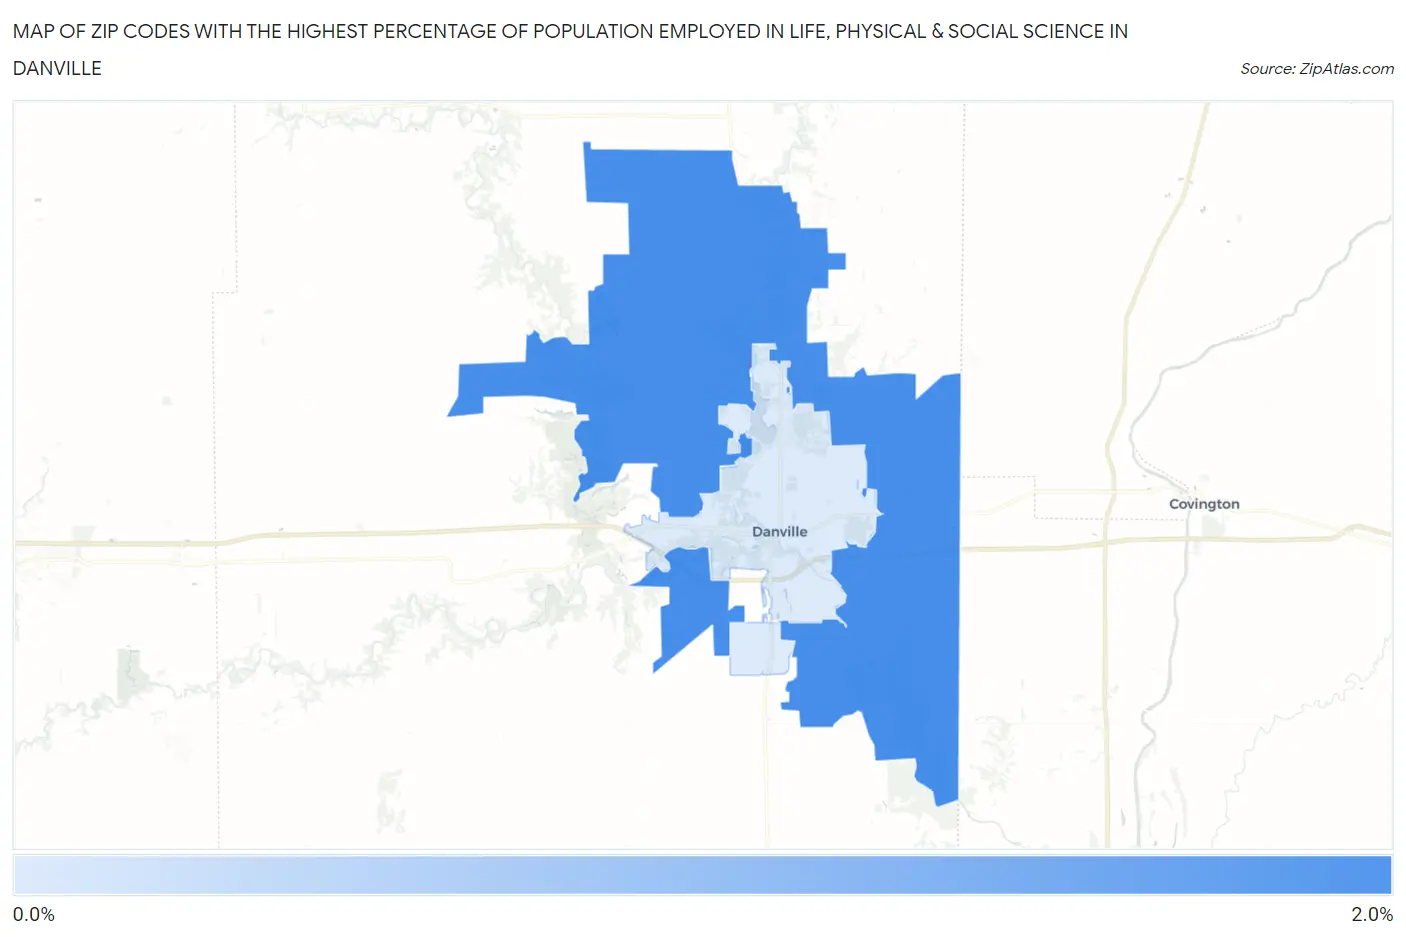
Map of Zip Codes with the Highest Percentage of Population Employed in Life, Physical & Social Science in Danville
0.0%
2.0%
Zip Codes with the Highest Percentage of Population Employed in Life, Physical & Social Science in Danville, IL
| Zip Code | % Employed | vs State | vs National | |
| 1. | 61834 | 1.5% | 0.98%(+0.538)#184 | 1.1%(+0.425)#5,564 |
| 2. | 61832 | 0.26% | 0.98%(-0.722)#741 | 1.1%(-0.834)#17,560 |
1
Common Questions
What are the Top Zip Codes with the Highest Percentage of Population Employed in Life, Physical & Social Science in Danville, IL?
Top Zip Codes with the Highest Percentage of Population Employed in Life, Physical & Social Science in Danville, IL are:
What zip code has the Highest Percentage of Population Employed in Life, Physical & Social Science in Danville, IL?
61834 has the Highest Percentage of Population Employed in Life, Physical & Social Science in Danville, IL with 1.5%.
What is the Percentage of Population Employed in Life, Physical & Social Science in Danville, IL?
Percentage of Population Employed in Life, Physical & Social Science in Danville is 0.32%.
What is the Percentage of Population Employed in Life, Physical & Social Science in Illinois?
Percentage of Population Employed in Life, Physical & Social Science in Illinois is 0.98%.
What is the Percentage of Population Employed in Life, Physical & Social Science in the United States?
Percentage of Population Employed in Life, Physical & Social Science in the United States is 1.1%.