Zip Codes with the Highest Percentage of Population Employed in Community & Social Service in Danville, IL
RELATED REPORTS & OPTIONS
Community & Social Service
Danville
Compare Zip Codes
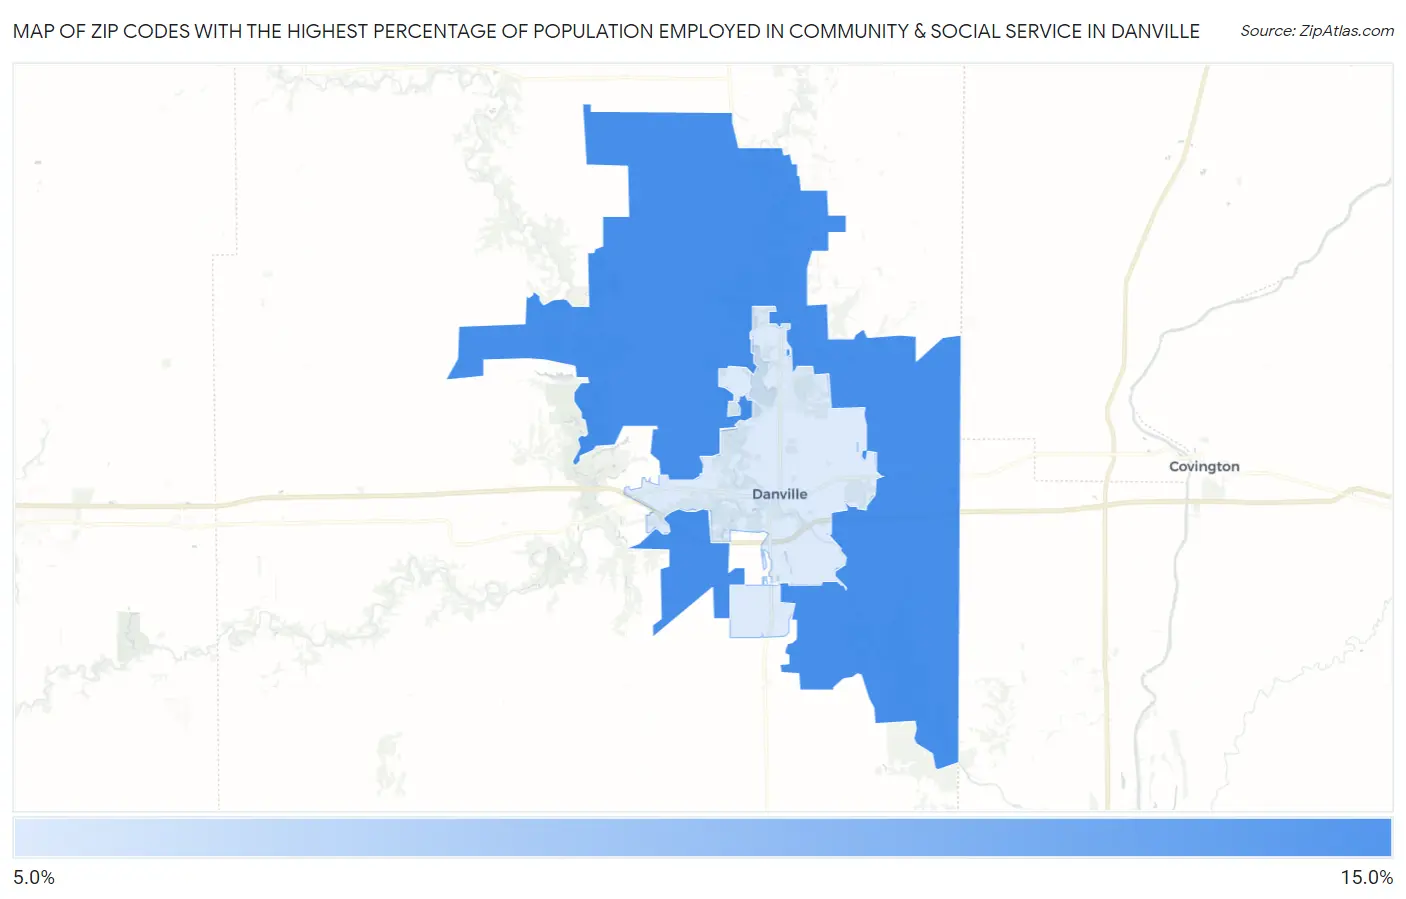
Map of Zip Codes with the Highest Percentage of Population Employed in Community & Social Service in Danville
0.0%
15.0%
Zip Codes with the Highest Percentage of Population Employed in Community & Social Service in Danville, IL
| Zip Code | % Employed | vs State | vs National | |
| 1. | 61834 | 10.9% | 11.3%(-0.349)#402 | 11.2%(-0.283)#11,811 |
| 2. | 61832 | 9.0% | 11.3%(-2.31)#636 | 11.2%(-2.25)#16,911 |
1
Common Questions
What are the Top Zip Codes with the Highest Percentage of Population Employed in Community & Social Service in Danville, IL?
Top Zip Codes with the Highest Percentage of Population Employed in Community & Social Service in Danville, IL are:
What zip code has the Highest Percentage of Population Employed in Community & Social Service in Danville, IL?
61834 has the Highest Percentage of Population Employed in Community & Social Service in Danville, IL with 10.9%.
What is the Percentage of Population Employed in Community & Social Service in Danville, IL?
Percentage of Population Employed in Community & Social Service in Danville is 10.1%.
What is the Percentage of Population Employed in Community & Social Service in Illinois?
Percentage of Population Employed in Community & Social Service in Illinois is 11.3%.
What is the Percentage of Population Employed in Community & Social Service in the United States?
Percentage of Population Employed in Community & Social Service in the United States is 11.2%.