Zip Codes with the Highest Percentage of Population with a Degree in Liberal Arts and History in Naperville, IL
RELATED REPORTS & OPTIONS
Liberal Arts and History
Naperville
Compare Zip Codes
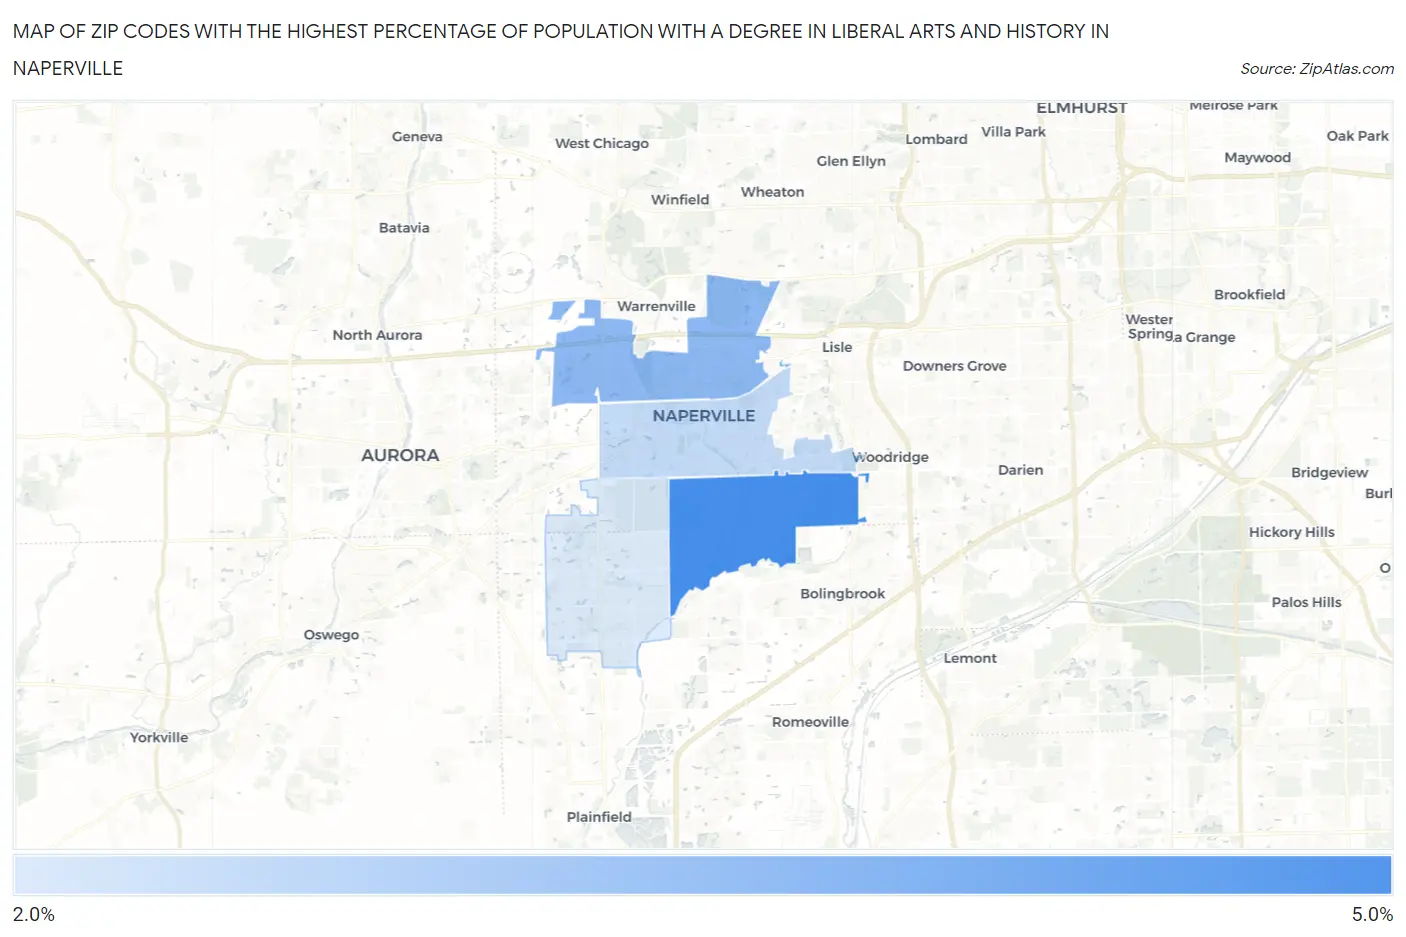
Map of Zip Codes with the Highest Percentage of Population with a Degree in Liberal Arts and History in Naperville
0.0%
5.0%
Zip Codes with the Highest Percentage of Population with a Degree in Liberal Arts and History in Naperville, IL
| Zip Code | % Graduates | vs State | vs National | |
| 1. | 60565 | 4.1% | 4.7%(-0.650)#568 | 4.9%(-0.809)#14,533 |
| 2. | 60563 | 3.4% | 4.7%(-1.32)#660 | 4.9%(-1.48)#17,005 |
| 3. | 60540 | 2.8% | 4.7%(-1.87)#748 | 4.9%(-2.03)#18,877 |
| 4. | 60564 | 2.6% | 4.7%(-2.11)#786 | 4.9%(-2.27)#19,642 |
1
Common Questions
What are the Top 3 Zip Codes with the Highest Percentage of Population with a Degree in Liberal Arts and History in Naperville, IL?
Top 3 Zip Codes with the Highest Percentage of Population with a Degree in Liberal Arts and History in Naperville, IL are:
What zip code has the Highest Percentage of Population with a Degree in Liberal Arts and History in Naperville, IL?
60565 has the Highest Percentage of Population with a Degree in Liberal Arts and History in Naperville, IL with 4.1%.
What is the Percentage of Population with a Degree in Liberal Arts and History in Naperville, IL?
Percentage of Population with a Degree in Liberal Arts and History in Naperville is 3.2%.
What is the Percentage of Population with a Degree in Liberal Arts and History in Illinois?
Percentage of Population with a Degree in Liberal Arts and History in Illinois is 4.7%.
What is the Percentage of Population with a Degree in Liberal Arts and History in the United States?
Percentage of Population with a Degree in Liberal Arts and History in the United States is 4.9%.