Luxembourger vs Native/Alaskan Married-couple Households
COMPARE
Luxembourger
Native/Alaskan
Married-couple Households
Married-couple Households Comparison
Luxembourgers
Natives/Alaskans
48.5%
MARRIED-COUPLE HOUSEHOLDS
99.1/ 100
METRIC RATING
62nd/ 347
METRIC RANK
43.5%
MARRIED-COUPLE HOUSEHOLDS
0.1/ 100
METRIC RATING
267th/ 347
METRIC RANK
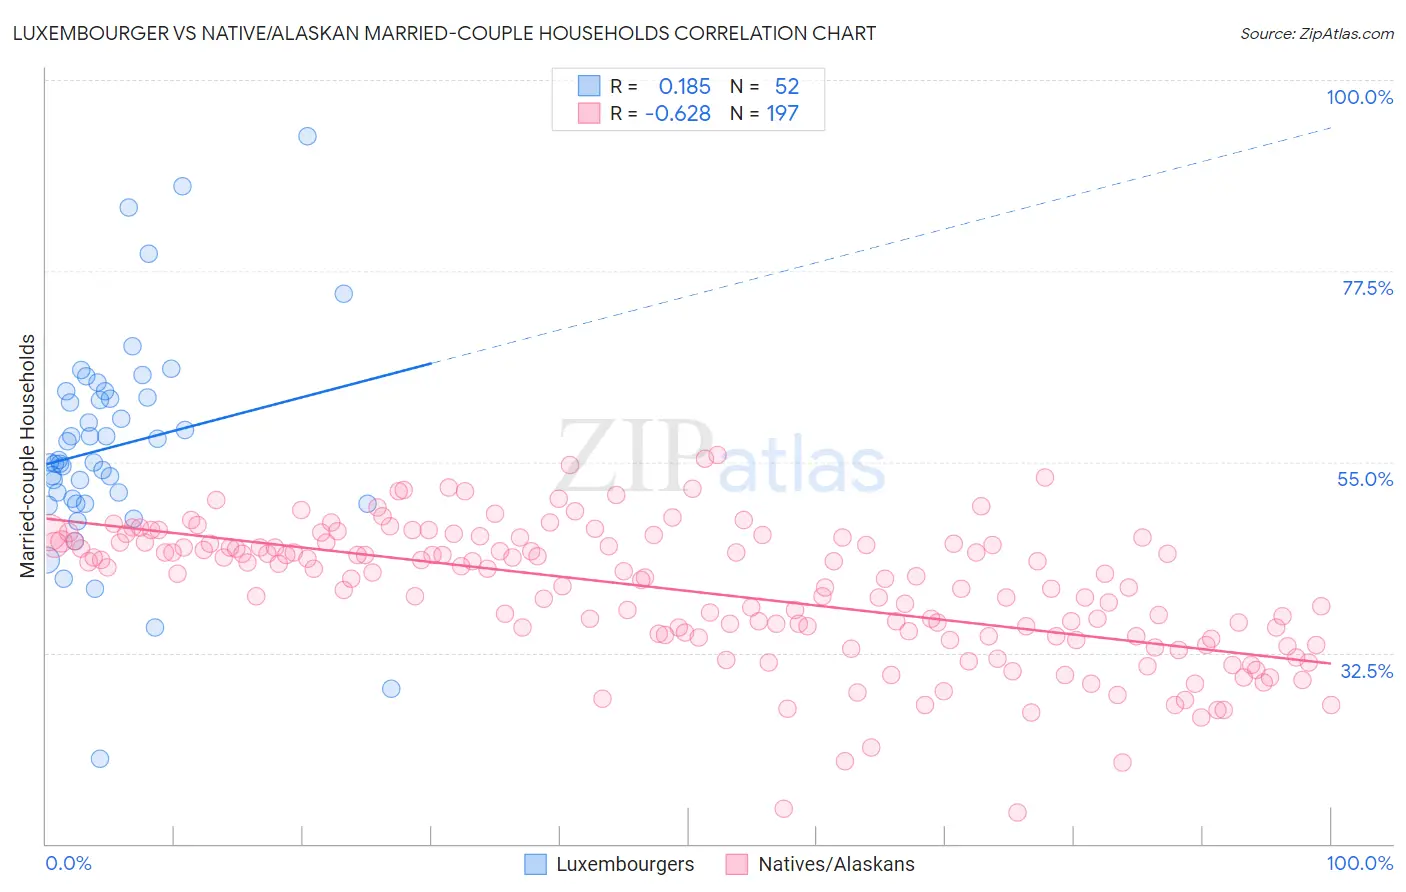
Luxembourger vs Native/Alaskan Married-couple Households Correlation Chart
The statistical analysis conducted on geographies consisting of 144,648,044 people shows a poor positive correlation between the proportion of Luxembourgers and percentage of married-couple family households in the United States with a correlation coefficient (R) of 0.185 and weighted average of 48.5%. Similarly, the statistical analysis conducted on geographies consisting of 512,631,690 people shows a significant negative correlation between the proportion of Natives/Alaskans and percentage of married-couple family households in the United States with a correlation coefficient (R) of -0.628 and weighted average of 43.5%, a difference of 11.6%.
Married-couple Households Correlation Summary
| Measurement | Luxembourger | Native/Alaskan |
| Minimum | 20.0% | 13.8% |
| Maximum | 93.3% | 55.8% |
| Range | 73.3% | 42.1% |
| Mean | 56.9% | 39.8% |
| Median | 55.1% | 41.7% |
| Interquartile 25% (IQ1) | 50.3% | 34.5% |
| Interquartile 75% (IQ3) | 62.9% | 45.5% |
| Interquartile Range (IQR) | 12.6% | 11.0% |
| Standard Deviation (Sample) | 13.0% | 7.9% |
| Standard Deviation (Population) | 12.9% | 7.9% |
Similar Demographics by Married-couple Households
Demographics Similar to Luxembourgers by Married-couple Households
In terms of married-couple households, the demographic groups most similar to Luxembourgers are Bulgarian (48.5%, a difference of 0.0%), Croatian (48.5%, a difference of 0.060%), Basque (48.4%, a difference of 0.060%), Northern European (48.4%, a difference of 0.080%), and Immigrants from Canada (48.4%, a difference of 0.090%).
| Demographics | Rating | Rank | Married-couple Households |
| Austrians | 99.3 /100 | #55 | Exceptional 48.6% |
| Immigrants | Northern Europe | 99.3 /100 | #56 | Exceptional 48.6% |
| Poles | 99.2 /100 | #57 | Exceptional 48.5% |
| Immigrants | Indonesia | 99.2 /100 | #58 | Exceptional 48.5% |
| Czechoslovakians | 99.2 /100 | #59 | Exceptional 48.5% |
| Croatians | 99.1 /100 | #60 | Exceptional 48.5% |
| Bulgarians | 99.1 /100 | #61 | Exceptional 48.5% |
| Luxembourgers | 99.1 /100 | #62 | Exceptional 48.5% |
| Basques | 99.0 /100 | #63 | Exceptional 48.4% |
| Northern Europeans | 99.0 /100 | #64 | Exceptional 48.4% |
| Immigrants | Canada | 99.0 /100 | #65 | Exceptional 48.4% |
| Jordanians | 98.9 /100 | #66 | Exceptional 48.4% |
| Romanians | 98.9 /100 | #67 | Exceptional 48.4% |
| Immigrants | South Eastern Asia | 98.9 /100 | #68 | Exceptional 48.4% |
| Immigrants | China | 98.9 /100 | #69 | Exceptional 48.4% |
Demographics Similar to Natives/Alaskans by Married-couple Households
In terms of married-couple households, the demographic groups most similar to Natives/Alaskans are Ecuadorian (43.5%, a difference of 0.050%), Moroccan (43.5%, a difference of 0.090%), Immigrants from Burma/Myanmar (43.4%, a difference of 0.10%), Bangladeshi (43.5%, a difference of 0.17%), and Cree (43.6%, a difference of 0.29%).
| Demographics | Rating | Rank | Married-couple Households |
| Immigrants | Cameroon | 0.2 /100 | #260 | Tragic 43.7% |
| Alaskan Athabascans | 0.2 /100 | #261 | Tragic 43.6% |
| Vietnamese | 0.2 /100 | #262 | Tragic 43.6% |
| Cree | 0.1 /100 | #263 | Tragic 43.6% |
| Bangladeshis | 0.1 /100 | #264 | Tragic 43.5% |
| Moroccans | 0.1 /100 | #265 | Tragic 43.5% |
| Ecuadorians | 0.1 /100 | #266 | Tragic 43.5% |
| Natives/Alaskans | 0.1 /100 | #267 | Tragic 43.5% |
| Immigrants | Burma/Myanmar | 0.1 /100 | #268 | Tragic 43.4% |
| Immigrants | Sierra Leone | 0.1 /100 | #269 | Tragic 43.3% |
| Yuman | 0.1 /100 | #270 | Tragic 43.3% |
| Guatemalans | 0.1 /100 | #271 | Tragic 43.3% |
| Immigrants | Nigeria | 0.1 /100 | #272 | Tragic 43.2% |
| Ethiopians | 0.1 /100 | #273 | Tragic 43.2% |
| Nigerians | 0.1 /100 | #274 | Tragic 43.2% |