Immigrants from Sweden vs Northern European Married-couple Households

COMPARE

Immigrants from Sweden
Race
Ancestry
AfghanAfricanAlaska NativeAlaskan AthabascanAlbanianAleutAlsatianAmericanApacheArabArapahoArgentineanArmenianAssyrian/Chaldean/SyriacAustralianAustrianBahamianBangladeshiBarbadianBasqueBelgianBelizeanBermudanBhutaneseBlackfeetBolivianBrazilianBritishBritish West IndianBulgarianBurmeseCajunCambodianCanadianCape VerdeanCarpatho RusynCelticCentral AmericanCentral American IndianCherokeeCheyenneChickasawChileanChineseChippewaChoctawColombianColvilleComancheCosta RicanCreeCreekCroatianCrowCubanCypriotCzechCzechoslovakianDanishDelawareDominicanDutchDutch West IndianEastern EuropeanEcuadorianEgyptianEnglishEstonianEthiopianEuropeanFijianFilipinoFinnishFrenchFrench American IndianFrench CanadianGermanGerman RussianGhanaianGreekGuamanian/ChamorroGuatemalanGuyaneseHaitianHmongHonduranHopiHoumaHungarianIcelanderIndian (Asian)IndonesianInupiatIranianIraqiIrishIroquoisIsraeliItalianJamaicanJapaneseJordanianKenyanKiowaKoreanLaotianLatvianLebaneseLiberianLithuanianLumbeeLuxembourgerMacedonianMalaysianMalteseMarshalleseMenomineeMexicanMexican American IndianMongolianMoroccanNative HawaiianNavajoNepaleseNew ZealanderNicaraguanNigerianNorwegianOkinawanOsageOttawaPaiutePakistaniPalestinianPanamanianParaguayanPennsylvania GermanPeruvianPimaPolishPortuguesePotawatomiPuebloPuerto RicanPuget Sound SalishRomanianRussianSalvadoranSamoanScandinavianScotch-IrishScottishSeminoleSenegaleseSerbianShoshoneSierra LeoneanSiouxSlavicSlovakSloveneSomaliSouth AfricanSouth AmericanSouth American IndianSoviet UnionSpaniardSpanishSpanish AmericanSpanish American IndianSri LankanSubsaharan AfricanSudaneseSwedishSwissSyrianTaiwaneseThaiTlingit-HaidaTohono O'OdhamTonganTrinidadian and TobagonianTsimshianTurkishU.S. Virgin IslanderUgandanUkrainianUruguayanUteVenezuelanVietnameseWelshWest IndianYakamaYaquiYugoslavianYumanYup'ikZimbabwean
Immigration
NonimmigrantsImmigrantsAfghanistanAfricaAlbaniaArgentinaArmeniaAsiaAustraliaAustriaBahamasBangladeshBarbadosBelarusBelgiumBelizeBoliviaBosnia and HerzegovinaBrazilBulgariaBurma/MyanmarCabo VerdeCambodiaCameroonCanadaCaribbeanCentral AmericaChileChinaColombiaCongoCosta RicaCroatiaCubaCzechoslovakiaDenmarkDominicaDominican RepublicEastern AfricaEastern AsiaEastern EuropeEcuadorEgyptEl SalvadorEnglandEritreaEthiopiaEuropeFijiFranceGermanyGhanaGreeceGrenadaGuatemalaGuyanaHaitiHondurasHong KongHungaryIndiaIndonesiaIranIraqIrelandIsraelItalyJamaicaJapanJordanKazakhstanKenyaKoreaKuwaitLaosLatin AmericaLatviaLebanonLiberiaLithuaniaMalaysiaMexicoMicronesiaMiddle AfricaMoldovaMoroccoNepalNetherlandsNicaraguaNigeriaNorth AmericaNorth MacedoniaNorthern AfricaNorthern EuropeNorwayOceaniaPakistanPanamaPeruPhilippinesPolandPortugalRomaniaRussiaSaudi ArabiaScotlandSenegalSerbiaSierra LeoneSingaporeSomaliaSouth AfricaSouth AmericaSouth Central AsiaSouth Eastern AsiaSouthern EuropeSpainSri LankaSt. Vincent and the GrenadinesSudanSwedenSwitzerlandSyriaTaiwanThailandTrinidad and TobagoTurkeyUgandaUkraineUruguayUzbekistanVenezuelaVietnamWest IndiesWestern AfricaWestern AsiaWestern EuropeYemenZaireZimbabweAzores
Northern European
Race
Ancestry
AfghanAfricanAlaska NativeAlaskan AthabascanAlbanianAleutAlsatianAmericanApacheArabArapahoArgentineanArmenianAssyrian/Chaldean/SyriacAustralianAustrianBahamianBangladeshiBarbadianBasqueBelgianBelizeanBermudanBhutaneseBlackfeetBolivianBrazilianBritishBritish West IndianBulgarianBurmeseCajunCambodianCanadianCape VerdeanCarpatho RusynCelticCentral AmericanCentral American IndianCherokeeCheyenneChickasawChileanChineseChippewaChoctawColombianColvilleComancheCosta RicanCreeCreekCroatianCrowCubanCypriotCzechCzechoslovakianDanishDelawareDominicanDutchDutch West IndianEastern EuropeanEcuadorianEgyptianEnglishEstonianEthiopianEuropeanFijianFilipinoFinnishFrenchFrench American IndianFrench CanadianGermanGerman RussianGhanaianGreekGuamanian/ChamorroGuatemalanGuyaneseHaitianHmongHonduranHopiHoumaHungarianIcelanderIndian (Asian)IndonesianInupiatIranianIraqiIrishIroquoisIsraeliItalianJamaicanJapaneseJordanianKenyanKiowaKoreanLaotianLatvianLebaneseLiberianLithuanianLumbeeLuxembourgerMacedonianMalaysianMalteseMarshalleseMenomineeMexicanMexican American IndianMongolianMoroccanNative HawaiianNavajoNepaleseNew ZealanderNicaraguanNigerianNorthern EuropeanNorwegianOkinawanOsageOttawaPaiutePakistaniPalestinianPanamanianParaguayanPennsylvania GermanPeruvianPimaPolishPortuguesePotawatomiPuebloPuerto RicanPuget Sound SalishRomanianRussianSalvadoranSamoanScandinavianScotch-IrishScottishSeminoleSenegaleseSerbianShoshoneSierra LeoneanSiouxSlavicSlovakSloveneSomaliSouth AfricanSouth AmericanSouth American IndianSoviet UnionSpaniardSpanishSpanish AmericanSpanish American IndianSri LankanSubsaharan AfricanSudaneseSwedishSwissSyrianTaiwaneseThaiTlingit-HaidaTohono O'OdhamTonganTrinidadian and TobagonianTsimshianTurkishU.S. Virgin IslanderUgandanUkrainianUruguayanUteVenezuelanVietnameseWelshWest IndianYakamaYaquiYugoslavianYumanYup'ikZimbabwean
Immigration
NonimmigrantsImmigrantsAfghanistanAfricaAlbaniaArgentinaArmeniaAsiaAustraliaAustriaBahamasBangladeshBarbadosBelarusBelgiumBelizeBoliviaBosnia and HerzegovinaBrazilBulgariaBurma/MyanmarCabo VerdeCambodiaCameroonCanadaCaribbeanCentral AmericaChileChinaColombiaCongoCosta RicaCroatiaCubaCzechoslovakiaDenmarkDominicaDominican RepublicEastern AfricaEastern AsiaEastern EuropeEcuadorEgyptEl SalvadorEnglandEritreaEthiopiaEuropeFijiFranceGermanyGhanaGreeceGrenadaGuatemalaGuyanaHaitiHondurasHong KongHungaryIndiaIndonesiaIranIraqIrelandIsraelItalyJamaicaJapanJordanKazakhstanKenyaKoreaKuwaitLaosLatin AmericaLatviaLebanonLiberiaLithuaniaMalaysiaMexicoMicronesiaMiddle AfricaMoldovaMoroccoNepalNetherlandsNicaraguaNigeriaNorth AmericaNorth MacedoniaNorthern AfricaNorthern EuropeNorwayOceaniaPakistanPanamaPeruPhilippinesPolandPortugalRomaniaRussiaSaudi ArabiaScotlandSenegalSerbiaSierra LeoneSingaporeSomaliaSouth AfricaSouth AmericaSouth Central AsiaSouth Eastern AsiaSouthern EuropeSpainSri LankaSt. Vincent and the GrenadinesSudanSwitzerlandSyriaTaiwanThailandTrinidad and TobagoTurkeyUgandaUkraineUruguayUzbekistanVenezuelaVietnamWest IndiesWestern AfricaWestern AsiaWestern EuropeYemenZaireZimbabweAzores
Married-couple Households
Income
Poverty
Unemployment
Labor Participation
Family Structure
Vehicle Availability
Education Level
Disability

Married-couple Households Comparison

Immigrants from Sweden

Northern Europeans

Excellent
Exceptional
47.2%
MARRIED-COUPLE HOUSEHOLDS
84.7/ 100
METRIC RATING
139th/ 347
METRIC RANK
48.4%
MARRIED-COUPLE HOUSEHOLDS
99.0/ 100
METRIC RATING
64th/ 347
METRIC RANK

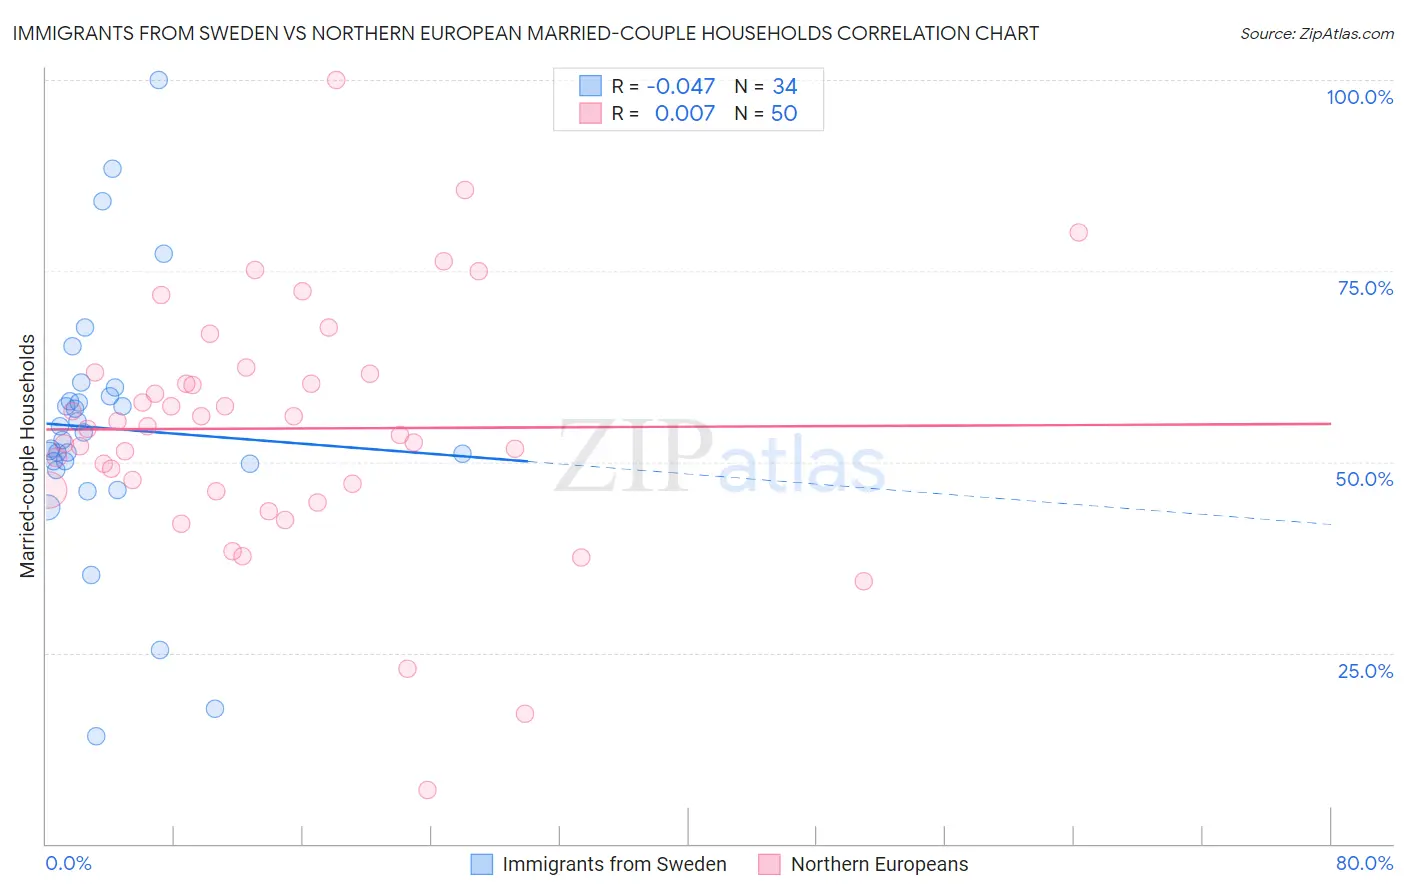
Immigrants from Sweden vs Northern European Married-couple Households Correlation Chart

The statistical analysis conducted on geographies consisting of 164,705,416 people shows no correlation between the proportion of Immigrants from Sweden and percentage of married-couple family households in the United States with a correlation coefficient (R) of -0.047 and weighted average of 47.2%. Similarly, the statistical analysis conducted on geographies consisting of 405,935,779 people shows no correlation between the proportion of Northern Europeans and percentage of married-couple family households in the United States with a correlation coefficient (R) of 0.007 and weighted average of 48.4%, a difference of 2.6%.
Immigrants from Sweden vs Northern European Married-couple Households

Married-couple Households Correlation Summary

MeasurementImmigrants from SwedenNorthern European
Minimum14.1%7.1%
Maximum100.0%100.0%
Range85.9%92.9%
Mean54.4%54.4%
Median53.4%54.5%
Interquartile 25% (IQ1)49.7%46.4%
Interquartile 75% (IQ3)58.6%61.6%
Interquartile Range (IQR)8.9%15.2%
Standard Deviation (Sample)17.1%16.3%
Standard Deviation (Population)16.8%16.1%

Similar Demographics by Married-couple Households

Demographics Similar to Immigrants from Sweden by Married-couple Households

In terms of married-couple households, the demographic groups most similar to Immigrants from Sweden are Spanish (47.2%, a difference of 0.020%), Costa Rican (47.2%, a difference of 0.020%), Immigrants from Afghanistan (47.2%, a difference of 0.030%), New Zealander (47.2%, a difference of 0.040%), and Immigrants from Malaysia (47.2%, a difference of 0.040%).
DemographicsRating | RankMarried-couple Households
Immigrants | Ukraine
86.7
/100
|
#132
Excellent
47.3%
South Africans
86.4
/100
|
#133
Excellent
47.3%
Immigrants | Greece
86.0
/100
|
#134
Excellent
47.2%
Immigrants | Argentina
86.0
/100
|
#135
Excellent
47.2%
New Zealanders
85.3
/100
|
#136
Excellent
47.2%
Immigrants | Malaysia
85.2
/100
|
#137
Excellent
47.2%
Immigrants | Afghanistan
85.1
/100
|
#138
Excellent
47.2%
Immigrants | Sweden
84.7
/100
|
#139
Excellent
47.2%
Spanish
84.5
/100
|
#140
Excellent
47.2%
Costa Ricans
84.4
/100
|
#141
Excellent
47.2%
Spaniards
84.1
/100
|
#142
Excellent
47.2%
Immigrants | Belarus
83.8
/100
|
#143
Excellent
47.2%
Mexicans
83.4
/100
|
#144
Excellent
47.1%
Slovenes
81.7
/100
|
#145
Excellent
47.1%
Immigrants | Western Europe
81.6
/100
|
#146
Excellent
47.1%

Demographics Similar to Northern Europeans by Married-couple Households

In terms of married-couple households, the demographic groups most similar to Northern Europeans are Basque (48.4%, a difference of 0.010%), Immigrants from Canada (48.4%, a difference of 0.020%), Jordanian (48.4%, a difference of 0.040%), Romanian (48.4%, a difference of 0.050%), and Immigrants from South Eastern Asia (48.4%, a difference of 0.060%).
DemographicsRating | RankMarried-couple Households
Poles
99.2
/100
|
#57
Exceptional
48.5%
Immigrants | Indonesia
99.2
/100
|
#58
Exceptional
48.5%
Czechoslovakians
99.2
/100
|
#59
Exceptional
48.5%
Croatians
99.1
/100
|
#60
Exceptional
48.5%
Bulgarians
99.1
/100
|
#61
Exceptional
48.5%
Luxembourgers
99.1
/100
|
#62
Exceptional
48.5%
Basques
99.0
/100
|
#63
Exceptional
48.4%
Northern Europeans
99.0
/100
|
#64
Exceptional
48.4%
Immigrants | Canada
99.0
/100
|
#65
Exceptional
48.4%
Jordanians
98.9
/100
|
#66
Exceptional
48.4%
Romanians
98.9
/100
|
#67
Exceptional
48.4%
Immigrants | South Eastern Asia
98.9
/100
|
#68
Exceptional
48.4%
Immigrants | China
98.9
/100
|
#69
Exceptional
48.4%
Immigrants | North America
98.9
/100
|
#70
Exceptional
48.4%
Laotians
98.8
/100
|
#71
Exceptional
48.4%