Immigrants from Honduras vs Ottawa Married-couple Households
COMPARE
Immigrants from Honduras
Ottawa
Married-couple Households
Married-couple Households Comparison
Immigrants from Honduras
Ottawa
41.6%
MARRIED-COUPLE HOUSEHOLDS
0.0/ 100
METRIC RATING
302nd/ 347
METRIC RANK
45.8%
MARRIED-COUPLE HOUSEHOLDS
19.4/ 100
METRIC RATING
198th/ 347
METRIC RANK
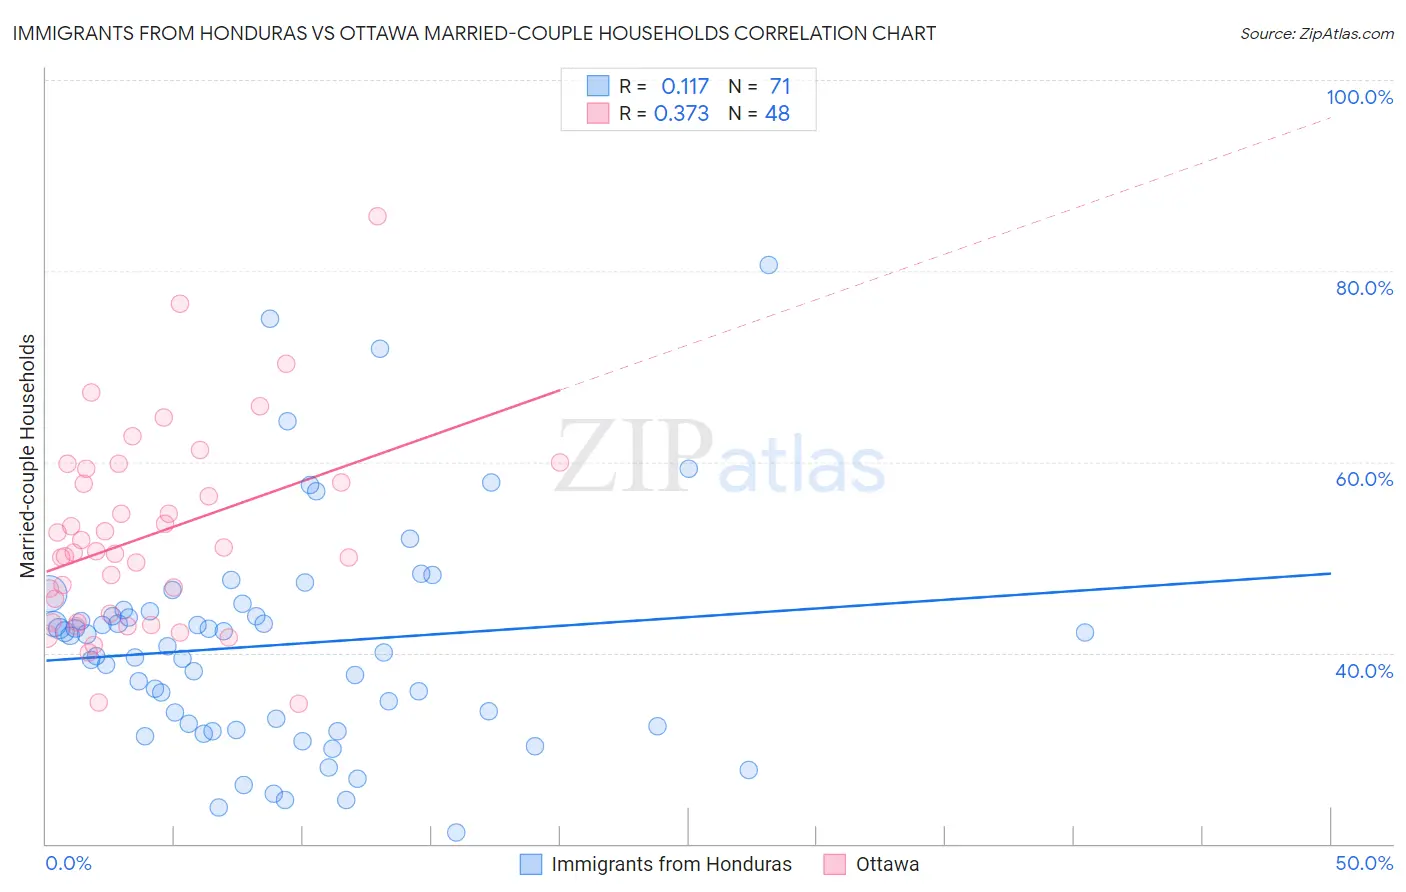
Immigrants from Honduras vs Ottawa Married-couple Households Correlation Chart
The statistical analysis conducted on geographies consisting of 322,465,433 people shows a poor positive correlation between the proportion of Immigrants from Honduras and percentage of married-couple family households in the United States with a correlation coefficient (R) of 0.117 and weighted average of 41.6%. Similarly, the statistical analysis conducted on geographies consisting of 49,944,544 people shows a mild positive correlation between the proportion of Ottawa and percentage of married-couple family households in the United States with a correlation coefficient (R) of 0.373 and weighted average of 45.8%, a difference of 10.1%.
Married-couple Households Correlation Summary
| Measurement | Immigrants from Honduras | Ottawa |
| Minimum | 21.2% | 34.7% |
| Maximum | 80.6% | 85.7% |
| Range | 59.5% | 51.0% |
| Mean | 40.8% | 52.3% |
| Median | 40.7% | 50.5% |
| Interquartile 25% (IQ1) | 32.3% | 43.7% |
| Interquartile 75% (IQ3) | 44.4% | 58.6% |
| Interquartile Range (IQR) | 12.1% | 14.9% |
| Standard Deviation (Sample) | 11.5% | 10.3% |
| Standard Deviation (Population) | 11.5% | 10.2% |
Similar Demographics by Married-couple Households
Demographics Similar to Immigrants from Honduras by Married-couple Households
In terms of married-couple households, the demographic groups most similar to Immigrants from Honduras are Subsaharan African (41.6%, a difference of 0.0%), Immigrants from Guyana (41.6%, a difference of 0.12%), Immigrants from Bahamas (41.7%, a difference of 0.17%), Sioux (41.5%, a difference of 0.23%), and Immigrants from Belize (41.8%, a difference of 0.38%).
| Demographics | Rating | Rank | Married-couple Households |
| Kiowa | 0.0 /100 | #295 | Tragic 42.0% |
| Immigrants | Sudan | 0.0 /100 | #296 | Tragic 41.9% |
| Arapaho | 0.0 /100 | #297 | Tragic 41.8% |
| Immigrants | Middle Africa | 0.0 /100 | #298 | Tragic 41.8% |
| Immigrants | Ghana | 0.0 /100 | #299 | Tragic 41.8% |
| Immigrants | Belize | 0.0 /100 | #300 | Tragic 41.8% |
| Immigrants | Bahamas | 0.0 /100 | #301 | Tragic 41.7% |
| Immigrants | Honduras | 0.0 /100 | #302 | Tragic 41.6% |
| Sub-Saharan Africans | 0.0 /100 | #303 | Tragic 41.6% |
| Immigrants | Guyana | 0.0 /100 | #304 | Tragic 41.6% |
| Sioux | 0.0 /100 | #305 | Tragic 41.5% |
| Guyanese | 0.0 /100 | #306 | Tragic 41.4% |
| Immigrants | Western Africa | 0.0 /100 | #307 | Tragic 41.4% |
| Crow | 0.0 /100 | #308 | Tragic 41.4% |
| Immigrants | Trinidad and Tobago | 0.0 /100 | #309 | Tragic 41.2% |
Demographics Similar to Ottawa by Married-couple Households
In terms of married-couple households, the demographic groups most similar to Ottawa are Cambodian (45.9%, a difference of 0.11%), Immigrants from South America (45.9%, a difference of 0.16%), Chickasaw (45.9%, a difference of 0.19%), Mexican American Indian (45.9%, a difference of 0.22%), and Taiwanese (45.9%, a difference of 0.23%).
| Demographics | Rating | Rank | Married-couple Households |
| Choctaw | 24.9 /100 | #191 | Fair 46.0% |
| Immigrants | Northern Africa | 24.6 /100 | #192 | Fair 46.0% |
| Taiwanese | 23.4 /100 | #193 | Fair 45.9% |
| Mexican American Indians | 23.3 /100 | #194 | Fair 45.9% |
| Chickasaw | 22.7 /100 | #195 | Fair 45.9% |
| Immigrants | South America | 22.2 /100 | #196 | Fair 45.9% |
| Cambodians | 21.3 /100 | #197 | Fair 45.9% |
| Ottawa | 19.4 /100 | #198 | Poor 45.8% |
| Carpatho Rusyns | 15.7 /100 | #199 | Poor 45.7% |
| Potawatomi | 15.6 /100 | #200 | Poor 45.7% |
| Immigrants | Serbia | 15.2 /100 | #201 | Poor 45.7% |
| Immigrants | Central America | 14.2 /100 | #202 | Poor 45.7% |
| Alaska Natives | 13.0 /100 | #203 | Poor 45.6% |
| Aleuts | 12.5 /100 | #204 | Poor 45.6% |
| Nepalese | 11.9 /100 | #205 | Poor 45.6% |