African vs Irish GED/Equivalency
COMPARE
African
Irish
GED/Equivalency
GED/Equivalency Comparison
Africans
Irish
83.4%
GED/EQUIVALENCY
0.5/ 100
METRIC RATING
256th/ 347
METRIC RANK
87.6%
GED/EQUIVALENCY
98.6/ 100
METRIC RATING
78th/ 347
METRIC RANK
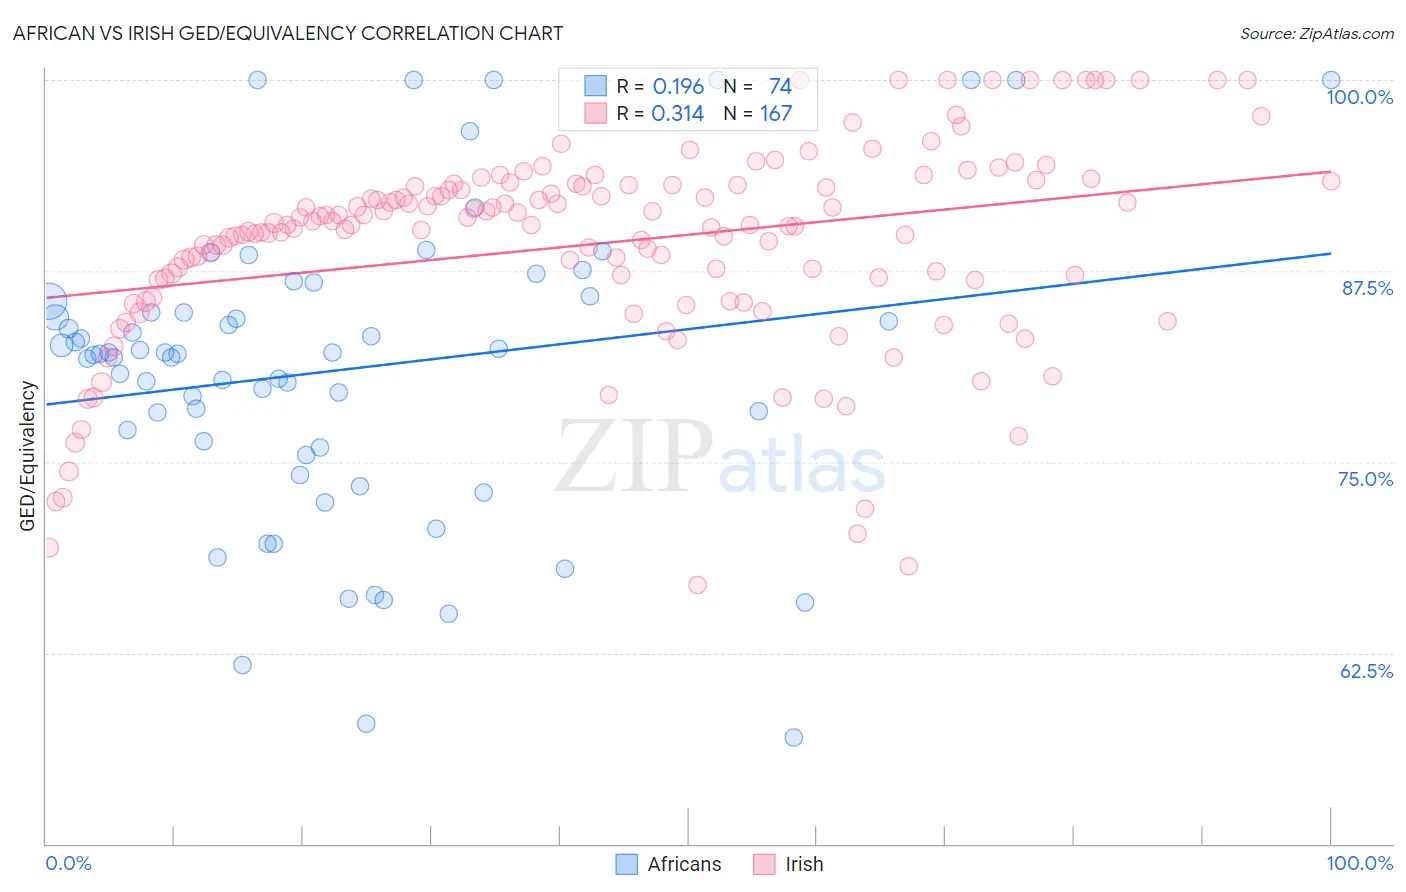
African vs Irish GED/Equivalency Correlation Chart
The statistical analysis conducted on geographies consisting of 470,092,963 people shows a poor positive correlation between the proportion of Africans and percentage of population with at least ged/equivalency education in the United States with a correlation coefficient (R) of 0.196 and weighted average of 83.4%. Similarly, the statistical analysis conducted on geographies consisting of 580,709,357 people shows a mild positive correlation between the proportion of Irish and percentage of population with at least ged/equivalency education in the United States with a correlation coefficient (R) of 0.314 and weighted average of 87.6%, a difference of 5.1%.
GED/Equivalency Correlation Summary
| Measurement | African | Irish |
| Minimum | 56.9% | 67.0% |
| Maximum | 100.0% | 100.0% |
| Range | 43.1% | 33.0% |
| Mean | 81.0% | 89.2% |
| Median | 82.1% | 90.5% |
| Interquartile 25% (IQ1) | 75.9% | 86.9% |
| Interquartile 75% (IQ3) | 85.5% | 93.1% |
| Interquartile Range (IQR) | 9.6% | 6.2% |
| Standard Deviation (Sample) | 9.9% | 6.6% |
| Standard Deviation (Population) | 9.8% | 6.6% |
Similar Demographics by GED/Equivalency
Demographics Similar to Africans by GED/Equivalency
In terms of ged/equivalency, the demographic groups most similar to Africans are Colville (83.4%, a difference of 0.010%), Jamaican (83.3%, a difference of 0.13%), Malaysian (83.3%, a difference of 0.16%), Creek (83.6%, a difference of 0.18%), and Comanche (83.6%, a difference of 0.20%).
| Demographics | Rating | Rank | GED/Equivalency |
| Crow | 1.1 /100 | #249 | Tragic 83.8% |
| Shoshone | 1.0 /100 | #250 | Tragic 83.7% |
| Spanish Americans | 0.8 /100 | #251 | Tragic 83.6% |
| Bahamians | 0.8 /100 | #252 | Tragic 83.6% |
| Comanche | 0.7 /100 | #253 | Tragic 83.6% |
| Creek | 0.7 /100 | #254 | Tragic 83.6% |
| Colville | 0.5 /100 | #255 | Tragic 83.4% |
| Africans | 0.5 /100 | #256 | Tragic 83.4% |
| Jamaicans | 0.4 /100 | #257 | Tragic 83.3% |
| Malaysians | 0.4 /100 | #258 | Tragic 83.3% |
| Immigrants | Vietnam | 0.3 /100 | #259 | Tragic 83.2% |
| Choctaw | 0.3 /100 | #260 | Tragic 83.1% |
| Inupiat | 0.2 /100 | #261 | Tragic 83.1% |
| Immigrants | Armenia | 0.2 /100 | #262 | Tragic 83.1% |
| Immigrants | Congo | 0.2 /100 | #263 | Tragic 83.1% |
Demographics Similar to Irish by GED/Equivalency
In terms of ged/equivalency, the demographic groups most similar to Irish are Slavic (87.7%, a difference of 0.020%), Immigrants from Serbia (87.7%, a difference of 0.030%), English (87.6%, a difference of 0.030%), Scottish (87.7%, a difference of 0.040%), and Immigrants from Kuwait (87.7%, a difference of 0.060%).
| Demographics | Rating | Rank | GED/Equivalency |
| Austrians | 98.8 /100 | #71 | Exceptional 87.7% |
| Immigrants | Moldova | 98.8 /100 | #72 | Exceptional 87.7% |
| Belgians | 98.8 /100 | #73 | Exceptional 87.7% |
| Immigrants | Kuwait | 98.8 /100 | #74 | Exceptional 87.7% |
| Scottish | 98.7 /100 | #75 | Exceptional 87.7% |
| Immigrants | Serbia | 98.7 /100 | #76 | Exceptional 87.7% |
| Slavs | 98.7 /100 | #77 | Exceptional 87.7% |
| Irish | 98.6 /100 | #78 | Exceptional 87.6% |
| English | 98.6 /100 | #79 | Exceptional 87.6% |
| Immigrants | England | 98.5 /100 | #80 | Exceptional 87.6% |
| Immigrants | Sri Lanka | 98.3 /100 | #81 | Exceptional 87.5% |
| Romanians | 98.3 /100 | #82 | Exceptional 87.5% |
| South Africans | 98.3 /100 | #83 | Exceptional 87.5% |
| Immigrants | Romania | 98.1 /100 | #84 | Exceptional 87.5% |
| Dutch | 98.1 /100 | #85 | Exceptional 87.5% |