Serbian vs Immigrants from Serbia Community Comparison
COMPARE
Serbian
Immigrants from Serbia
Social Comparison
Social Comparison
Serbians
Immigrants from Serbia
8,746
SOCIAL INDEX
84.9/ 100
SOCIAL RATING
53rd/ 347
SOCIAL RANK
9,096
SOCIAL INDEX
88.4/ 100
SOCIAL RATING
31st/ 347
SOCIAL RANK
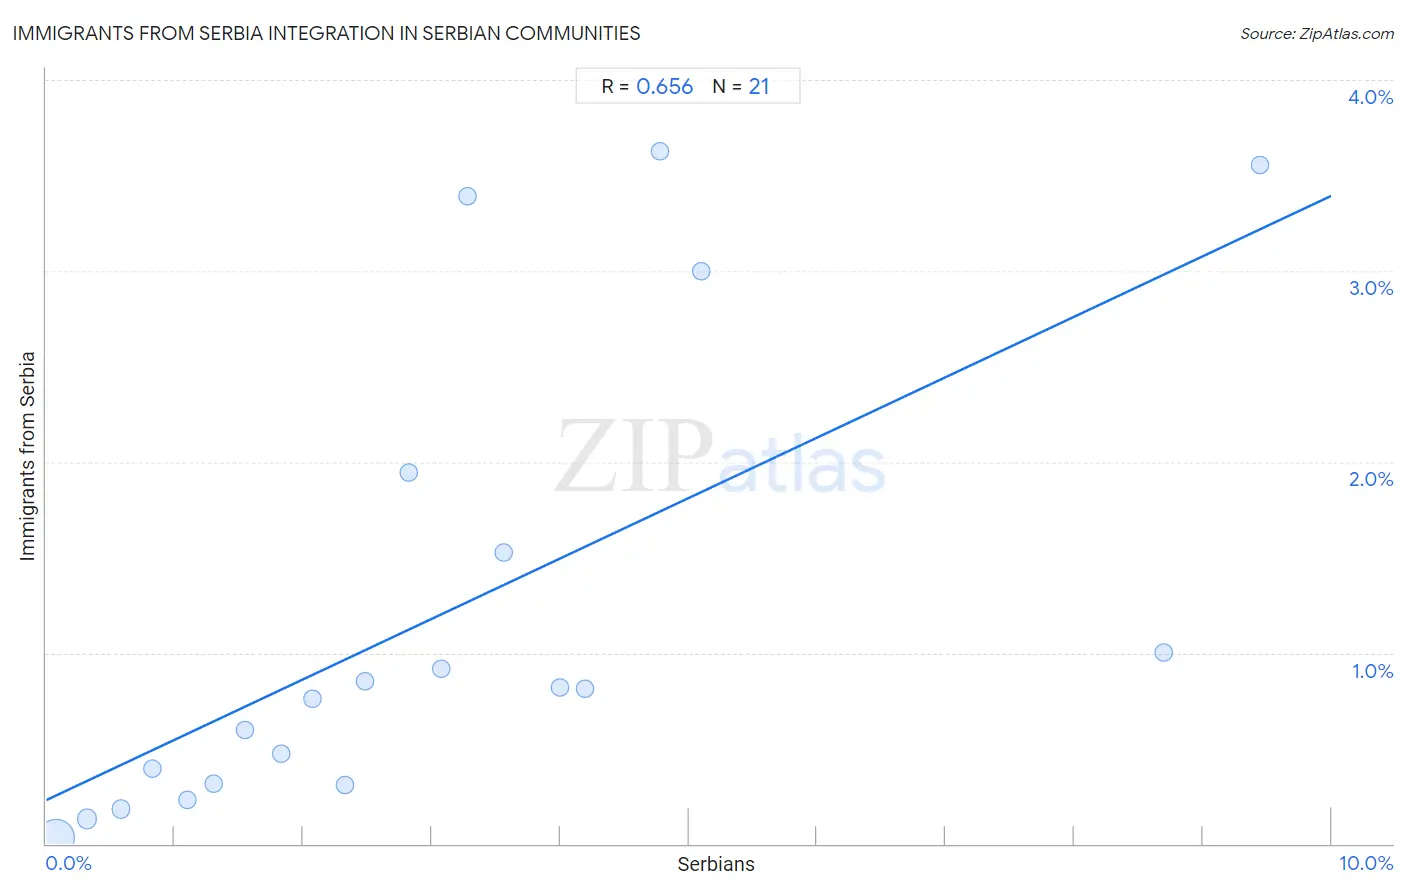
Immigrants from Serbia Integration in Serbian Communities
The statistical analysis conducted on geographies consisting of 124,638,261 people shows a significant positive correlation between the proportion of Immigrants from Serbia within Serbian communities in the United States with a correlation coefficient (R) of 0.656. On average, for every 1% (one percent) increase in Serbians within a typical geography, there is an increase of 0.317% in Immigrants from Serbia. To illustrate, in a geography comprising of 100,000 individuals, a rise of 1,000 Serbians corresponds to an increase of 316.5 Immigrants from Serbia.
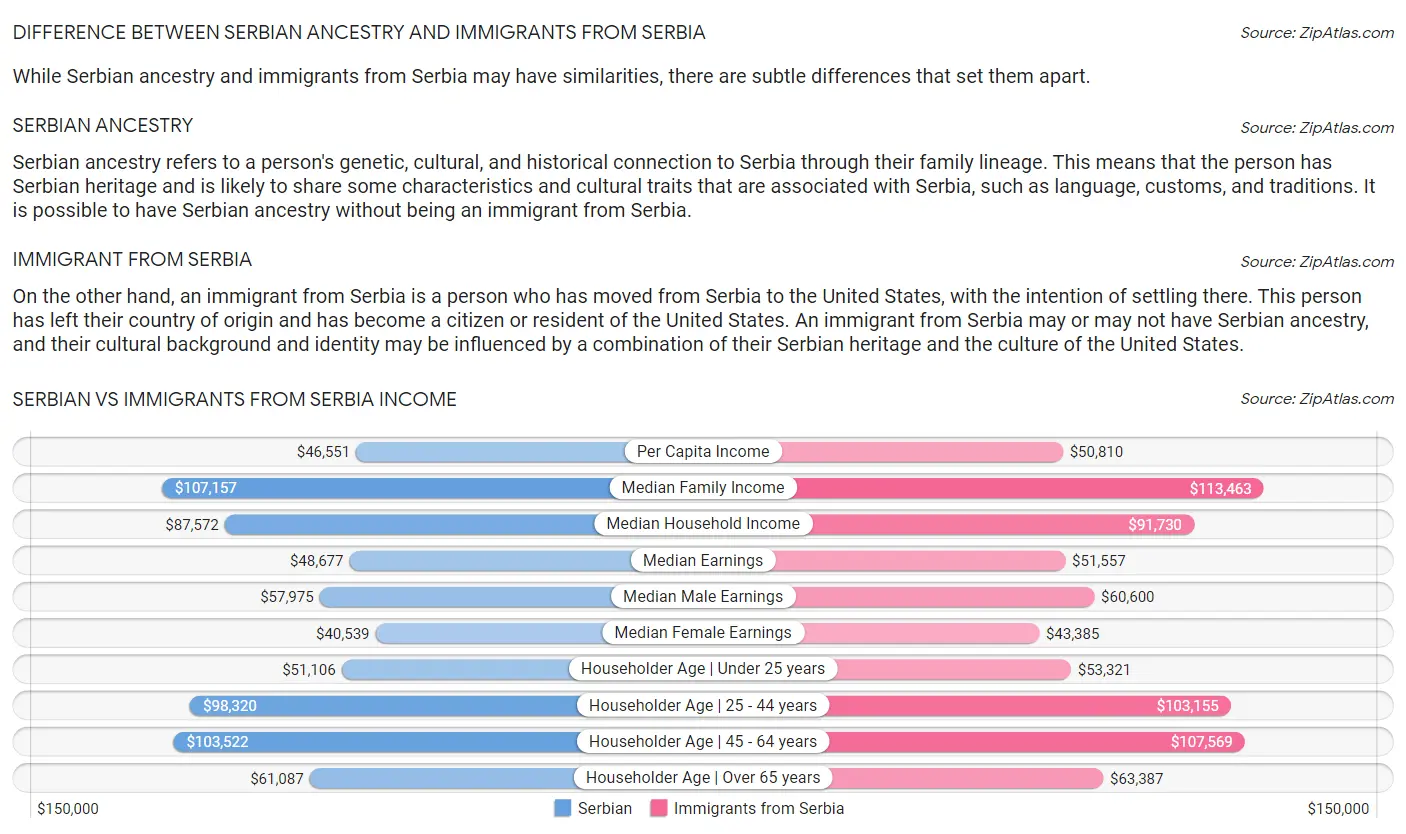
Difference between Serbian Ancestry and Immigrants from Serbia
While Serbian ancestry and immigrants from Serbia may have similarities, there are subtle differences that set them apart.
Serbian Ancestry
Serbian ancestry refers to a person's genetic, cultural, and historical connection to Serbia through their family lineage. This means that the person has Serbian heritage and is likely to share some characteristics and cultural traits that are associated with Serbia, such as language, customs, and traditions. It is possible to have Serbian ancestry without being an immigrant from Serbia.
Immigrant from Serbia
On the other hand, an immigrant from Serbia is a person who has moved from Serbia to the United States, with the intention of settling there. This person has left their country of origin and has become a citizen or resident of the United States. An immigrant from Serbia may or may not have Serbian ancestry, and their cultural background and identity may be influenced by a combination of their Serbian heritage and the culture of the United States.
Serbian vs Immigrants from Serbia Income
When considering income, the most significant differences between Serbian and Immigrants from Serbia communities in the United States are seen in per capita income ($46,551 compared to $50,810, a difference of 9.1%), median female earnings ($40,539 compared to $43,385, a difference of 7.0%), and wage/income gap (27.7% compared to 26.0%, a difference of 6.4%). Conversely, both communities are more comparable in terms of householder income over 65 years ($61,087 compared to $63,387, a difference of 3.8%), householder income ages 45 - 64 years ($103,522 compared to $107,569, a difference of 3.9%), and householder income under 25 years ($51,106 compared to $53,321, a difference of 4.3%).
| Income Metric | Serbian | Immigrants from Serbia |
| Per Capita Income | Exceptional $46,551 | Exceptional $50,810 |
| Median Family Income | Exceptional $107,157 | Exceptional $113,463 |
| Median Household Income | Excellent $87,572 | Exceptional $91,730 |
| Median Earnings | Exceptional $48,677 | Exceptional $51,557 |
| Median Male Earnings | Exceptional $57,975 | Exceptional $60,600 |
| Median Female Earnings | Excellent $40,539 | Exceptional $43,385 |
| Householder Age | Under 25 years | Tragic $51,106 | Exceptional $53,321 |
| Householder Age | 25 - 44 years | Excellent $98,320 | Exceptional $103,155 |
| Householder Age | 45 - 64 years | Excellent $103,522 | Exceptional $107,569 |
| Householder Age | Over 65 years | Average $61,087 | Exceptional $63,387 |
| Wage/Income Gap | Tragic 27.7% | Fair 26.0% |
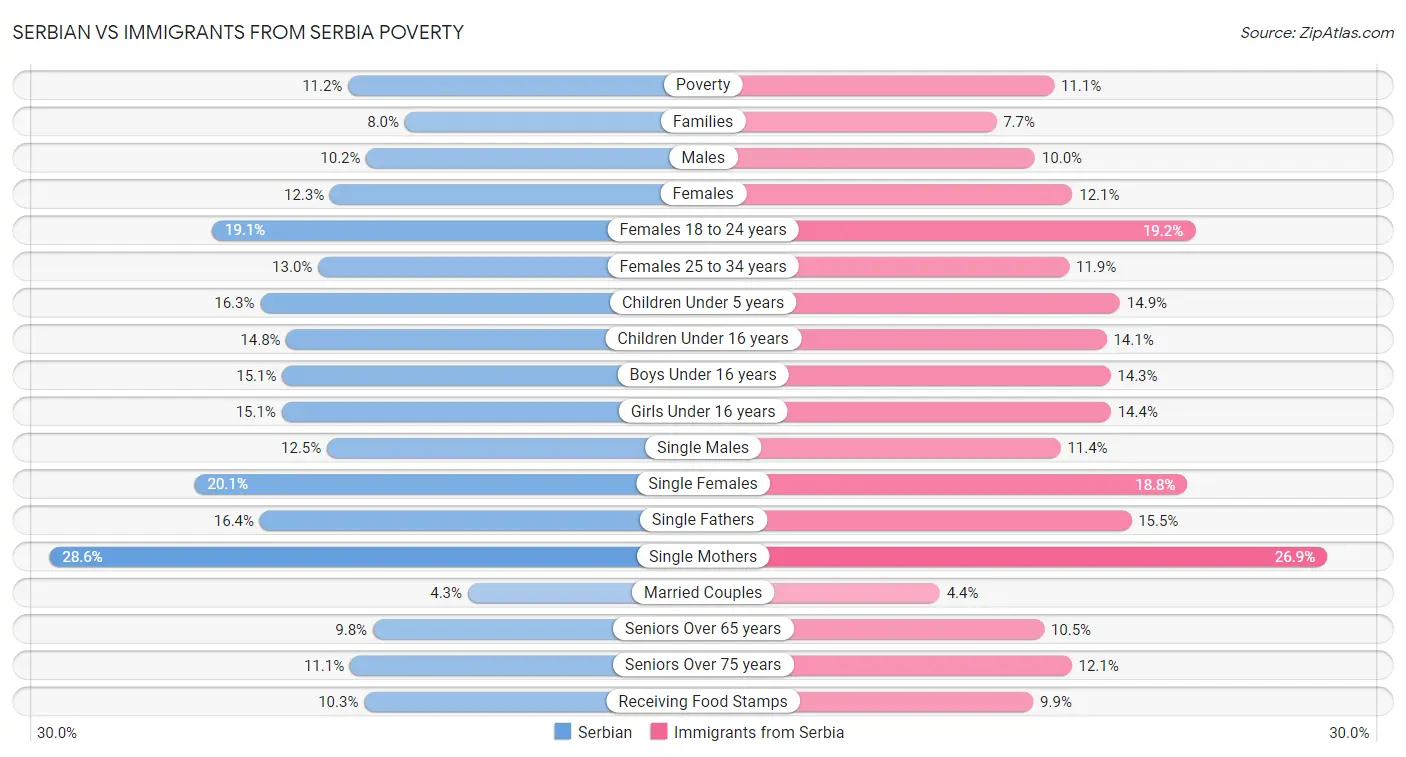
Serbian vs Immigrants from Serbia Poverty
When considering poverty, the most significant differences between Serbian and Immigrants from Serbia communities in the United States are seen in child poverty under the age of 5 (16.3% compared to 14.9%, a difference of 9.7%), single male poverty (12.5% compared to 11.4%, a difference of 8.9%), and female poverty among 25-34 year olds (13.0% compared to 11.9%, a difference of 8.7%). Conversely, both communities are more comparable in terms of female poverty among 18-24 year olds (19.1% compared to 19.2%, a difference of 0.53%), female poverty (12.3% compared to 12.1%, a difference of 1.3%), and poverty (11.2% compared to 11.1%, a difference of 1.5%).
| Poverty Metric | Serbian | Immigrants from Serbia |
| Poverty | Exceptional 11.2% | Exceptional 11.1% |
| Families | Exceptional 8.0% | Exceptional 7.7% |
| Males | Exceptional 10.2% | Exceptional 10.0% |
| Females | Exceptional 12.3% | Exceptional 12.1% |
| Females 18 to 24 years | Exceptional 19.1% | Exceptional 19.2% |
| Females 25 to 34 years | Excellent 13.0% | Exceptional 11.9% |
| Children Under 5 years | Excellent 16.3% | Exceptional 14.9% |
| Children Under 16 years | Exceptional 14.8% | Exceptional 14.1% |
| Boys Under 16 years | Exceptional 15.1% | Exceptional 14.3% |
| Girls Under 16 years | Exceptional 15.1% | Exceptional 14.4% |
| Single Males | Excellent 12.5% | Exceptional 11.4% |
| Single Females | Exceptional 20.1% | Exceptional 18.8% |
| Single Fathers | Average 16.4% | Exceptional 15.5% |
| Single Mothers | Excellent 28.6% | Exceptional 26.9% |
| Married Couples | Exceptional 4.3% | Exceptional 4.4% |
| Seniors Over 65 years | Exceptional 9.8% | Excellent 10.5% |
| Seniors Over 75 years | Exceptional 11.1% | Good 12.1% |
| Receiving Food Stamps | Exceptional 10.3% | Exceptional 9.9% |
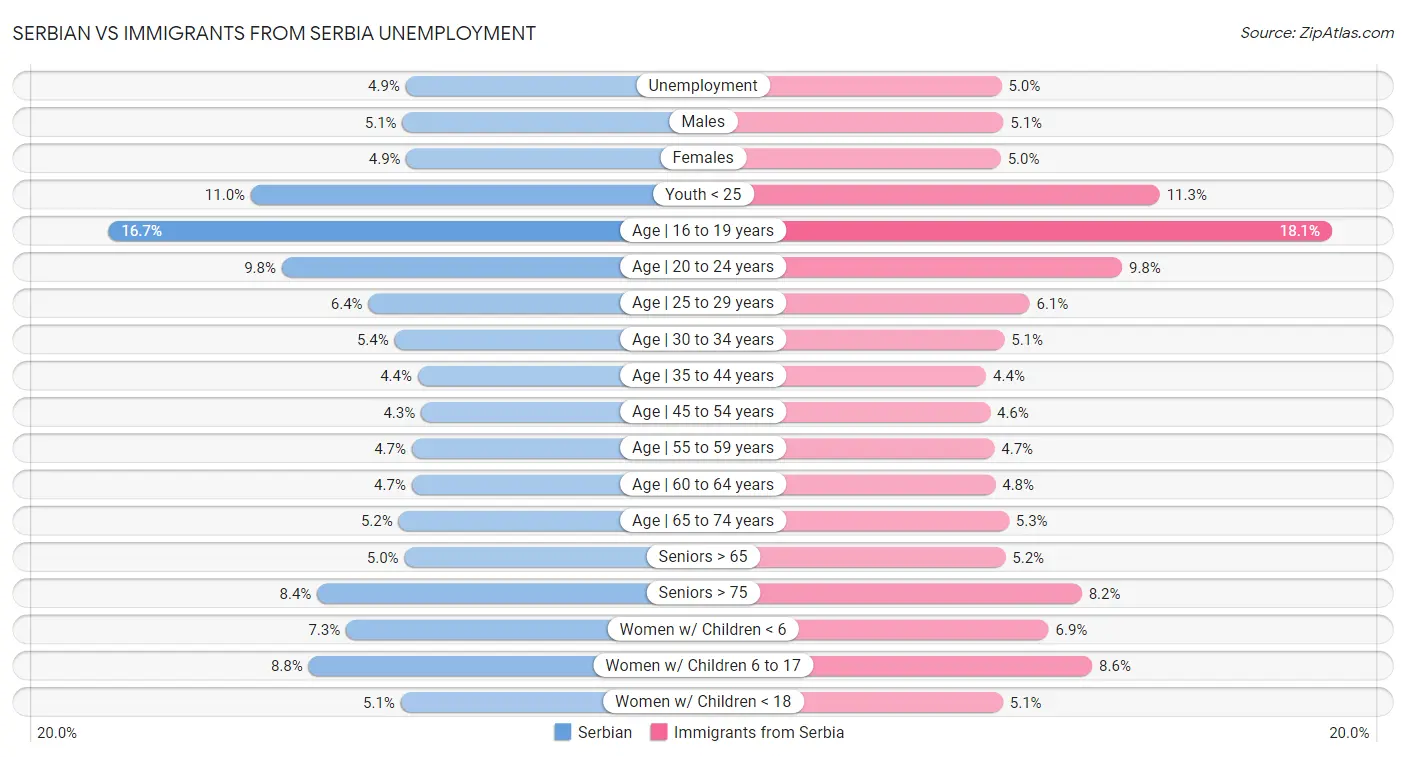
Serbian vs Immigrants from Serbia Unemployment
When considering unemployment, the most significant differences between Serbian and Immigrants from Serbia communities in the United States are seen in unemployment among ages 16 to 19 years (16.7% compared to 18.1%, a difference of 8.4%), unemployment among women with children under 6 years (7.3% compared to 6.9%, a difference of 6.0%), and unemployment among ages 45 to 54 years (4.3% compared to 4.6%, a difference of 5.5%). Conversely, both communities are more comparable in terms of male unemployment (5.1% compared to 5.1%, a difference of 0.48%), unemployment among ages 20 to 24 years (9.8% compared to 9.8%, a difference of 0.53%), and unemployment among ages 55 to 59 years (4.7% compared to 4.7%, a difference of 0.89%).
| Unemployment Metric | Serbian | Immigrants from Serbia |
| Unemployment | Exceptional 4.9% | Exceptional 5.0% |
| Males | Exceptional 5.1% | Exceptional 5.1% |
| Females | Exceptional 4.9% | Exceptional 5.0% |
| Youth < 25 | Exceptional 11.0% | Exceptional 11.3% |
| Age | 16 to 19 years | Exceptional 16.7% | Tragic 18.1% |
| Age | 20 to 24 years | Exceptional 9.8% | Exceptional 9.8% |
| Age | 25 to 29 years | Exceptional 6.4% | Exceptional 6.1% |
| Age | 30 to 34 years | Good 5.4% | Exceptional 5.1% |
| Age | 35 to 44 years | Exceptional 4.4% | Exceptional 4.4% |
| Age | 45 to 54 years | Exceptional 4.3% | Fair 4.6% |
| Age | 55 to 59 years | Exceptional 4.7% | Excellent 4.7% |
| Age | 60 to 64 years | Exceptional 4.7% | Exceptional 4.8% |
| Age | 65 to 74 years | Exceptional 5.2% | Excellent 5.3% |
| Seniors > 65 | Exceptional 5.0% | Average 5.2% |
| Seniors > 75 | Exceptional 8.4% | Exceptional 8.2% |
| Women w/ Children < 6 | Exceptional 7.3% | Exceptional 6.9% |
| Women w/ Children 6 to 17 | Excellent 8.8% | Exceptional 8.6% |
| Women w/ Children < 18 | Exceptional 5.1% | Exceptional 5.1% |
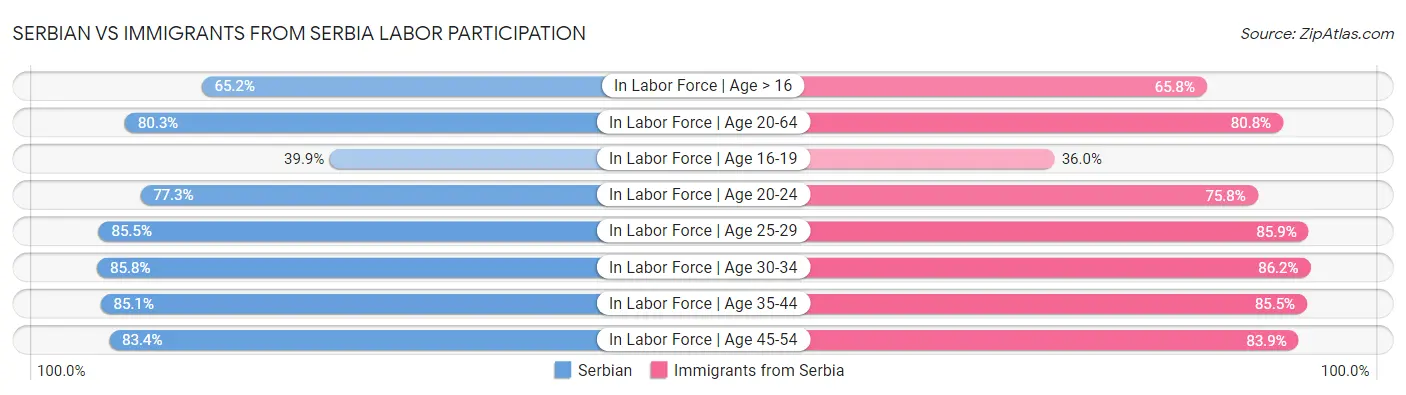
Serbian vs Immigrants from Serbia Labor Participation
When considering labor participation, the most significant differences between Serbian and Immigrants from Serbia communities in the United States are seen in in labor force | age 16-19 (39.9% compared to 36.0%, a difference of 11.1%), in labor force | age 20-24 (77.3% compared to 75.8%, a difference of 1.9%), and in labor force | age > 16 (65.2% compared to 65.8%, a difference of 0.95%). Conversely, both communities are more comparable in terms of in labor force | age 25-29 (85.5% compared to 85.9%, a difference of 0.46%), in labor force | age 30-34 (85.8% compared to 86.2%, a difference of 0.49%), and in labor force | age 35-44 (85.1% compared to 85.5%, a difference of 0.54%).
| Labor Participation Metric | Serbian | Immigrants from Serbia |
| In Labor Force | Age > 16 | Good 65.2% | Exceptional 65.8% |
| In Labor Force | Age 20-64 | Exceptional 80.3% | Exceptional 80.8% |
| In Labor Force | Age 16-19 | Exceptional 39.9% | Fair 36.0% |
| In Labor Force | Age 20-24 | Exceptional 77.3% | Exceptional 75.8% |
| In Labor Force | Age 25-29 | Exceptional 85.5% | Exceptional 85.9% |
| In Labor Force | Age 30-34 | Exceptional 85.8% | Exceptional 86.2% |
| In Labor Force | Age 35-44 | Exceptional 85.1% | Exceptional 85.5% |
| In Labor Force | Age 45-54 | Exceptional 83.4% | Exceptional 83.9% |
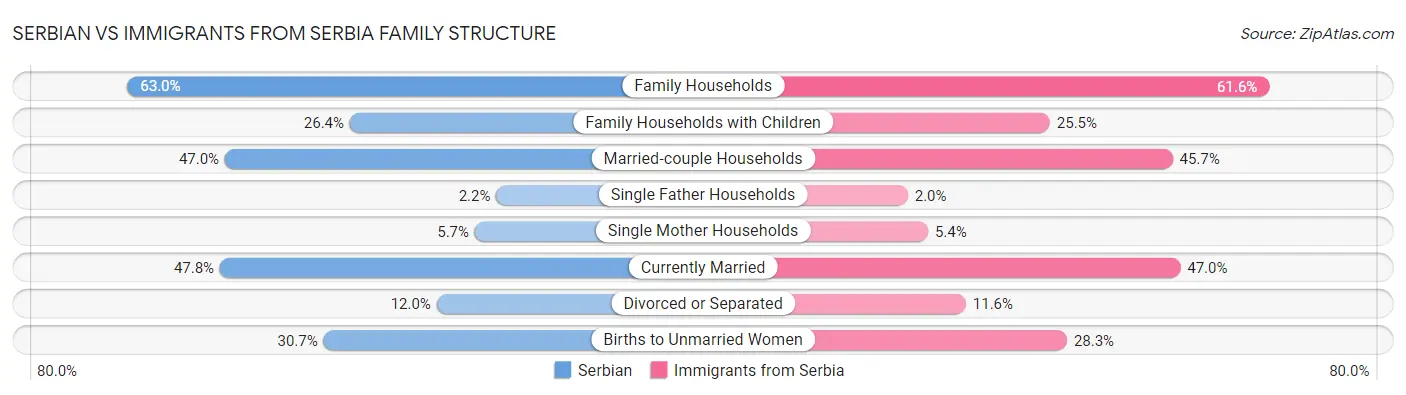
Serbian vs Immigrants from Serbia Family Structure
When considering family structure, the most significant differences between Serbian and Immigrants from Serbia communities in the United States are seen in single father households (2.2% compared to 2.0%, a difference of 8.7%), births to unmarried women (30.7% compared to 28.3%, a difference of 8.5%), and single mother households (5.7% compared to 5.4%, a difference of 7.0%). Conversely, both communities are more comparable in terms of average family size (3.12 compared to 3.13, a difference of 0.29%), currently married (47.8% compared to 47.0%, a difference of 1.7%), and family households (63.0% compared to 61.6%, a difference of 2.3%).
| Family Structure Metric | Serbian | Immigrants from Serbia |
| Family Households | Tragic 63.0% | Tragic 61.6% |
| Family Households with Children | Tragic 26.4% | Tragic 25.5% |
| Married-couple Households | Good 47.0% | Poor 45.7% |
| Average Family Size | Tragic 3.12 | Tragic 3.13 |
| Single Father Households | Exceptional 2.2% | Exceptional 2.0% |
| Single Mother Households | Exceptional 5.7% | Exceptional 5.4% |
| Currently Married | Exceptional 47.8% | Good 47.0% |
| Divorced or Separated | Average 12.0% | Exceptional 11.6% |
| Births to Unmarried Women | Good 30.7% | Exceptional 28.3% |
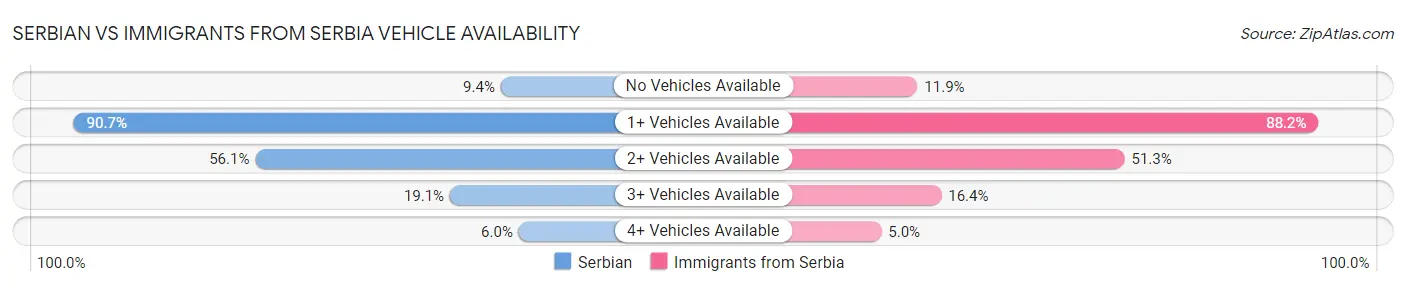
Serbian vs Immigrants from Serbia Vehicle Availability
When considering vehicle availability, the most significant differences between Serbian and Immigrants from Serbia communities in the United States are seen in no vehicles in household (9.4% compared to 11.9%, a difference of 26.2%), 4 or more vehicles in household (6.0% compared to 5.0%, a difference of 19.3%), and 3 or more vehicles in household (19.1% compared to 16.4%, a difference of 16.1%). Conversely, both communities are more comparable in terms of 1 or more vehicles in household (90.7% compared to 88.2%, a difference of 2.9%), 2 or more vehicles in household (56.1% compared to 51.3%, a difference of 9.4%), and 3 or more vehicles in household (19.1% compared to 16.4%, a difference of 16.1%).
| Vehicle Availability Metric | Serbian | Immigrants from Serbia |
| No Vehicles Available | Exceptional 9.4% | Tragic 11.9% |
| 1+ Vehicles Available | Exceptional 90.7% | Tragic 88.2% |
| 2+ Vehicles Available | Excellent 56.1% | Tragic 51.3% |
| 3+ Vehicles Available | Fair 19.1% | Tragic 16.4% |
| 4+ Vehicles Available | Poor 6.0% | Tragic 5.0% |
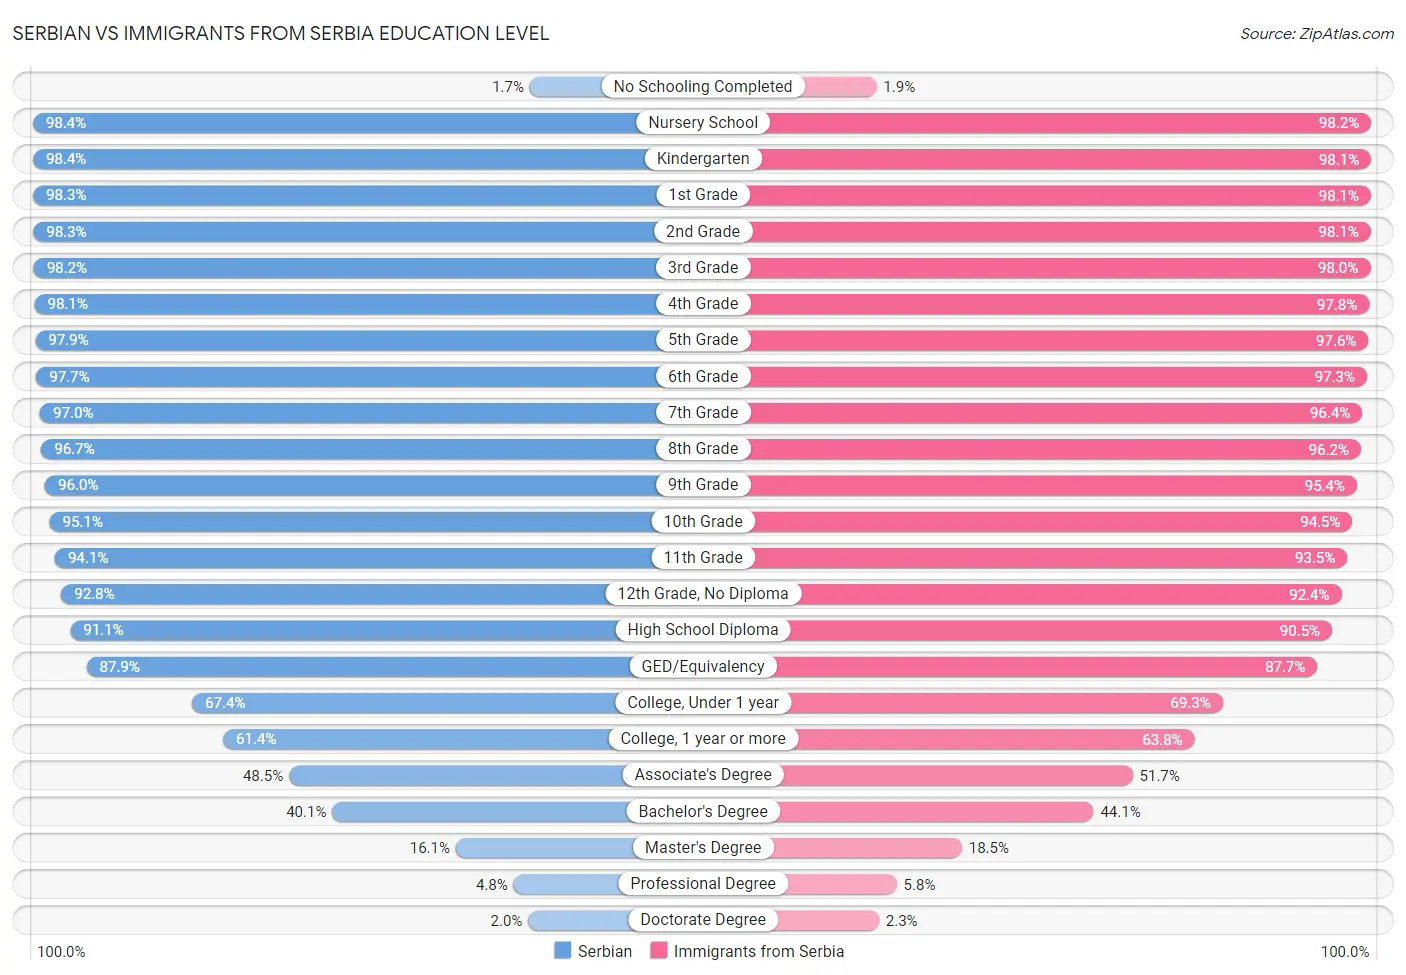
Serbian vs Immigrants from Serbia Education Level
When considering education level, the most significant differences between Serbian and Immigrants from Serbia communities in the United States are seen in professional degree (4.8% compared to 5.8%, a difference of 20.8%), doctorate degree (2.0% compared to 2.3%, a difference of 18.3%), and master's degree (16.1% compared to 18.5%, a difference of 15.0%). Conversely, both communities are more comparable in terms of nursery school (98.4% compared to 98.2%, a difference of 0.23%), kindergarten (98.4% compared to 98.1%, a difference of 0.23%), and 1st grade (98.3% compared to 98.1%, a difference of 0.24%).
| Education Level Metric | Serbian | Immigrants from Serbia |
| No Schooling Completed | Exceptional 1.7% | Exceptional 1.9% |
| Nursery School | Exceptional 98.4% | Exceptional 98.2% |
| Kindergarten | Exceptional 98.4% | Exceptional 98.1% |
| 1st Grade | Exceptional 98.3% | Exceptional 98.1% |
| 2nd Grade | Exceptional 98.3% | Exceptional 98.1% |
| 3rd Grade | Exceptional 98.2% | Exceptional 98.0% |
| 4th Grade | Exceptional 98.1% | Exceptional 97.8% |
| 5th Grade | Exceptional 97.9% | Exceptional 97.6% |
| 6th Grade | Exceptional 97.7% | Exceptional 97.3% |
| 7th Grade | Exceptional 97.0% | Exceptional 96.4% |
| 8th Grade | Exceptional 96.7% | Exceptional 96.2% |
| 9th Grade | Exceptional 96.0% | Exceptional 95.4% |
| 10th Grade | Exceptional 95.1% | Exceptional 94.5% |
| 11th Grade | Exceptional 94.1% | Exceptional 93.5% |
| 12th Grade, No Diploma | Exceptional 92.8% | Exceptional 92.4% |
| High School Diploma | Exceptional 91.1% | Exceptional 90.5% |
| GED/Equivalency | Exceptional 87.9% | Exceptional 87.7% |
| College, Under 1 year | Exceptional 67.4% | Exceptional 69.3% |
| College, 1 year or more | Exceptional 61.4% | Exceptional 63.8% |
| Associate's Degree | Exceptional 48.5% | Exceptional 51.7% |
| Bachelor's Degree | Exceptional 40.1% | Exceptional 44.1% |
| Master's Degree | Exceptional 16.1% | Exceptional 18.5% |
| Professional Degree | Exceptional 4.8% | Exceptional 5.8% |
| Doctorate Degree | Excellent 2.0% | Exceptional 2.3% |
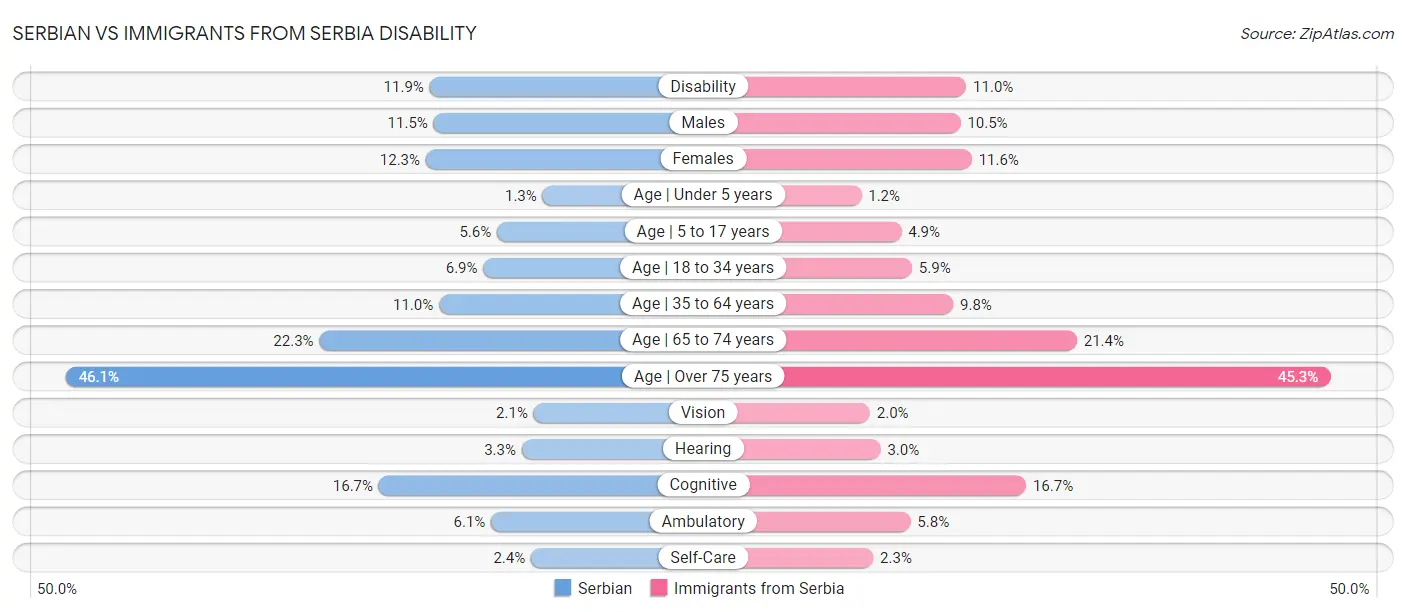
Serbian vs Immigrants from Serbia Disability
When considering disability, the most significant differences between Serbian and Immigrants from Serbia communities in the United States are seen in disability age 18 to 34 (6.9% compared to 5.9%, a difference of 15.6%), disability age 5 to 17 (5.6% compared to 4.9%, a difference of 13.0%), and disability age 35 to 64 (11.0% compared to 9.8%, a difference of 12.4%). Conversely, both communities are more comparable in terms of cognitive disability (16.7% compared to 16.7%, a difference of 0.15%), disability age over 75 (46.1% compared to 45.3%, a difference of 1.9%), and self-care disability (2.4% compared to 2.3%, a difference of 3.8%).
| Disability Metric | Serbian | Immigrants from Serbia |
| Disability | Poor 11.9% | Exceptional 11.0% |
| Males | Poor 11.5% | Exceptional 10.5% |
| Females | Fair 12.3% | Exceptional 11.6% |
| Age | Under 5 years | Tragic 1.3% | Excellent 1.2% |
| Age | 5 to 17 years | Average 5.6% | Exceptional 4.9% |
| Age | 18 to 34 years | Tragic 6.9% | Exceptional 5.9% |
| Age | 35 to 64 years | Good 11.0% | Exceptional 9.8% |
| Age | 65 to 74 years | Exceptional 22.3% | Exceptional 21.4% |
| Age | Over 75 years | Exceptional 46.1% | Exceptional 45.3% |
| Vision | Good 2.1% | Exceptional 2.0% |
| Hearing | Tragic 3.3% | Average 3.0% |
| Cognitive | Exceptional 16.7% | Exceptional 16.7% |
| Ambulatory | Average 6.1% | Exceptional 5.8% |
| Self-Care | Exceptional 2.4% | Exceptional 2.3% |