Zip Codes with the Highest Percentage of Population Employed in Health Diagnosing & Treating in Hesperia, CA
RELATED REPORTS & OPTIONS
Health Diagnosing & Treating
Hesperia
Compare Zip Codes
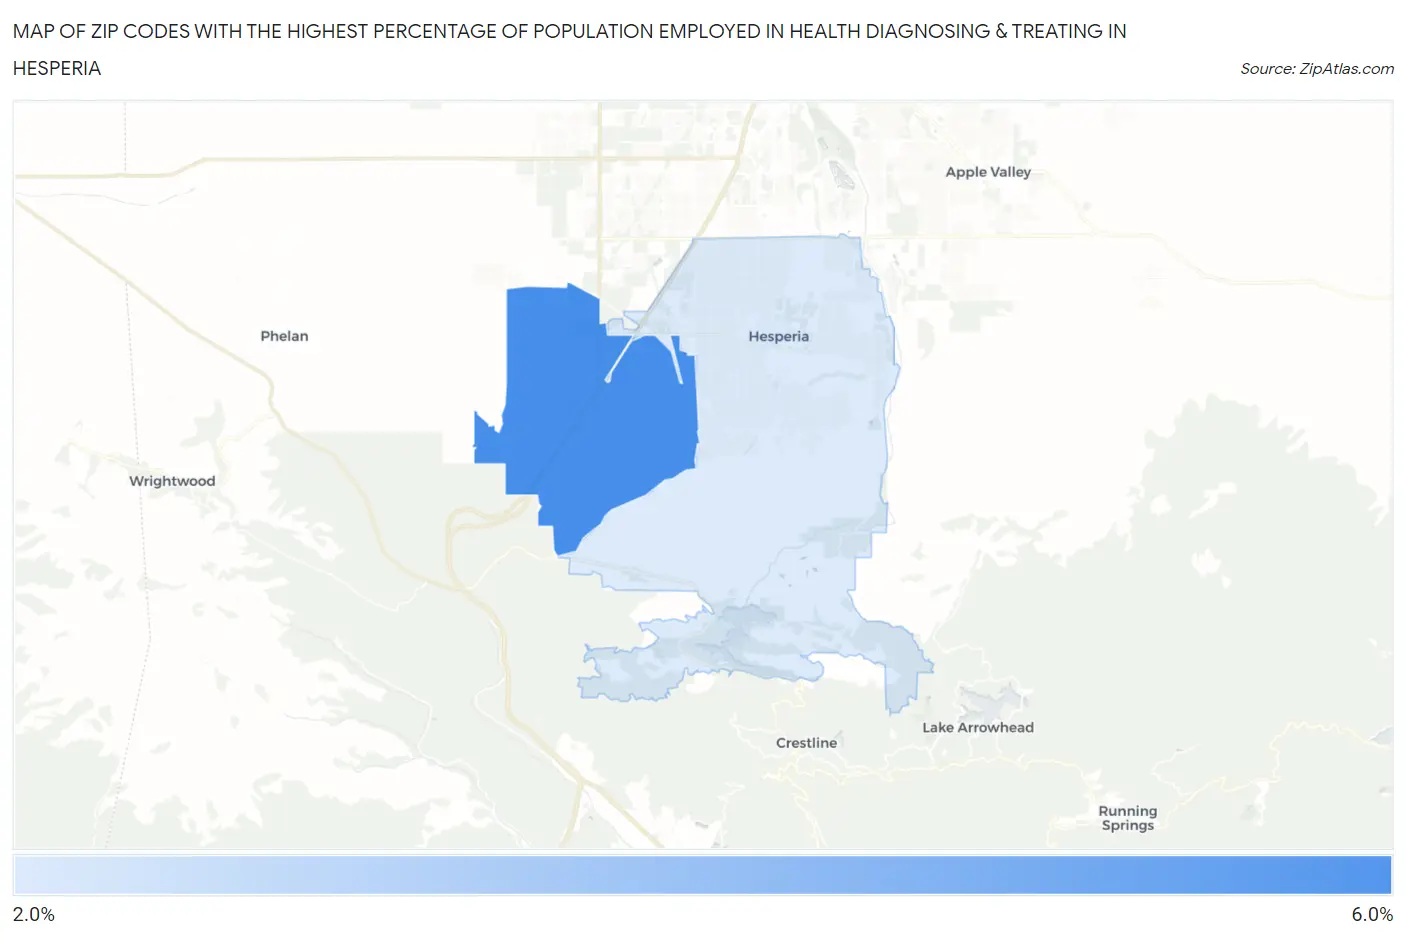
Map of Zip Codes with the Highest Percentage of Population Employed in Health Diagnosing & Treating in Hesperia
0.0%
6.0%
Zip Codes with the Highest Percentage of Population Employed in Health Diagnosing & Treating in Hesperia, CA
| Zip Code | % Employed | vs State | vs National | |
| 1. | 92344 | 5.6% | 5.3%(+0.332)#645 | 6.2%(-0.602)#15,216 |
| 2. | 92345 | 2.7% | 5.3%(-2.57)#1,240 | 6.2%(-3.50)#24,945 |
1
Common Questions
What are the Top Zip Codes with the Highest Percentage of Population Employed in Health Diagnosing & Treating in Hesperia, CA?
Top Zip Codes with the Highest Percentage of Population Employed in Health Diagnosing & Treating in Hesperia, CA are:
What zip code has the Highest Percentage of Population Employed in Health Diagnosing & Treating in Hesperia, CA?
92344 has the Highest Percentage of Population Employed in Health Diagnosing & Treating in Hesperia, CA with 5.6%.
What is the Percentage of Population Employed in Health Diagnosing & Treating in Hesperia, CA?
Percentage of Population Employed in Health Diagnosing & Treating in Hesperia is 3.0%.
What is the Percentage of Population Employed in Health Diagnosing & Treating in California?
Percentage of Population Employed in Health Diagnosing & Treating in California is 5.3%.
What is the Percentage of Population Employed in Health Diagnosing & Treating in the United States?
Percentage of Population Employed in Health Diagnosing & Treating in the United States is 6.2%.