Zip Codes with the Highest Percentage of Population Employed in Health Diagnosing & Treating in Apple Valley, CA
RELATED REPORTS & OPTIONS
Health Diagnosing & Treating
Apple Valley
Compare Zip Codes
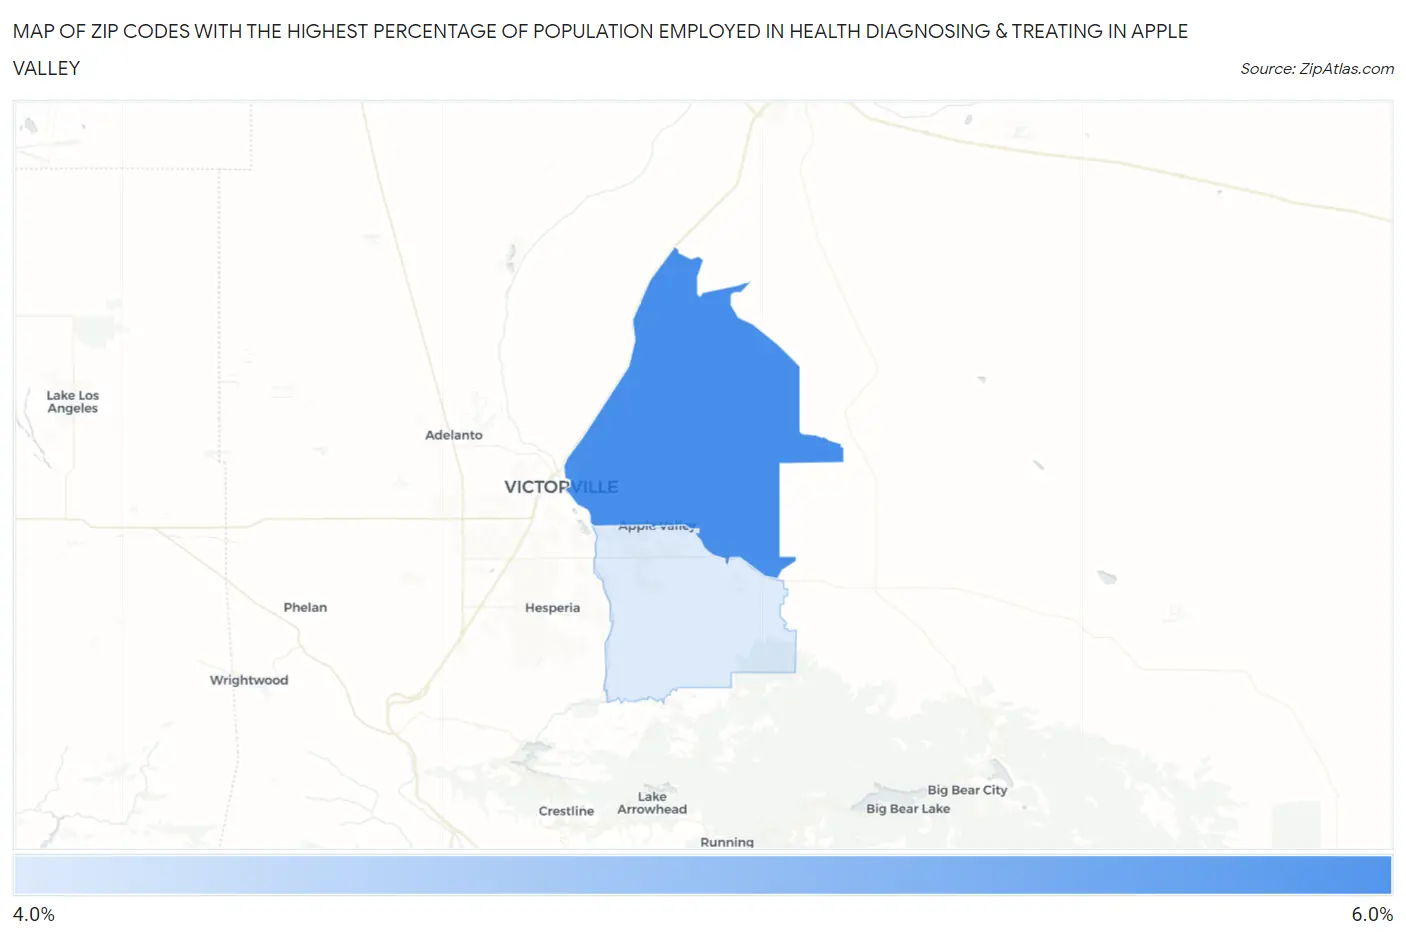
Map of Zip Codes with the Highest Percentage of Population Employed in Health Diagnosing & Treating in Apple Valley
0.0%
6.0%
Zip Codes with the Highest Percentage of Population Employed in Health Diagnosing & Treating in Apple Valley, CA
| Zip Code | % Employed | vs State | vs National | |
| 1. | 92307 | 6.0% | 5.3%(+0.645)#577 | 6.2%(-0.289)#14,028 |
| 2. | 92308 | 4.4% | 5.3%(-0.905)#921 | 6.2%(-1.84)#19,980 |
1
Common Questions
What are the Top Zip Codes with the Highest Percentage of Population Employed in Health Diagnosing & Treating in Apple Valley, CA?
Top Zip Codes with the Highest Percentage of Population Employed in Health Diagnosing & Treating in Apple Valley, CA are:
What zip code has the Highest Percentage of Population Employed in Health Diagnosing & Treating in Apple Valley, CA?
92307 has the Highest Percentage of Population Employed in Health Diagnosing & Treating in Apple Valley, CA with 6.0%.
What is the Percentage of Population Employed in Health Diagnosing & Treating in Apple Valley, CA?
Percentage of Population Employed in Health Diagnosing & Treating in Apple Valley is 5.1%.
What is the Percentage of Population Employed in Health Diagnosing & Treating in California?
Percentage of Population Employed in Health Diagnosing & Treating in California is 5.3%.
What is the Percentage of Population Employed in Health Diagnosing & Treating in the United States?
Percentage of Population Employed in Health Diagnosing & Treating in the United States is 6.2%.