Zip Codes with the Highest Percentage of Population Employed in Health Diagnosing & Treating in Eureka, CA
RELATED REPORTS & OPTIONS
Health Diagnosing & Treating
Eureka
Compare Zip Codes
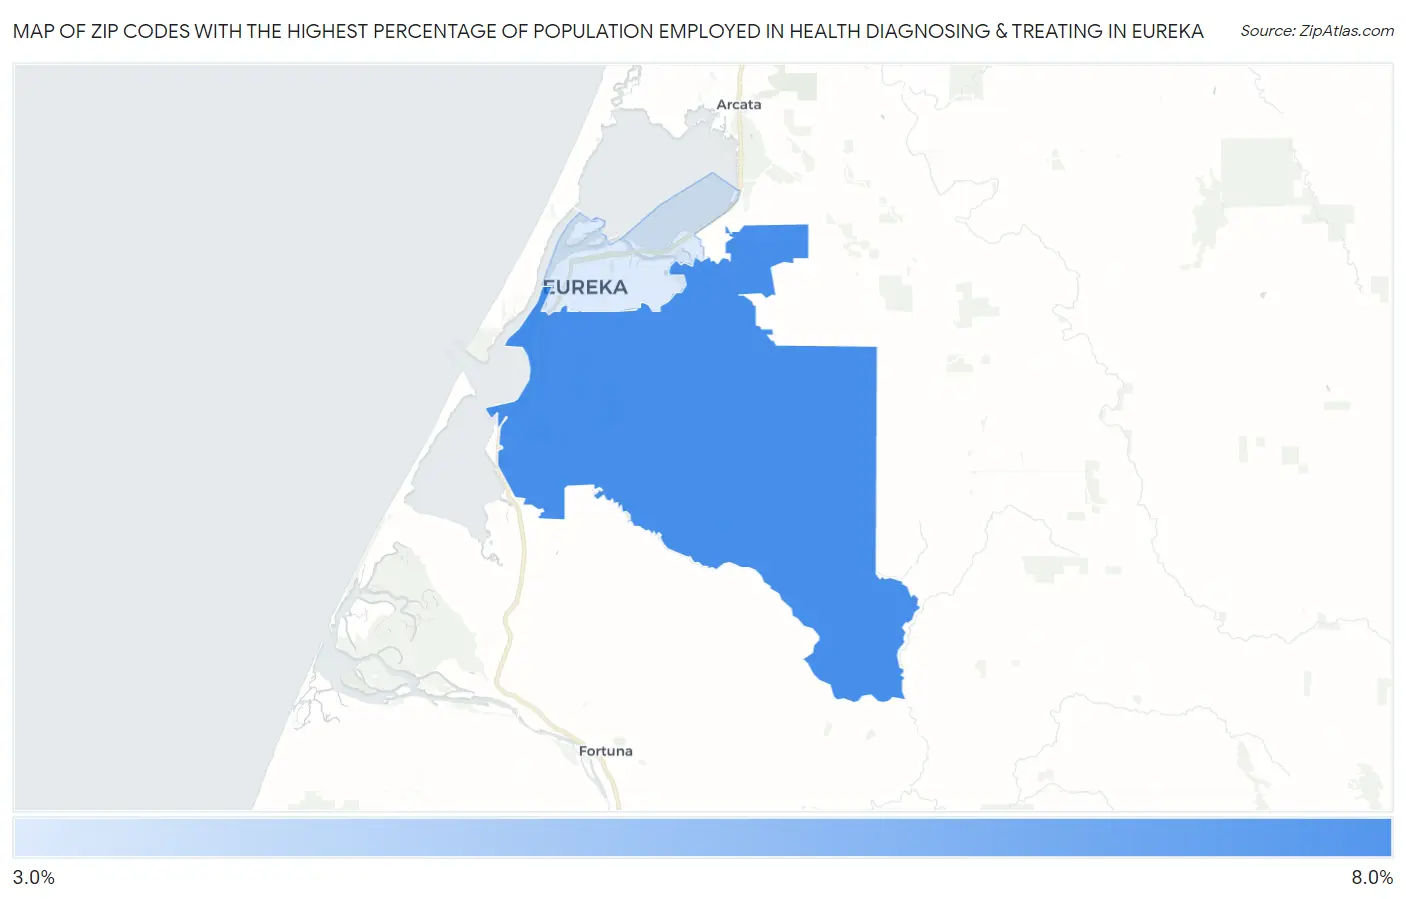
Map of Zip Codes with the Highest Percentage of Population Employed in Health Diagnosing & Treating in Eureka
0.0%
8.0%
Zip Codes with the Highest Percentage of Population Employed in Health Diagnosing & Treating in Eureka, CA
| Zip Code | % Employed | vs State | vs National | |
| 1. | 95503 | 6.2% | 5.3%(+0.920)#523 | 6.2%(-0.014)#13,043 |
| 2. | 95501 | 3.6% | 5.3%(-1.70)#1,090 | 6.2%(-2.64)#22,590 |
1
Common Questions
What are the Top Zip Codes with the Highest Percentage of Population Employed in Health Diagnosing & Treating in Eureka, CA?
Top Zip Codes with the Highest Percentage of Population Employed in Health Diagnosing & Treating in Eureka, CA are:
What zip code has the Highest Percentage of Population Employed in Health Diagnosing & Treating in Eureka, CA?
95503 has the Highest Percentage of Population Employed in Health Diagnosing & Treating in Eureka, CA with 6.2%.
What is the Percentage of Population Employed in Health Diagnosing & Treating in Eureka, CA?
Percentage of Population Employed in Health Diagnosing & Treating in Eureka is 4.3%.
What is the Percentage of Population Employed in Health Diagnosing & Treating in California?
Percentage of Population Employed in Health Diagnosing & Treating in California is 5.3%.
What is the Percentage of Population Employed in Health Diagnosing & Treating in the United States?
Percentage of Population Employed in Health Diagnosing & Treating in the United States is 6.2%.