Zip Codes with the Highest Percentage of Population with a Degree in Science and Engineering in Hesperia, CA
RELATED REPORTS & OPTIONS
Science and Engineering
Hesperia
Compare Zip Codes
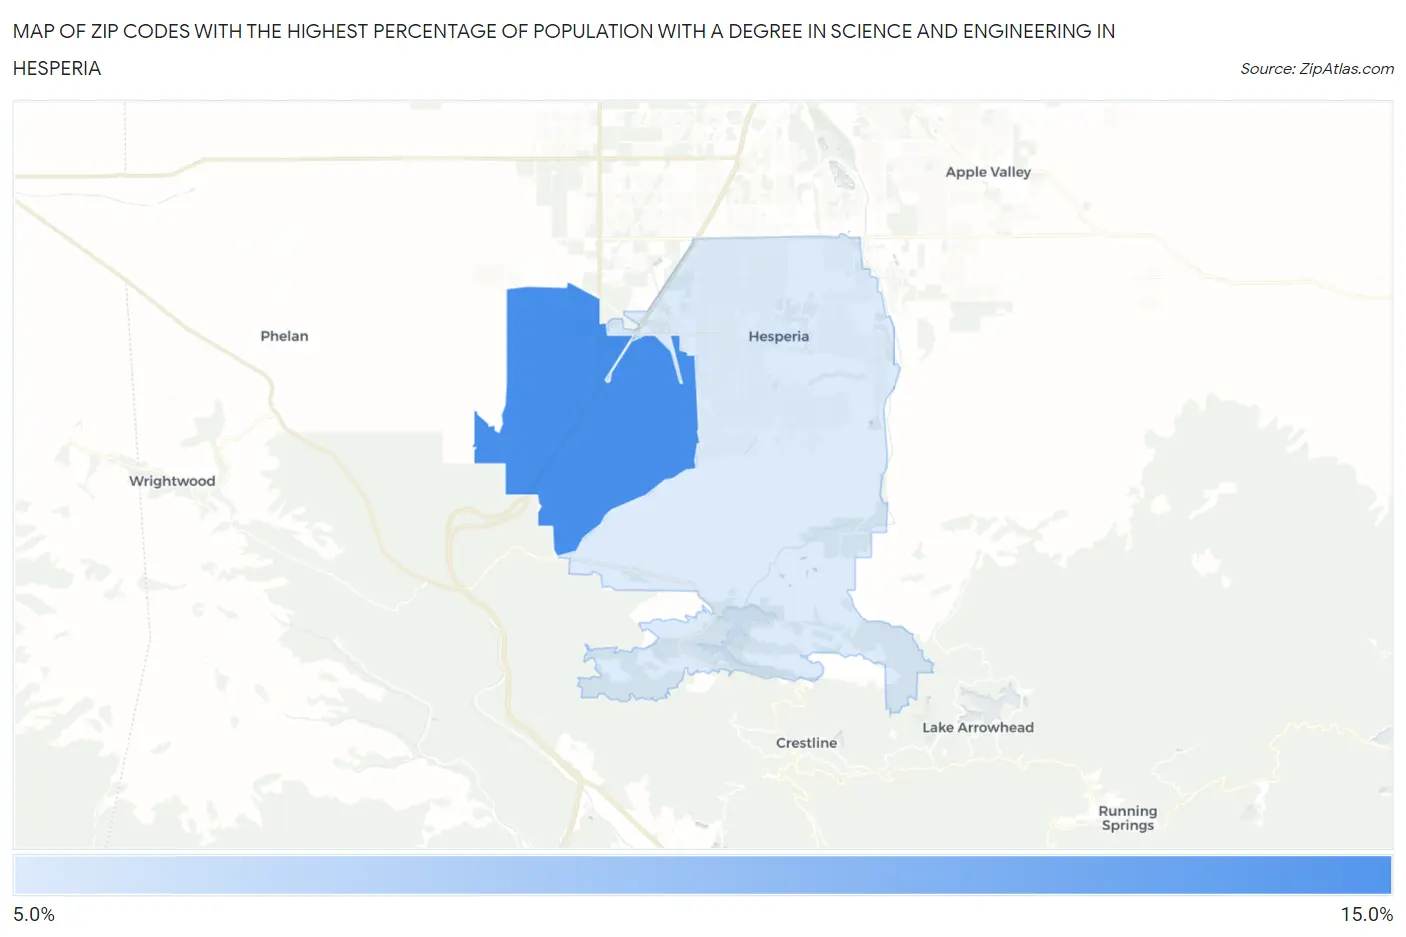
Map of Zip Codes with the Highest Percentage of Population with a Degree in Science and Engineering in Hesperia
0.0%
15.0%
Zip Codes with the Highest Percentage of Population with a Degree in Science and Engineering in Hesperia, CA
| Zip Code | % Graduates | vs State | vs National | |
| 1. | 92344 | 11.5% | 8.3%(+3.21)#324 | 9.8%(+1.69)#11,891 |
| 2. | 92345 | 10.0% | 8.3%(+1.69)#481 | 9.8%(+0.169)#15,139 |
1
Common Questions
What are the Top Zip Codes with the Highest Percentage of Population with a Degree in Science and Engineering in Hesperia, CA?
Top Zip Codes with the Highest Percentage of Population with a Degree in Science and Engineering in Hesperia, CA are:
What zip code has the Highest Percentage of Population with a Degree in Science and Engineering in Hesperia, CA?
92344 has the Highest Percentage of Population with a Degree in Science and Engineering in Hesperia, CA with 11.5%.
What is the Percentage of Population with a Degree in Science and Engineering in Hesperia, CA?
Percentage of Population with a Degree in Science and Engineering in Hesperia is 10.7%.
What is the Percentage of Population with a Degree in Science and Engineering in California?
Percentage of Population with a Degree in Science and Engineering in California is 8.3%.
What is the Percentage of Population with a Degree in Science and Engineering in the United States?
Percentage of Population with a Degree in Science and Engineering in the United States is 9.8%.