Zip Codes with the Highest Percentage of Population Employed in Health Diagnosing & Treating in San Francisco, CA
RELATED REPORTS & OPTIONS
Health Diagnosing & Treating
San Francisco
Compare Zip Codes
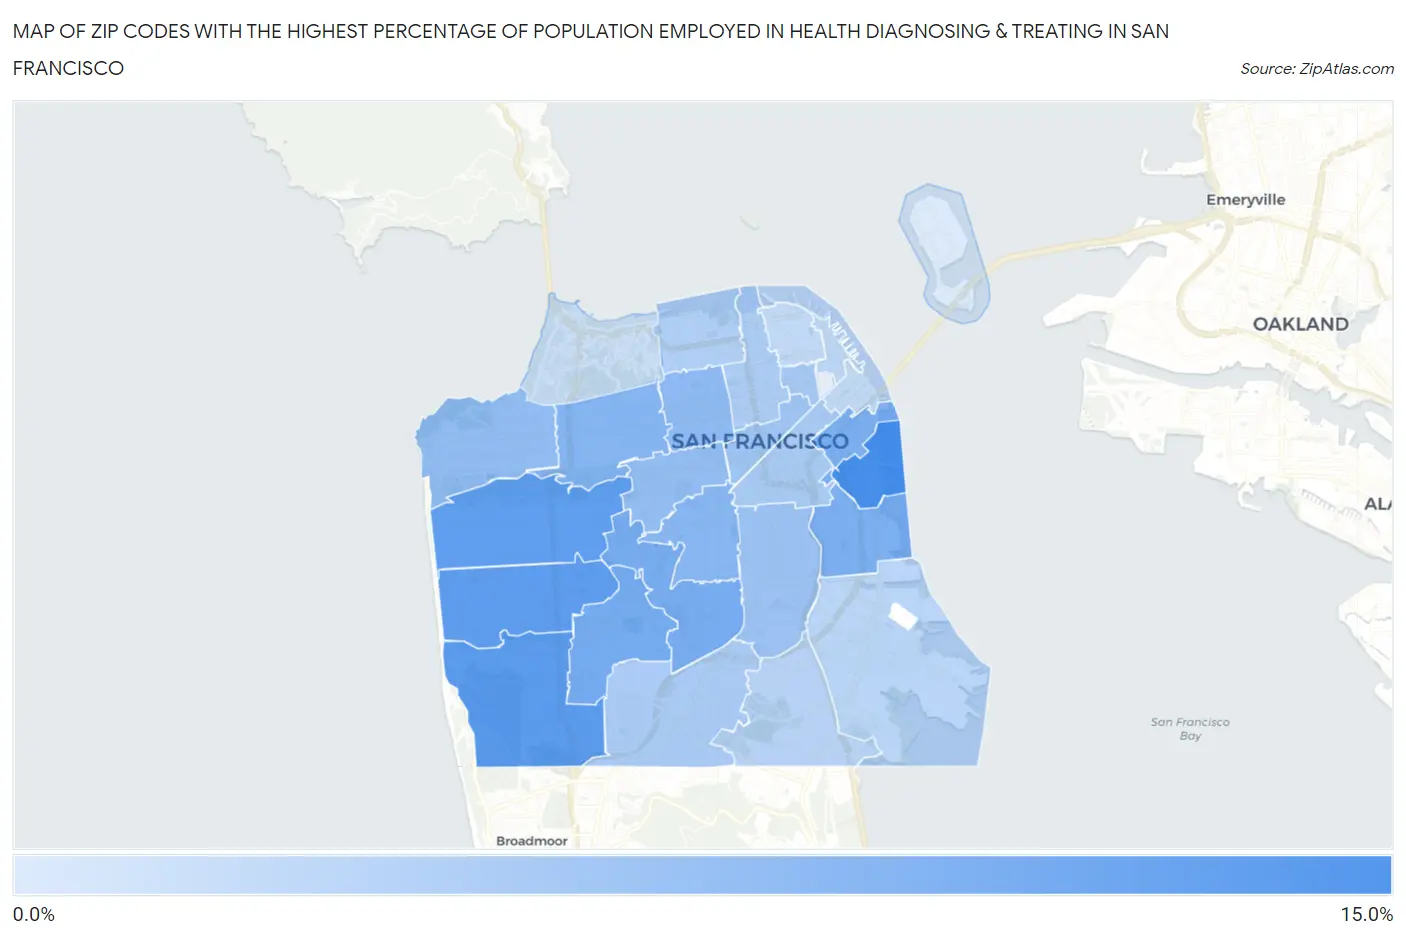
Map of Zip Codes with the Highest Percentage of Population Employed in Health Diagnosing & Treating in San Francisco
0.0%
15.0%
Zip Codes with the Highest Percentage of Population Employed in Health Diagnosing & Treating in San Francisco, CA
| Zip Code | % Employed | vs State | vs National | |
| 1. | 94158 | 10.1% | 5.3%(+4.82)#122 | 6.2%(+3.89)#3,721 |
| 2. | 94132 | 9.0% | 5.3%(+3.72)#171 | 6.2%(+2.79)#5,314 |
| 3. | 94116 | 8.7% | 5.3%(+3.38)#193 | 6.2%(+2.45)#5,951 |
| 4. | 94122 | 8.6% | 5.3%(+3.26)#205 | 6.2%(+2.33)#6,182 |
| 5. | 94127 | 7.4% | 5.3%(+2.06)#330 | 6.2%(+1.12)#9,207 |
| 6. | 94131 | 7.3% | 5.3%(+1.99)#342 | 6.2%(+1.05)#9,427 |
| 7. | 94107 | 7.0% | 5.3%(+1.67)#385 | 6.2%(+0.738)#10,409 |
| 8. | 94118 | 6.4% | 5.3%(+1.08)#488 | 6.2%(+0.148)#12,408 |
| 9. | 94114 | 6.3% | 5.3%(+0.954)#513 | 6.2%(+0.021)#12,884 |
| 10. | 94115 | 5.9% | 5.3%(+0.611)#580 | 6.2%(-0.322)#14,134 |
| 11. | 94121 | 5.8% | 5.3%(+0.526)#600 | 6.2%(-0.408)#14,466 |
| 12. | 94117 | 5.7% | 5.3%(+0.356)#635 | 6.2%(-0.578)#15,115 |
| 13. | 94110 | 5.1% | 5.3%(-0.199)#755 | 6.2%(-1.13)#17,285 |
| 14. | 94102 | 5.0% | 5.3%(-0.330)#798 | 6.2%(-1.26)#17,800 |
| 15. | 94108 | 4.6% | 5.3%(-0.693)#871 | 6.2%(-1.63)#19,183 |
| 16. | 94103 | 4.5% | 5.3%(-0.856)#905 | 6.2%(-1.79)#19,800 |
| 17. | 94112 | 4.3% | 5.3%(-0.964)#935 | 6.2%(-1.90)#20,188 |
| 18. | 94109 | 4.2% | 5.3%(-1.16)#978 | 6.2%(-2.09)#20,882 |
| 19. | 94123 | 3.9% | 5.3%(-1.43)#1,041 | 6.2%(-2.36)#21,742 |
| 20. | 94134 | 3.5% | 5.3%(-1.76)#1,104 | 6.2%(-2.70)#22,769 |
| 21. | 94124 | 3.4% | 5.3%(-1.95)#1,133 | 6.2%(-2.88)#23,298 |
| 22. | 94111 | 3.2% | 5.3%(-2.08)#1,154 | 6.2%(-3.02)#23,686 |
| 23. | 94133 | 3.0% | 5.3%(-2.30)#1,191 | 6.2%(-3.24)#24,292 |
| 24. | 94105 | 3.0% | 5.3%(-2.32)#1,193 | 6.2%(-3.25)#24,326 |
| 25. | 94129 | 2.4% | 5.3%(-2.89)#1,289 | 6.2%(-3.82)#25,686 |
| 26. | 94130 | 1.5% | 5.3%(-3.82)#1,401 | 6.2%(-4.75)#27,221 |
1
Common Questions
What are the Top 10 Zip Codes with the Highest Percentage of Population Employed in Health Diagnosing & Treating in San Francisco, CA?
Top 10 Zip Codes with the Highest Percentage of Population Employed in Health Diagnosing & Treating in San Francisco, CA are:
What zip code has the Highest Percentage of Population Employed in Health Diagnosing & Treating in San Francisco, CA?
94158 has the Highest Percentage of Population Employed in Health Diagnosing & Treating in San Francisco, CA with 10.1%.
What is the Percentage of Population Employed in Health Diagnosing & Treating in San Francisco, CA?
Percentage of Population Employed in Health Diagnosing & Treating in San Francisco is 5.6%.
What is the Percentage of Population Employed in Health Diagnosing & Treating in California?
Percentage of Population Employed in Health Diagnosing & Treating in California is 5.3%.
What is the Percentage of Population Employed in Health Diagnosing & Treating in the United States?
Percentage of Population Employed in Health Diagnosing & Treating in the United States is 6.2%.