Zip Codes with the Highest Percentage of Population Employed in Health Diagnosing & Treating in Danville, CA
RELATED REPORTS & OPTIONS
Health Diagnosing & Treating
Danville
Compare Zip Codes
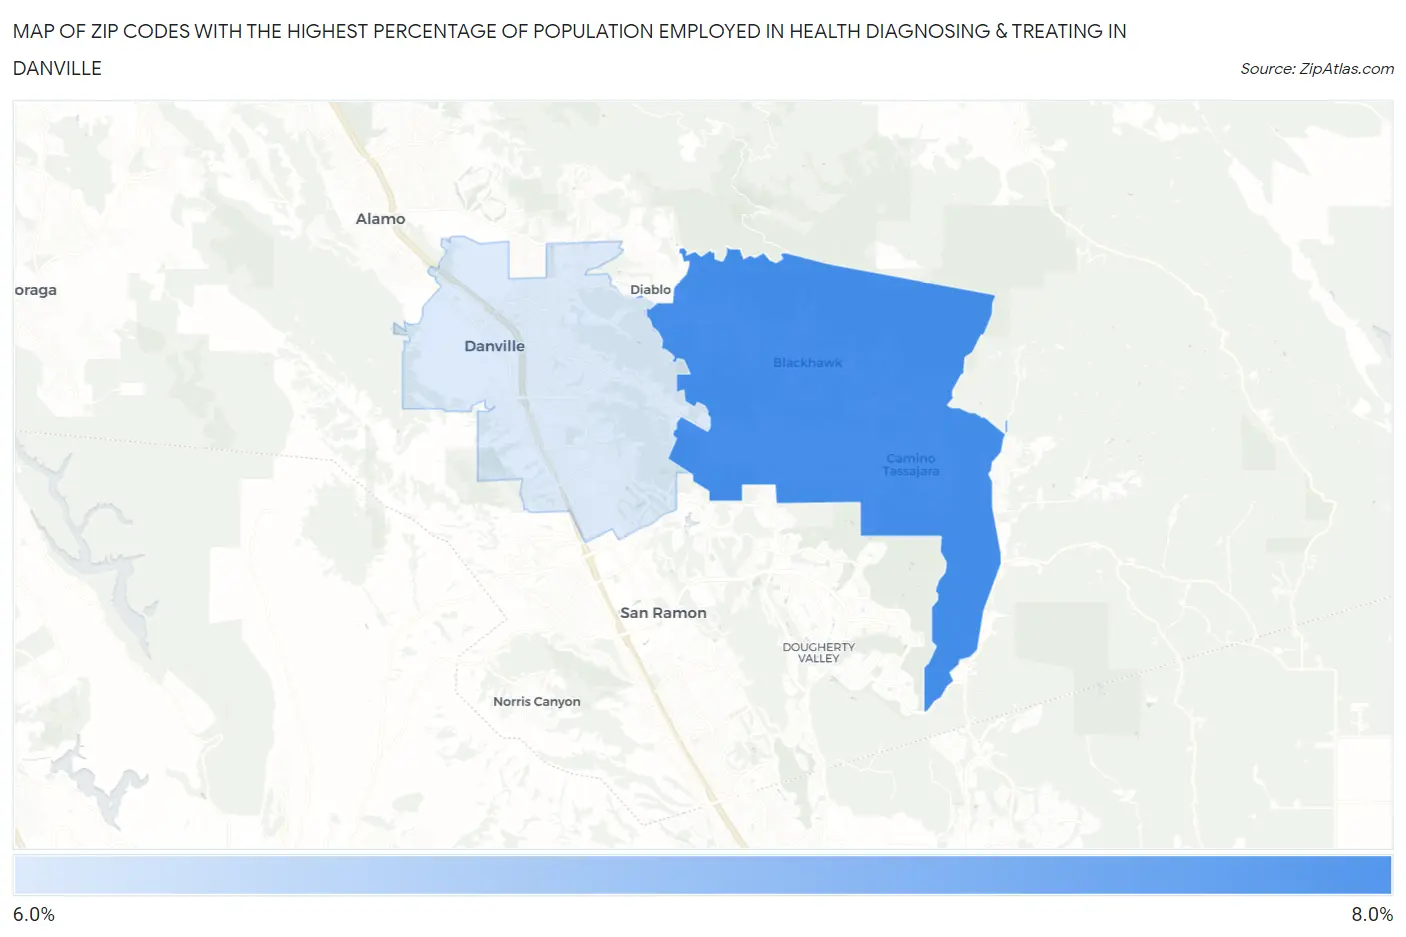
Map of Zip Codes with the Highest Percentage of Population Employed in Health Diagnosing & Treating in Danville
0.0%
8.0%
Zip Codes with the Highest Percentage of Population Employed in Health Diagnosing & Treating in Danville, CA
| Zip Code | % Employed | vs State | vs National | |
| 1. | 94506 | 7.6% | 5.3%(+2.30)#292 | 6.2%(+1.37)#8,486 |
| 2. | 94526 | 6.0% | 5.3%(+0.714)#564 | 6.2%(-0.219)#13,784 |
1
Common Questions
What are the Top Zip Codes with the Highest Percentage of Population Employed in Health Diagnosing & Treating in Danville, CA?
Top Zip Codes with the Highest Percentage of Population Employed in Health Diagnosing & Treating in Danville, CA are:
What zip code has the Highest Percentage of Population Employed in Health Diagnosing & Treating in Danville, CA?
94506 has the Highest Percentage of Population Employed in Health Diagnosing & Treating in Danville, CA with 7.6%.
What is the Percentage of Population Employed in Health Diagnosing & Treating in Danville, CA?
Percentage of Population Employed in Health Diagnosing & Treating in Danville is 6.7%.
What is the Percentage of Population Employed in Health Diagnosing & Treating in California?
Percentage of Population Employed in Health Diagnosing & Treating in California is 5.3%.
What is the Percentage of Population Employed in Health Diagnosing & Treating in the United States?
Percentage of Population Employed in Health Diagnosing & Treating in the United States is 6.2%.