Zip Codes with the Highest Percentage of Population Employed in Farming, Fishing & Forestry in Hesperia, CA
RELATED REPORTS & OPTIONS
Farming, Fishing & Forestry
Hesperia
Compare Zip Codes
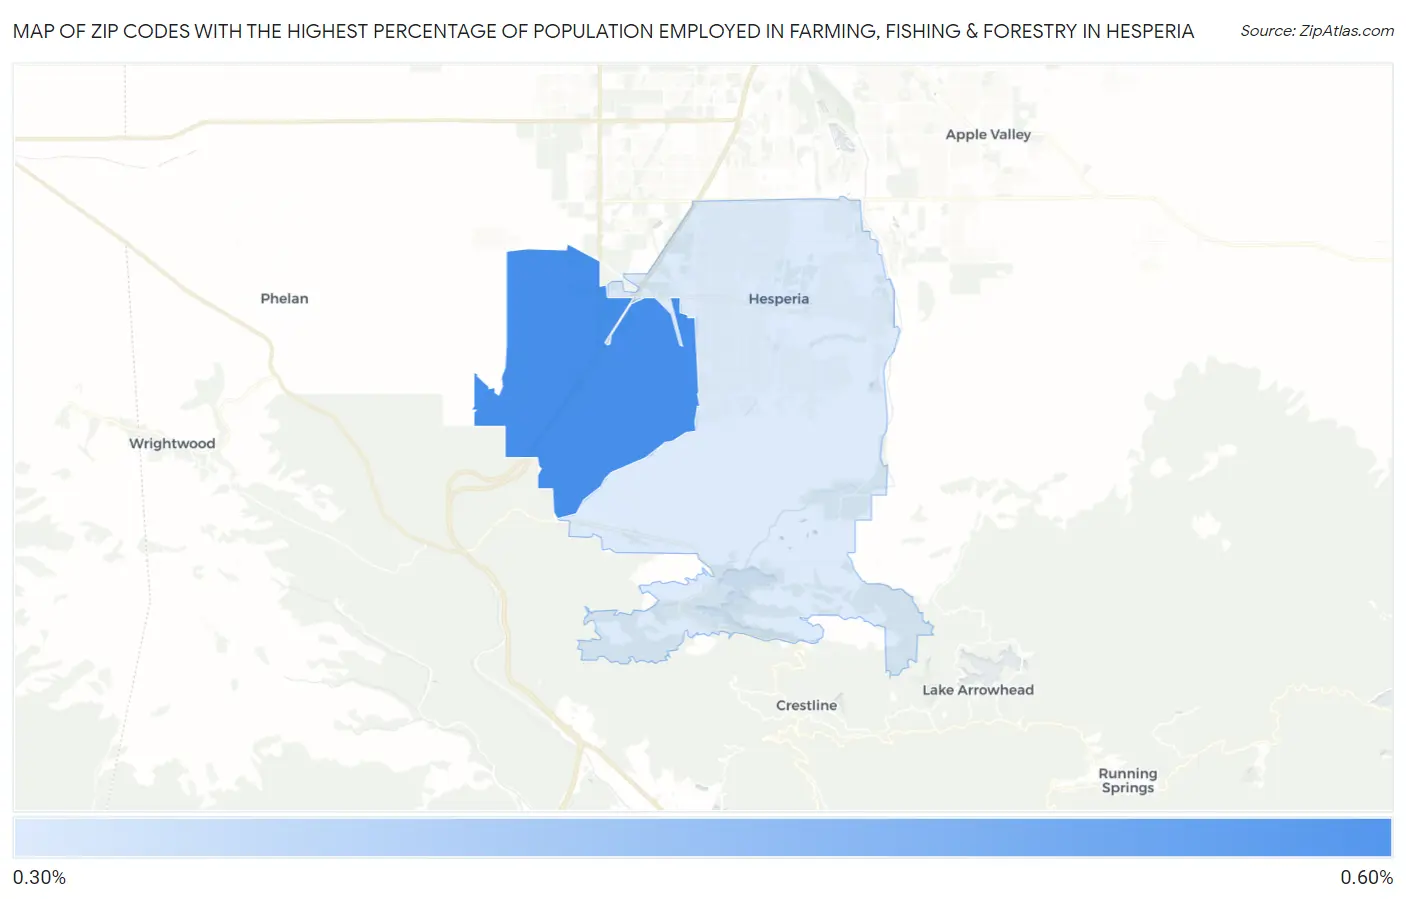
Map of Zip Codes with the Highest Percentage of Population Employed in Farming, Fishing & Forestry in Hesperia
0.0%
0.60%
Zip Codes with the Highest Percentage of Population Employed in Farming, Fishing & Forestry in Hesperia, CA
| Zip Code | % Employed | vs State | vs National | |
| 1. | 92344 | 0.51% | 1.4%(-0.901)#683 | 0.61%(-0.096)#12,764 |
| 2. | 92345 | 0.30% | 1.4%(-1.11)#840 | 0.61%(-0.302)#14,780 |
1
Common Questions
What are the Top Zip Codes with the Highest Percentage of Population Employed in Farming, Fishing & Forestry in Hesperia, CA?
Top Zip Codes with the Highest Percentage of Population Employed in Farming, Fishing & Forestry in Hesperia, CA are:
What zip code has the Highest Percentage of Population Employed in Farming, Fishing & Forestry in Hesperia, CA?
92344 has the Highest Percentage of Population Employed in Farming, Fishing & Forestry in Hesperia, CA with 0.51%.
What is the Percentage of Population Employed in Farming, Fishing & Forestry in Hesperia, CA?
Percentage of Population Employed in Farming, Fishing & Forestry in Hesperia is 0.27%.
What is the Percentage of Population Employed in Farming, Fishing & Forestry in California?
Percentage of Population Employed in Farming, Fishing & Forestry in California is 1.4%.
What is the Percentage of Population Employed in Farming, Fishing & Forestry in the United States?
Percentage of Population Employed in Farming, Fishing & Forestry in the United States is 0.61%.