Zip Codes with the Highest Percentage of Population Employed in Firefighting & Prevention in Hesperia, CA
RELATED REPORTS & OPTIONS
Firefighting & Prevention
Hesperia
Compare Zip Codes
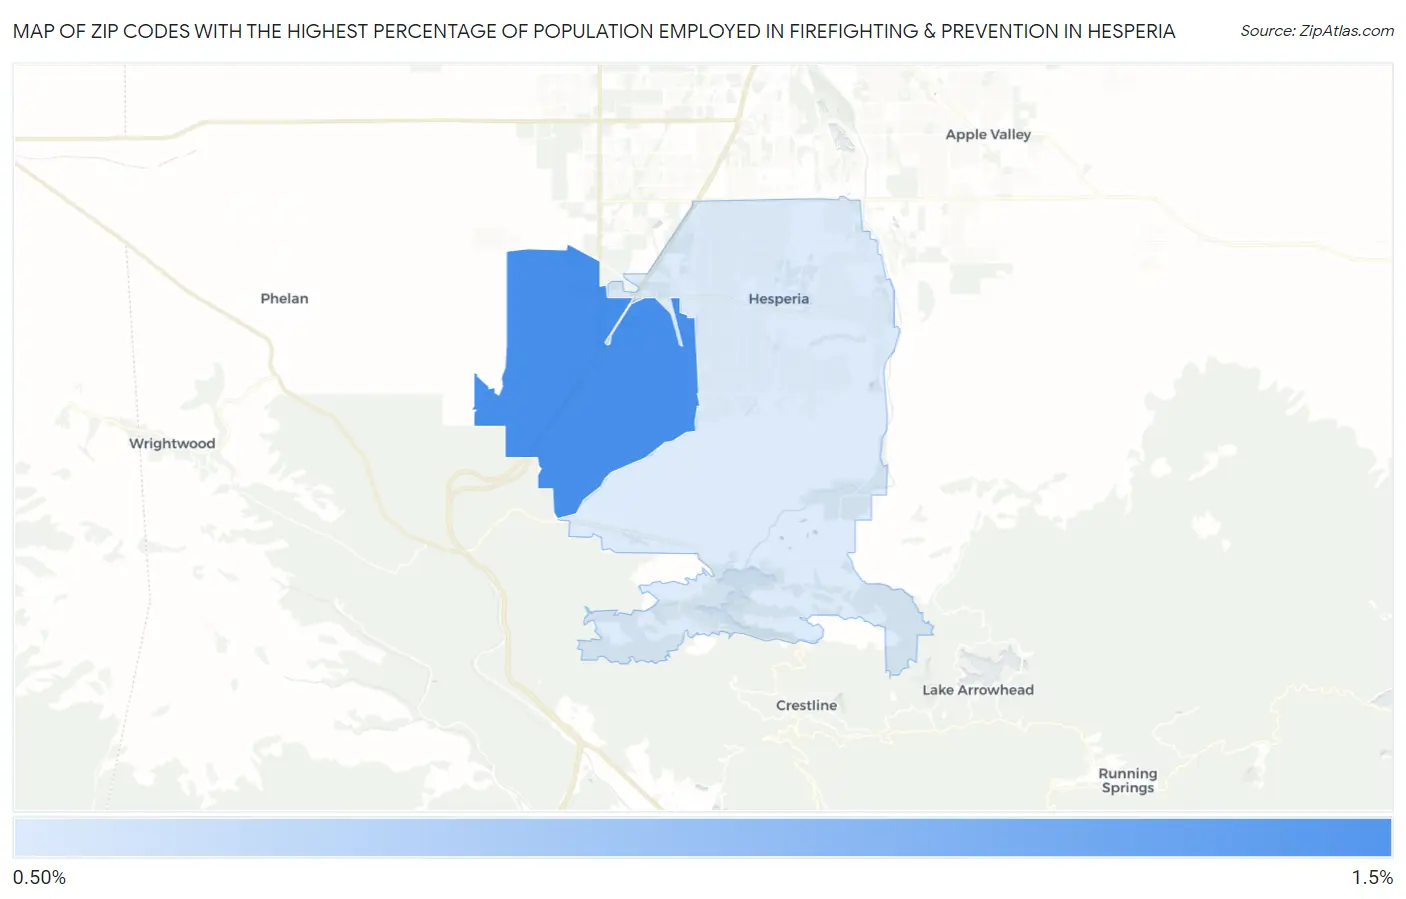
Map of Zip Codes with the Highest Percentage of Population Employed in Firefighting & Prevention in Hesperia
0.0%
1.5%
Zip Codes with the Highest Percentage of Population Employed in Firefighting & Prevention in Hesperia, CA
| Zip Code | % Employed | vs State | vs National | |
| 1. | 92344 | 1.1% | 1.3%(-0.130)#717 | 1.2%(-0.040)#9,663 |
| 2. | 92345 | 0.64% | 1.3%(-0.632)#1,086 | 1.2%(-0.542)#14,967 |
1
Common Questions
What are the Top Zip Codes with the Highest Percentage of Population Employed in Firefighting & Prevention in Hesperia, CA?
Top Zip Codes with the Highest Percentage of Population Employed in Firefighting & Prevention in Hesperia, CA are:
What zip code has the Highest Percentage of Population Employed in Firefighting & Prevention in Hesperia, CA?
92344 has the Highest Percentage of Population Employed in Firefighting & Prevention in Hesperia, CA with 1.1%.
What is the Percentage of Population Employed in Firefighting & Prevention in Hesperia, CA?
Percentage of Population Employed in Firefighting & Prevention in Hesperia is 0.58%.
What is the Percentage of Population Employed in Firefighting & Prevention in California?
Percentage of Population Employed in Firefighting & Prevention in California is 1.3%.
What is the Percentage of Population Employed in Firefighting & Prevention in the United States?
Percentage of Population Employed in Firefighting & Prevention in the United States is 1.2%.