Zip Codes with the Highest Percentage of Population Employed in Community & Social Service in Hesperia, CA
RELATED REPORTS & OPTIONS
Community & Social Service
Hesperia
Compare Zip Codes
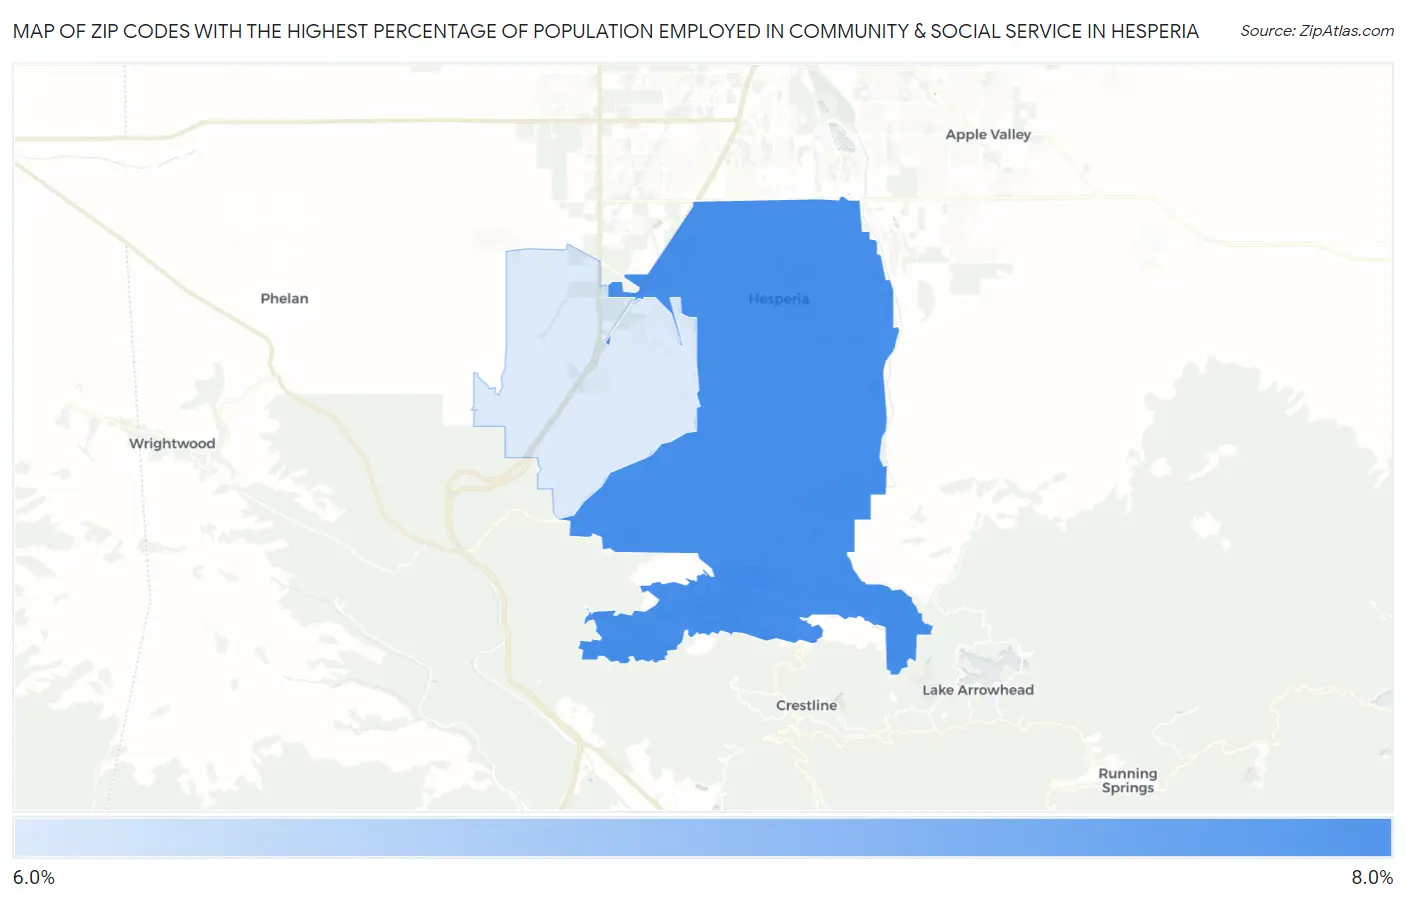
Map of Zip Codes with the Highest Percentage of Population Employed in Community & Social Service in Hesperia
0.0%
8.0%
Zip Codes with the Highest Percentage of Population Employed in Community & Social Service in Hesperia, CA
| Zip Code | % Employed | vs State | vs National | |
| 1. | 92345 | 7.6% | 11.5%(-3.84)#1,206 | 11.2%(-3.57)#20,514 |
| 2. | 92344 | 6.7% | 11.5%(-4.76)#1,328 | 11.2%(-4.49)#22,764 |
1
Common Questions
What are the Top Zip Codes with the Highest Percentage of Population Employed in Community & Social Service in Hesperia, CA?
Top Zip Codes with the Highest Percentage of Population Employed in Community & Social Service in Hesperia, CA are:
What zip code has the Highest Percentage of Population Employed in Community & Social Service in Hesperia, CA?
92345 has the Highest Percentage of Population Employed in Community & Social Service in Hesperia, CA with 7.6%.
What is the Percentage of Population Employed in Community & Social Service in Hesperia, CA?
Percentage of Population Employed in Community & Social Service in Hesperia is 7.5%.
What is the Percentage of Population Employed in Community & Social Service in California?
Percentage of Population Employed in Community & Social Service in California is 11.5%.
What is the Percentage of Population Employed in Community & Social Service in the United States?
Percentage of Population Employed in Community & Social Service in the United States is 11.2%.