Zip Codes with the Highest Percentage of Population Employed in Office & Administration in Hesperia, CA
RELATED REPORTS & OPTIONS
Office & Administration
Hesperia
Compare Zip Codes
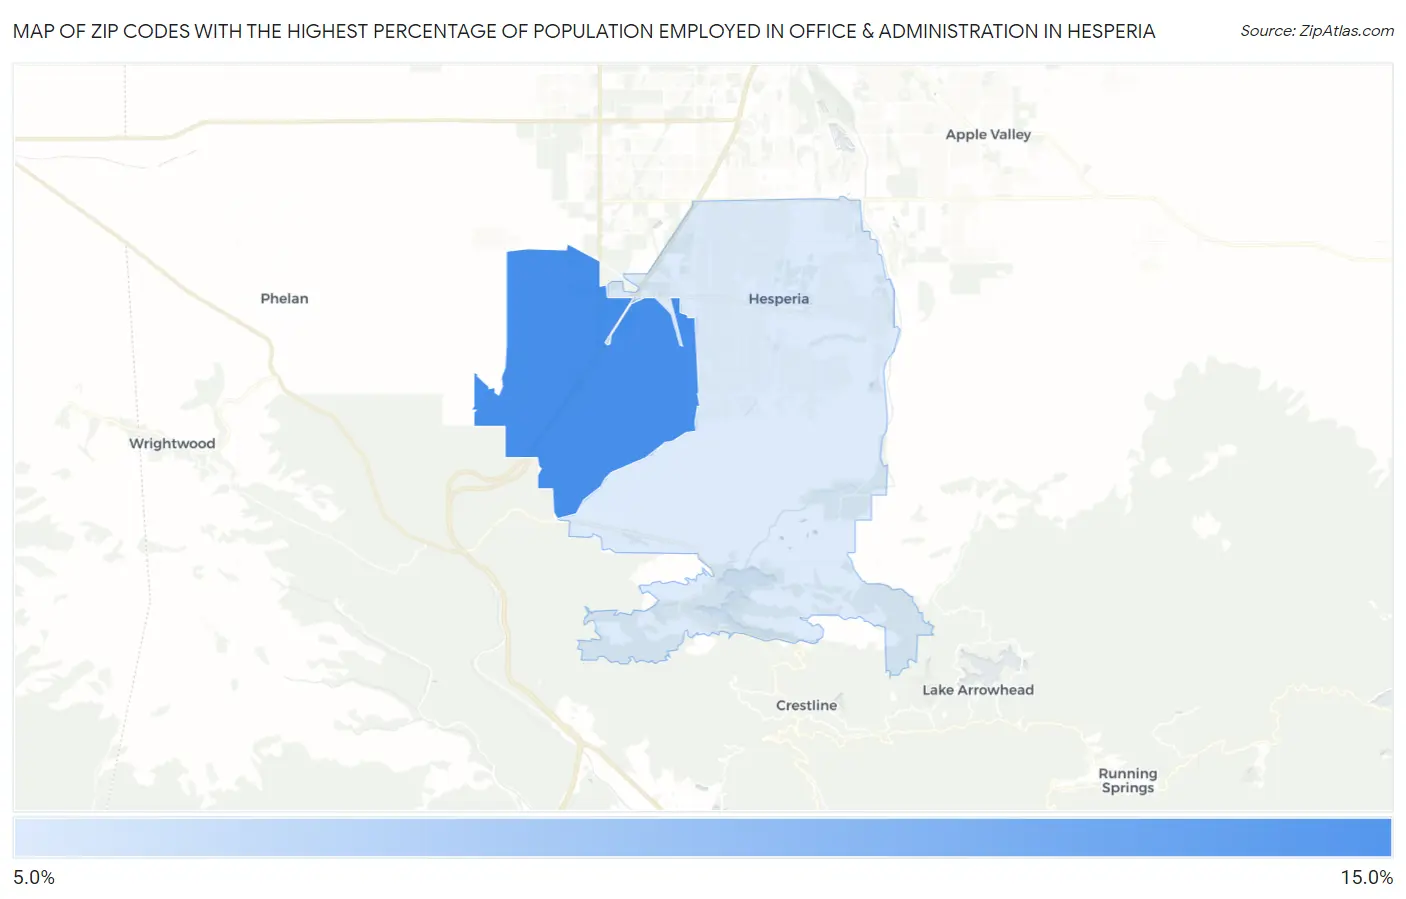
Map of Zip Codes with the Highest Percentage of Population Employed in Office & Administration in Hesperia
0.0%
15.0%
Zip Codes with the Highest Percentage of Population Employed in Office & Administration in Hesperia, CA
| Zip Code | % Employed | vs State | vs National | |
| 1. | 92344 | 11.7% | 10.5%(+1.15)#534 | 10.9%(+0.800)#11,772 |
| 2. | 92345 | 9.3% | 10.5%(-1.17)#967 | 10.9%(-1.52)#19,279 |
1
Common Questions
What are the Top Zip Codes with the Highest Percentage of Population Employed in Office & Administration in Hesperia, CA?
Top Zip Codes with the Highest Percentage of Population Employed in Office & Administration in Hesperia, CA are:
What zip code has the Highest Percentage of Population Employed in Office & Administration in Hesperia, CA?
92344 has the Highest Percentage of Population Employed in Office & Administration in Hesperia, CA with 11.7%.
What is the Percentage of Population Employed in Office & Administration in Hesperia, CA?
Percentage of Population Employed in Office & Administration in Hesperia is 9.9%.
What is the Percentage of Population Employed in Office & Administration in California?
Percentage of Population Employed in Office & Administration in California is 10.5%.
What is the Percentage of Population Employed in Office & Administration in the United States?
Percentage of Population Employed in Office & Administration in the United States is 10.9%.