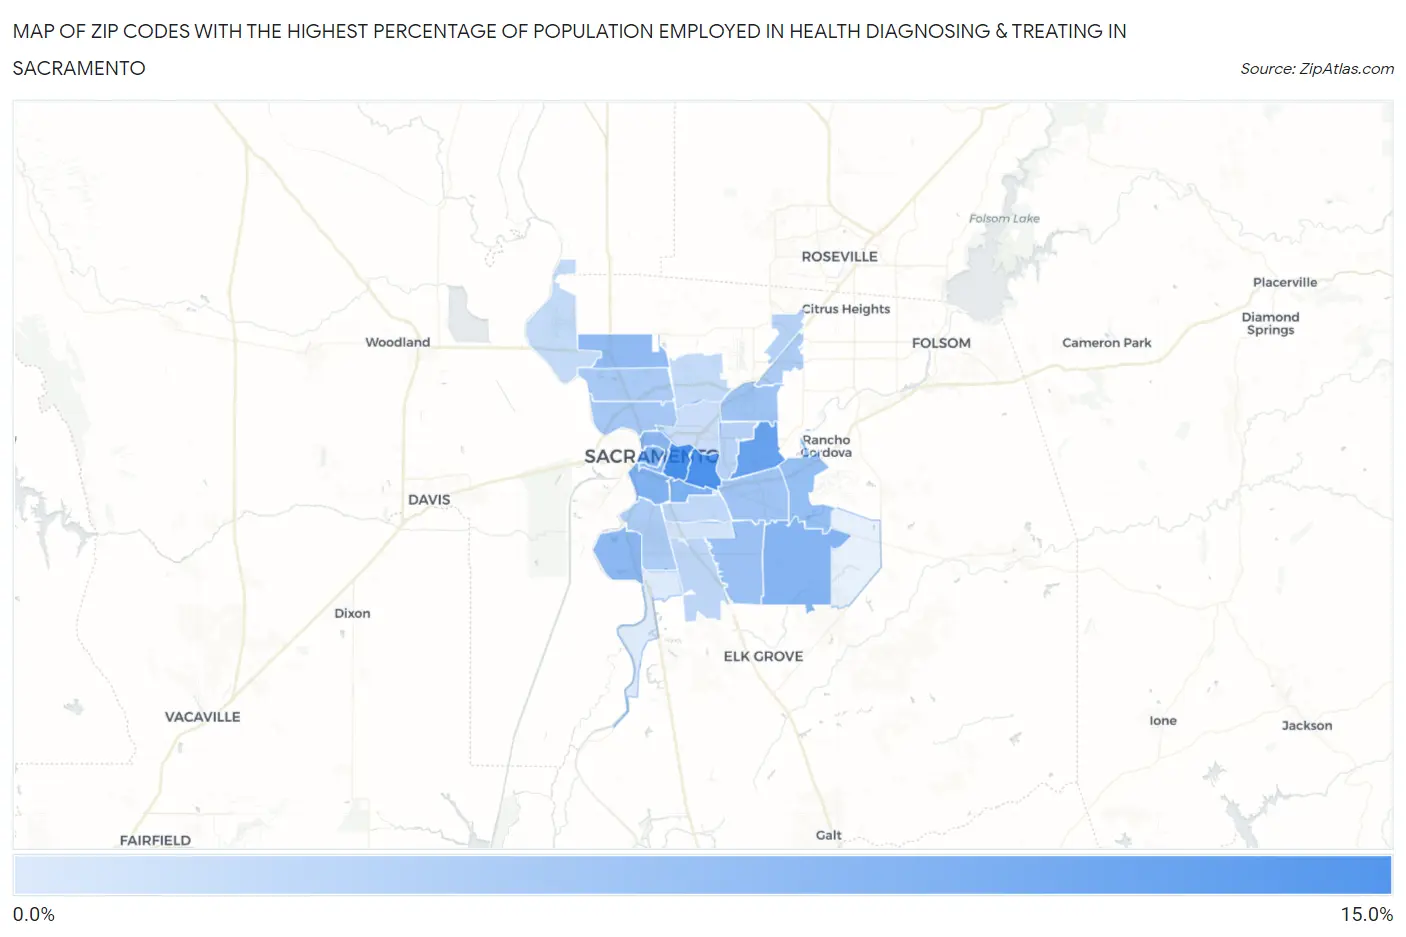
Zip Codes with the Highest Percentage of Population Employed in Health Diagnosing & Treating in Sacramento, CA
RELATED REPORTS & OPTIONS
Health Diagnosing & Treating
Sacramento
Compare Zip Codes
Map of Zip Codes with the Highest Percentage of Population Employed in Health Diagnosing & Treating in Sacramento
0.0%
15.0%
Zip Codes with the Highest Percentage of Population Employed in Health Diagnosing & Treating in Sacramento, CA
| Zip Code | % Employed | vs State | vs National | |
| 1. | 95816 | 10.9% | 5.3%(+5.58)#91 | 6.2%(+4.65)#2,969 |
| 2. | 95819 | 10.6% | 5.3%(+5.26)#101 | 6.2%(+4.32)#3,252 |
| 3. | 95864 | 8.9% | 5.3%(+3.56)#180 | 6.2%(+2.63)#5,576 |
| 4. | 95814 | 7.7% | 5.3%(+2.37)#278 | 6.2%(+1.43)#8,303 |
| 5. | 95817 | 7.5% | 5.3%(+2.15)#315 | 6.2%(+1.22)#8,921 |
| 6. | 95818 | 7.3% | 5.3%(+1.96)#346 | 6.2%(+1.03)#9,490 |
| 7. | 95829 | 7.1% | 5.3%(+1.78)#366 | 6.2%(+0.843)#10,086 |
| 8. | 95811 | 6.7% | 5.3%(+1.41)#430 | 6.2%(+0.475)#11,261 |
| 9. | 95831 | 6.6% | 5.3%(+1.30)#448 | 6.2%(+0.364)#11,624 |
| 10. | 95835 | 6.3% | 5.3%(+0.946)#515 | 6.2%(+0.012)#12,909 |
| 11. | 95827 | 6.0% | 5.3%(+0.726)#559 | 6.2%(-0.208)#13,744 |
| 12. | 95828 | 5.7% | 5.3%(+0.393)#629 | 6.2%(-0.540)#14,980 |
| 13. | 95821 | 5.5% | 5.3%(+0.202)#676 | 6.2%(-0.732)#15,730 |
| 14. | 95826 | 5.3% | 5.3%(+0.039)#707 | 6.2%(-0.895)#16,364 |
| 15. | 95833 | 5.0% | 5.3%(-0.292)#785 | 6.2%(-1.23)#17,621 |
| 16. | 95834 | 4.7% | 5.3%(-0.584)#845 | 6.2%(-1.52)#18,765 |
| 17. | 95841 | 4.7% | 5.3%(-0.631)#850 | 6.2%(-1.56)#18,926 |
| 18. | 95822 | 4.6% | 5.3%(-0.684)#869 | 6.2%(-1.62)#19,149 |
| 19. | 95842 | 4.2% | 5.3%(-1.14)#971 | 6.2%(-2.07)#20,806 |
| 20. | 95825 | 4.0% | 5.3%(-1.30)#1,012 | 6.2%(-2.23)#21,331 |
| 21. | 95823 | 3.7% | 5.3%(-1.57)#1,061 | 6.2%(-2.50)#22,163 |
| 22. | 95820 | 3.6% | 5.3%(-1.74)#1,101 | 6.2%(-2.67)#22,695 |
| 23. | 95838 | 3.3% | 5.3%(-2.00)#1,142 | 6.2%(-2.94)#23,452 |
| 24. | 95837 | 3.3% | 5.3%(-2.04)#1,147 | 6.2%(-2.98)#23,579 |
| 25. | 95815 | 2.8% | 5.3%(-2.46)#1,226 | 6.2%(-3.40)#24,711 |
| 26. | 95824 | 2.4% | 5.3%(-2.89)#1,291 | 6.2%(-3.82)#25,692 |
| 27. | 95832 | 1.8% | 5.3%(-3.51)#1,378 | 6.2%(-4.44)#26,792 |
1
Common Questions
What are the Top 10 Zip Codes with the Highest Percentage of Population Employed in Health Diagnosing & Treating in Sacramento, CA?
Top 10 Zip Codes with the Highest Percentage of Population Employed in Health Diagnosing & Treating in Sacramento, CA are:
What zip code has the Highest Percentage of Population Employed in Health Diagnosing & Treating in Sacramento, CA?
95816 has the Highest Percentage of Population Employed in Health Diagnosing & Treating in Sacramento, CA with 10.9%.
What is the Percentage of Population Employed in Health Diagnosing & Treating in Sacramento, CA?
Percentage of Population Employed in Health Diagnosing & Treating in Sacramento is 5.5%.
What is the Percentage of Population Employed in Health Diagnosing & Treating in California?
Percentage of Population Employed in Health Diagnosing & Treating in California is 5.3%.
What is the Percentage of Population Employed in Health Diagnosing & Treating in the United States?
Percentage of Population Employed in Health Diagnosing & Treating in the United States is 6.2%.