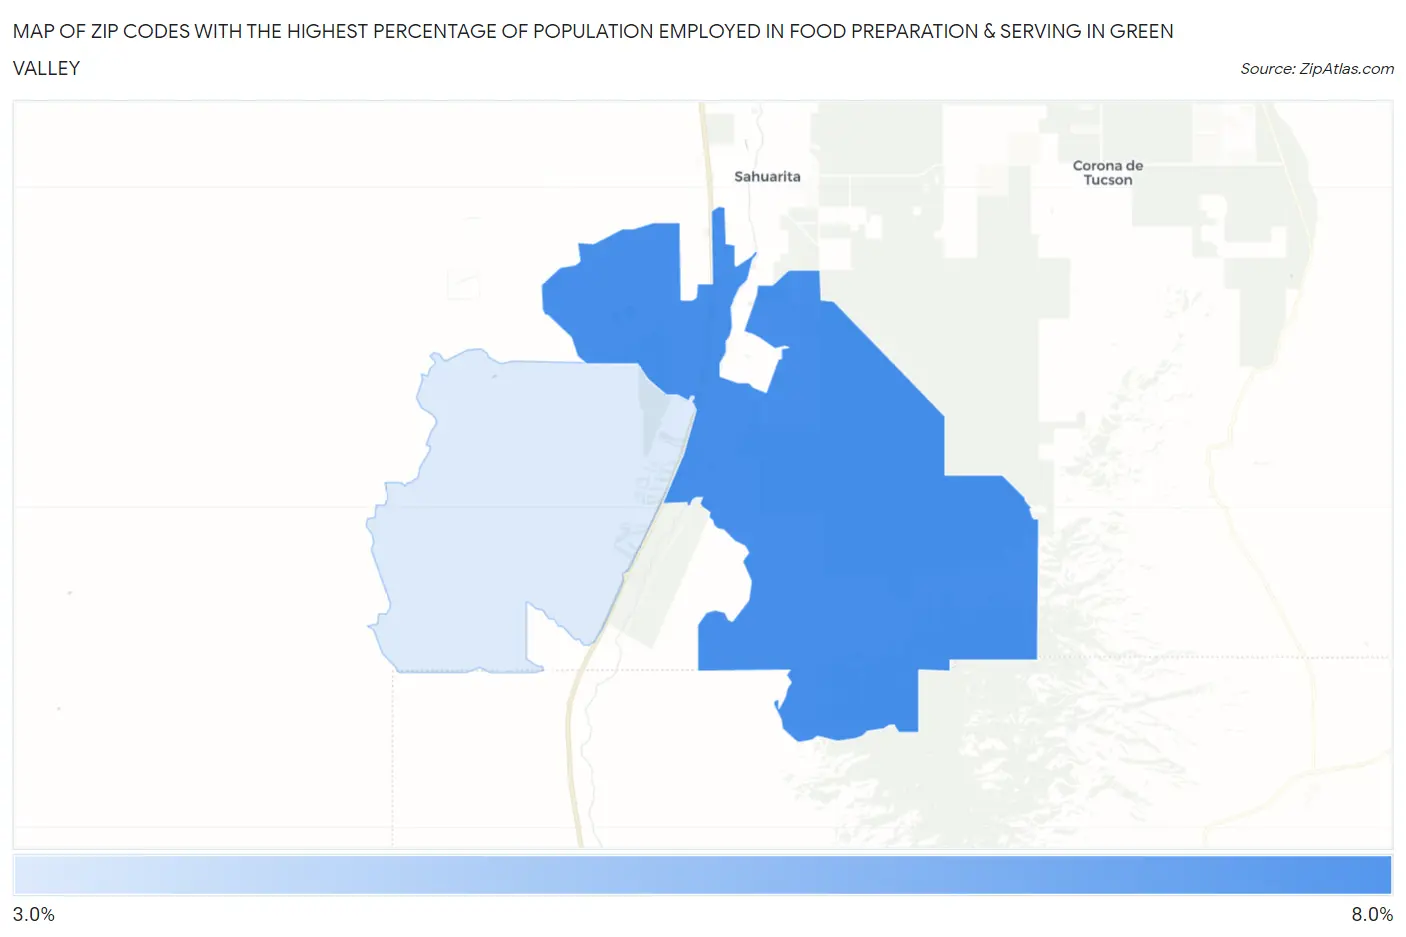
Zip Codes with the Highest Percentage of Population Employed in Food Preparation & Serving in Green Valley, AZ
RELATED REPORTS & OPTIONS
Food Preparation & Serving
Green Valley
Compare Zip Codes
Map of Zip Codes with the Highest Percentage of Population Employed in Food Preparation & Serving in Green Valley
0.0%
8.0%
Zip Codes with the Highest Percentage of Population Employed in Food Preparation & Serving in Green Valley, AZ
| Zip Code | % Employed | vs State | vs National | |
| 1. | 85614 | 7.5% | 5.7%(+1.80)#89 | 5.3%(+2.18)#5,627 |
| 2. | 85622 | 3.7% | 5.7%(-1.99)#258 | 5.3%(-1.60)#18,434 |
1
Common Questions
What are the Top Zip Codes with the Highest Percentage of Population Employed in Food Preparation & Serving in Green Valley, AZ?
Top Zip Codes with the Highest Percentage of Population Employed in Food Preparation & Serving in Green Valley, AZ are:
What zip code has the Highest Percentage of Population Employed in Food Preparation & Serving in Green Valley, AZ?
85614 has the Highest Percentage of Population Employed in Food Preparation & Serving in Green Valley, AZ with 7.5%.
What is the Percentage of Population Employed in Food Preparation & Serving in Green Valley, AZ?
Percentage of Population Employed in Food Preparation & Serving in Green Valley is 2.9%.
What is the Percentage of Population Employed in Food Preparation & Serving in Arizona?
Percentage of Population Employed in Food Preparation & Serving in Arizona is 5.7%.
What is the Percentage of Population Employed in Food Preparation & Serving in the United States?
Percentage of Population Employed in Food Preparation & Serving in the United States is 5.3%.