Zip Codes with the Lowest Percentage of Renter-Occupied Units in Green Valley, AZ
RELATED REPORTS & OPTIONS
Lowest Renter-Occupied
Green Valley
Compare Zip Codes
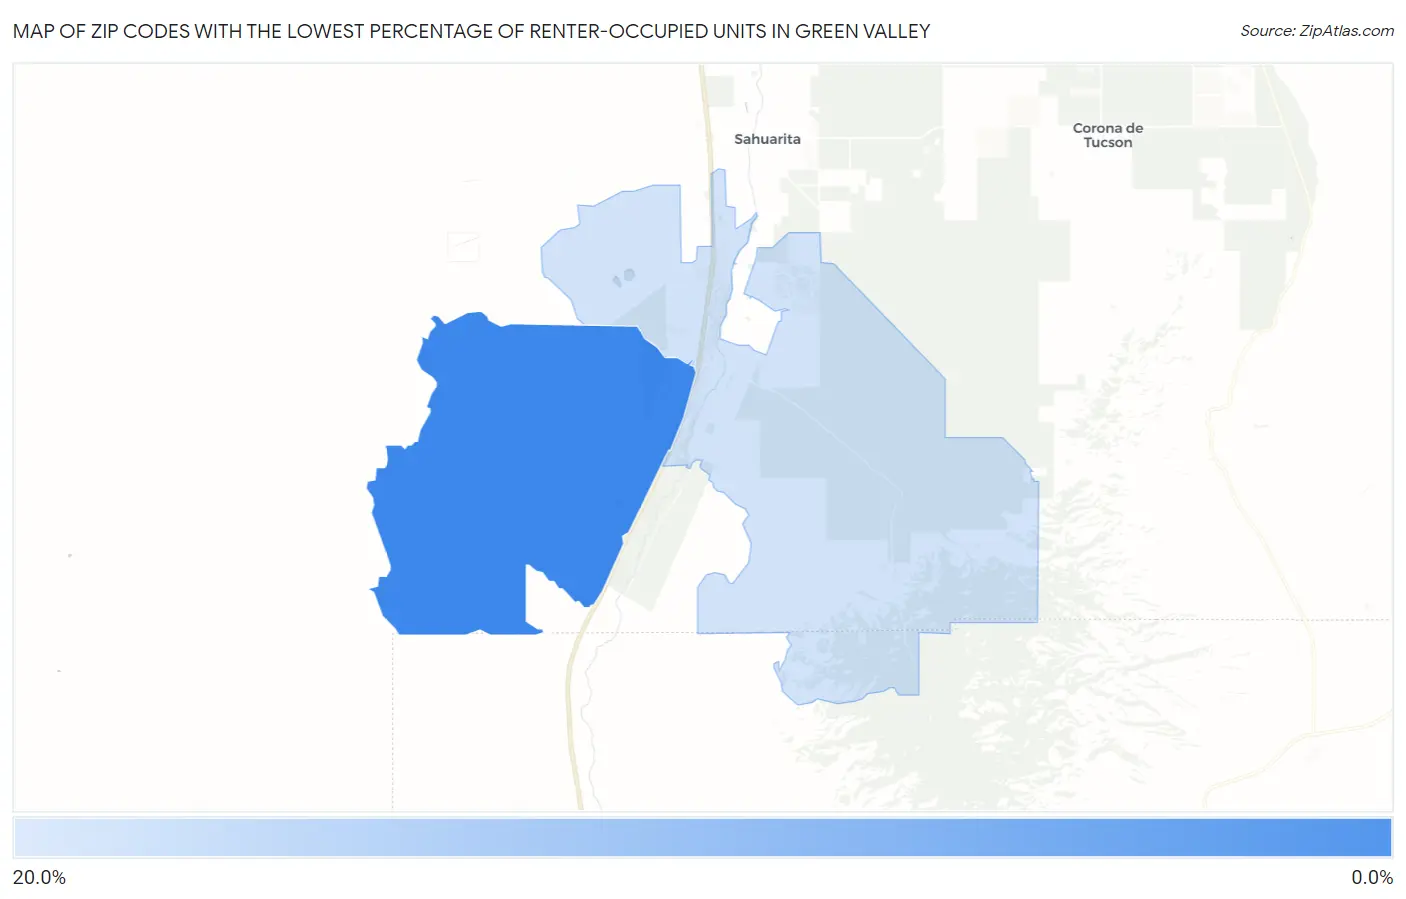
Map of Zip Codes with the Lowest Percentage of Renter-Occupied Units in Green Valley
20.0%
0.0%
Zip Codes with the Lowest Percentage of Renter-Occupied Units in Green Valley, AZ
| Zip Code | % Renter-Occupied | vs State | vs National | |
| 1. | 85622 | 9.8% | 33.7%(-23.9)#42 | 35.2%(-25.3)#3,681 |
| 2. | 85614 | 17.3% | 33.7%(-16.4)#111 | 35.2%(-17.8)#10,288 |
1
Common Questions
What are the Top Zip Codes with the Lowest Percentage of Renter-Occupied Units in Green Valley, AZ?
Top Zip Codes with the Lowest Percentage of Renter-Occupied Units in Green Valley, AZ are:
What zip code has the Lowest Percentage of Renter-Occupied Units in Green Valley, AZ?
85622 has the Lowest Percentage of Renter-Occupied Units in Green Valley, AZ with 9.8%.
What is the Percentage of Renter-Occupied Units in Green Valley, AZ?
Percentage of Renter-Occupied Units in Green Valley is 13.8%.
What is the Percentage of Renter-Occupied Units in Arizona?
Percentage of Renter-Occupied Units in Arizona is 33.7%.
What is the Percentage of Renter-Occupied Units in the United States?
Percentage of Renter-Occupied Units in the United States is 35.2%.