Zip Codes with the Highest Percentage of Population Employed in Farming, Fishing & Forestry in Green Valley, AZ
RELATED REPORTS & OPTIONS
Farming, Fishing & Forestry
Green Valley
Compare Zip Codes
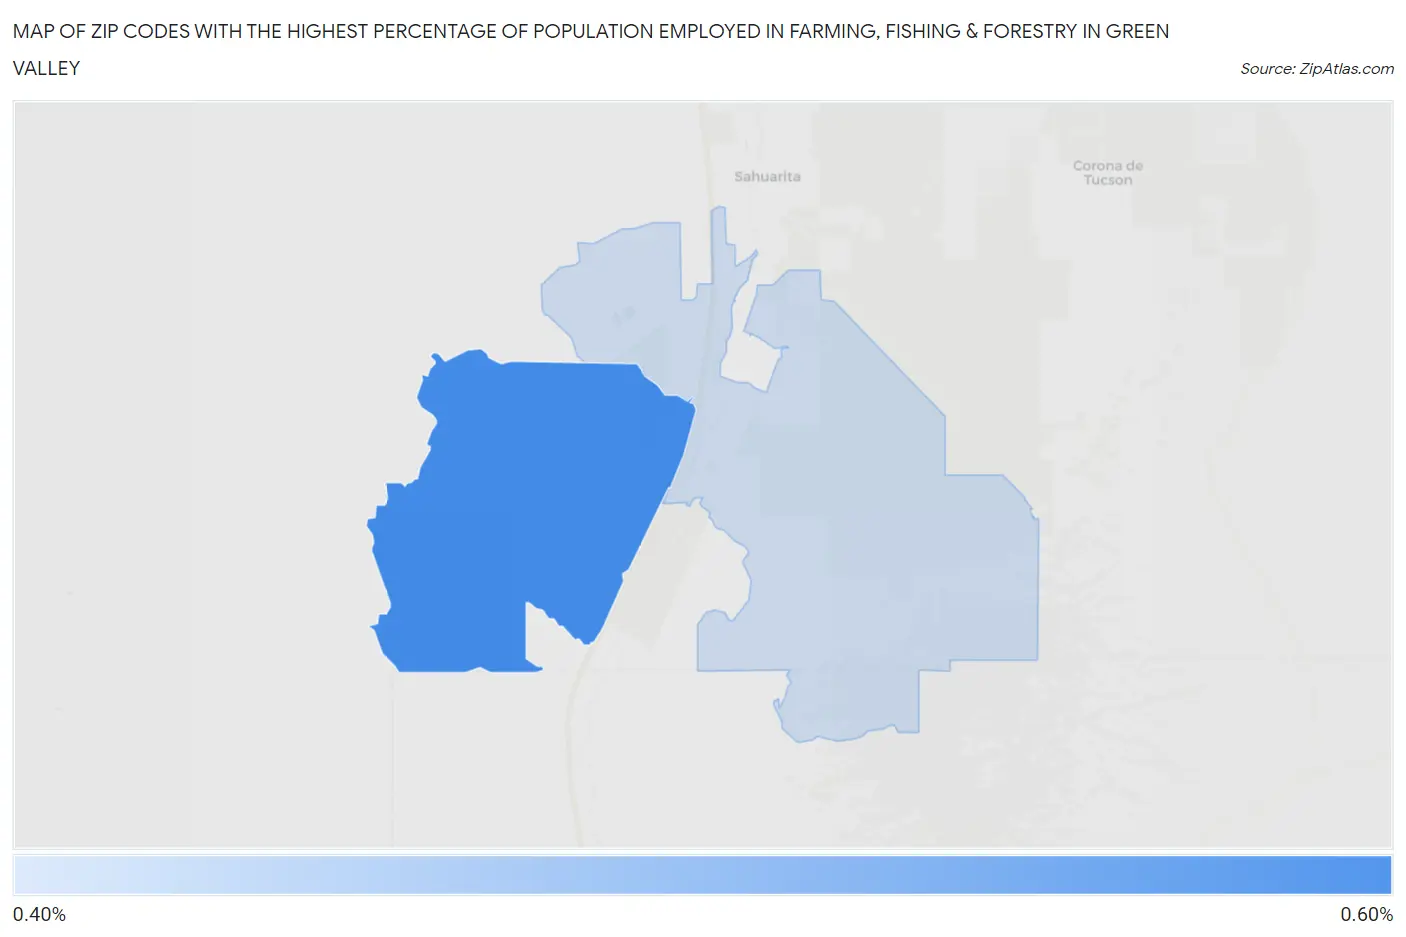
Map of Zip Codes with the Highest Percentage of Population Employed in Farming, Fishing & Forestry in Green Valley
0.0%
0.60%
Zip Codes with the Highest Percentage of Population Employed in Farming, Fishing & Forestry in Green Valley, AZ
| Zip Code | % Employed | vs State | vs National | |
| 1. | 85622 | 0.58% | 0.51%(+0.069)#100 | 0.61%(-0.030)#12,241 |
| 2. | 85614 | 0.41% | 0.51%(-0.098)#116 | 0.61%(-0.197)#13,677 |
1
Common Questions
What are the Top Zip Codes with the Highest Percentage of Population Employed in Farming, Fishing & Forestry in Green Valley, AZ?
Top Zip Codes with the Highest Percentage of Population Employed in Farming, Fishing & Forestry in Green Valley, AZ are:
What zip code has the Highest Percentage of Population Employed in Farming, Fishing & Forestry in Green Valley, AZ?
85622 has the Highest Percentage of Population Employed in Farming, Fishing & Forestry in Green Valley, AZ with 0.58%.
What is the Percentage of Population Employed in Farming, Fishing & Forestry in Green Valley, AZ?
Percentage of Population Employed in Farming, Fishing & Forestry in Green Valley is 0.67%.
What is the Percentage of Population Employed in Farming, Fishing & Forestry in Arizona?
Percentage of Population Employed in Farming, Fishing & Forestry in Arizona is 0.51%.
What is the Percentage of Population Employed in Farming, Fishing & Forestry in the United States?
Percentage of Population Employed in Farming, Fishing & Forestry in the United States is 0.61%.