Zip Codes with the Most Immigrants from Latin America in Green Valley, AZ
RELATED REPORTS & OPTIONS
Latin America
Green Valley
Compare Zip Codes
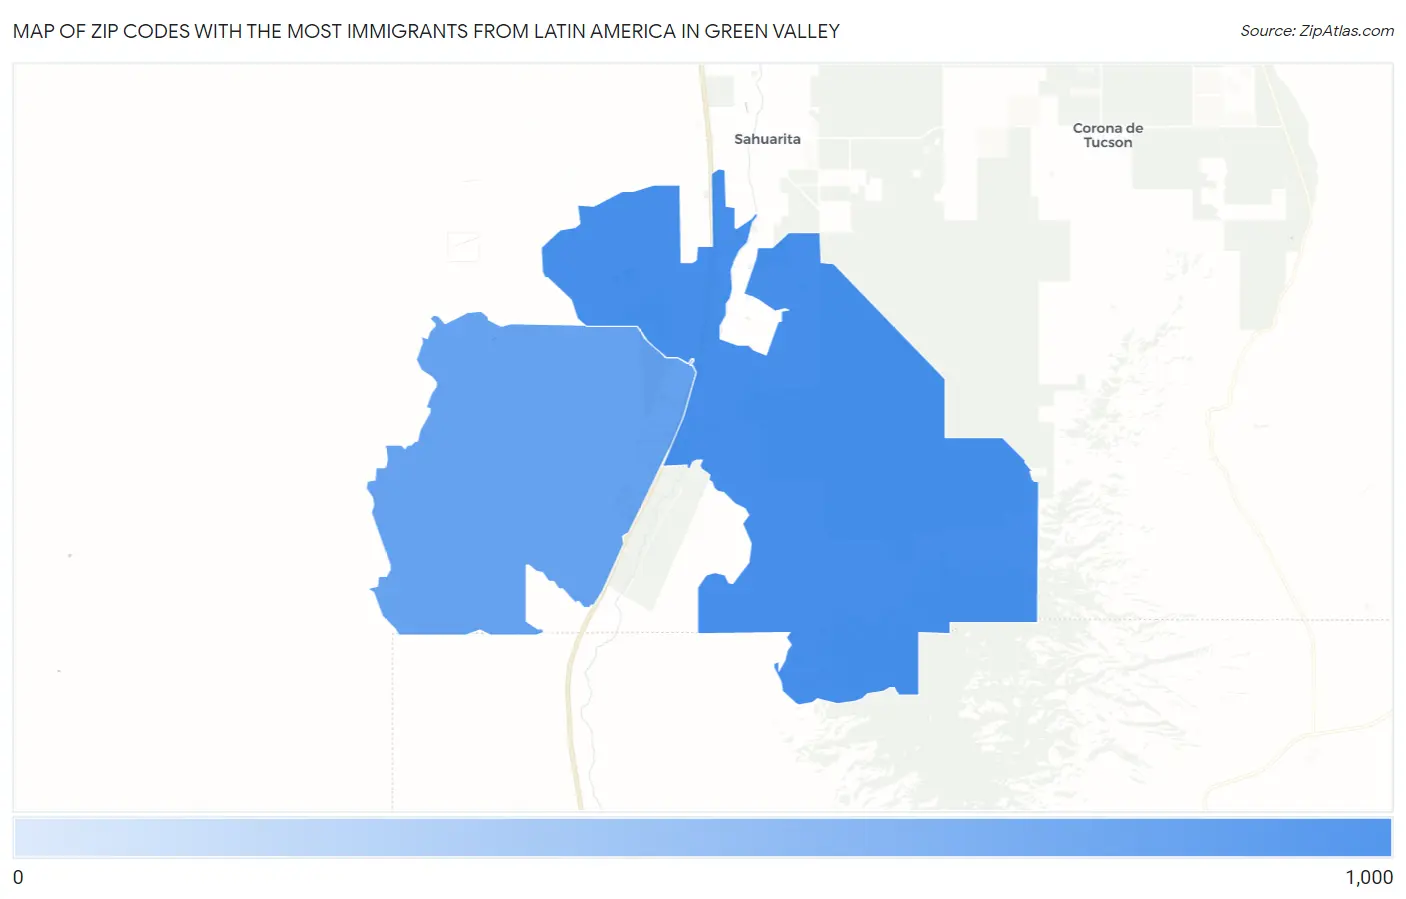
Map of Zip Codes with the Most Immigrants from Latin America in Green Valley
0
1,000
Zip Codes with the Most Immigrants from Latin America in Green Valley, AZ
| Zip Code | Latin America | vs State | vs National | |
| 1. | 85614 | 819 | 577,301(0.14%)#137 | 22,649,518(0.00%)#4,766 |
| 2. | 85622 | 218 | 577,301(0.04%)#216 | 22,649,518(0.00%)#8,745 |
1
Common Questions
What are the Top Zip Codes with the Most Immigrants from Latin America in Green Valley, AZ?
Top Zip Codes with the Most Immigrants from Latin America in Green Valley, AZ are:
What zip code has the Most Immigrants from Latin America in Green Valley, AZ?
85614 has the Most Immigrants from Latin America in Green Valley, AZ with 819.
What is the Total Immigrants from Latin America in Green Valley, AZ?
Total Immigrants from Latin America in Green Valley is 471.
What is the Total Immigrants from Latin America in Arizona?
Total Immigrants from Latin America in Arizona is 577,301.
What is the Total Immigrants from Latin America in the United States?
Total Immigrants from Latin America in the United States is 22,649,518.