Zip Codes with the Highest Percentage of Population Employed in Food Preparation & Serving in Marana, AZ
RELATED REPORTS & OPTIONS
Food Preparation & Serving
Marana
Compare Zip Codes
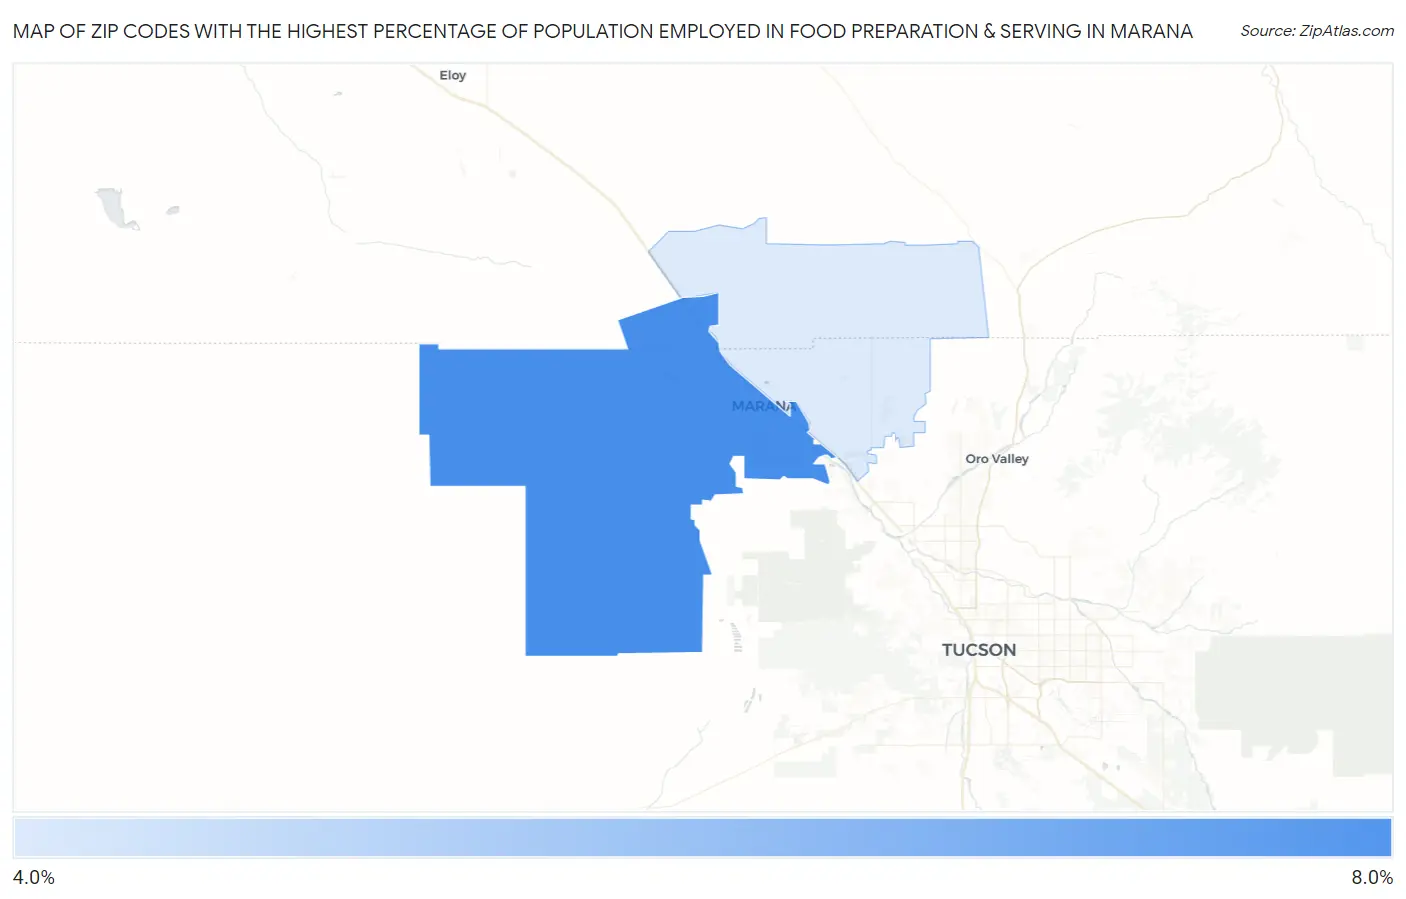
Map of Zip Codes with the Highest Percentage of Population Employed in Food Preparation & Serving in Marana
0.0%
8.0%
Zip Codes with the Highest Percentage of Population Employed in Food Preparation & Serving in Marana, AZ
| Zip Code | % Employed | vs State | vs National | |
| 1. | 85653 | 6.4% | 5.7%(+0.712)#130 | 5.3%(+1.09)#8,193 |
| 2. | 85658 | 4.7% | 5.7%(-0.934)#209 | 5.3%(-0.553)#14,024 |
1
Common Questions
What are the Top Zip Codes with the Highest Percentage of Population Employed in Food Preparation & Serving in Marana, AZ?
Top Zip Codes with the Highest Percentage of Population Employed in Food Preparation & Serving in Marana, AZ are:
What zip code has the Highest Percentage of Population Employed in Food Preparation & Serving in Marana, AZ?
85653 has the Highest Percentage of Population Employed in Food Preparation & Serving in Marana, AZ with 6.4%.
What is the Percentage of Population Employed in Food Preparation & Serving in Marana, AZ?
Percentage of Population Employed in Food Preparation & Serving in Marana is 4.2%.
What is the Percentage of Population Employed in Food Preparation & Serving in Arizona?
Percentage of Population Employed in Food Preparation & Serving in Arizona is 5.7%.
What is the Percentage of Population Employed in Food Preparation & Serving in the United States?
Percentage of Population Employed in Food Preparation & Serving in the United States is 5.3%.