Zip Codes with the Most Immigrants from Greece in Green Valley, AZ
RELATED REPORTS & OPTIONS
Greece
Green Valley
Compare Zip Codes
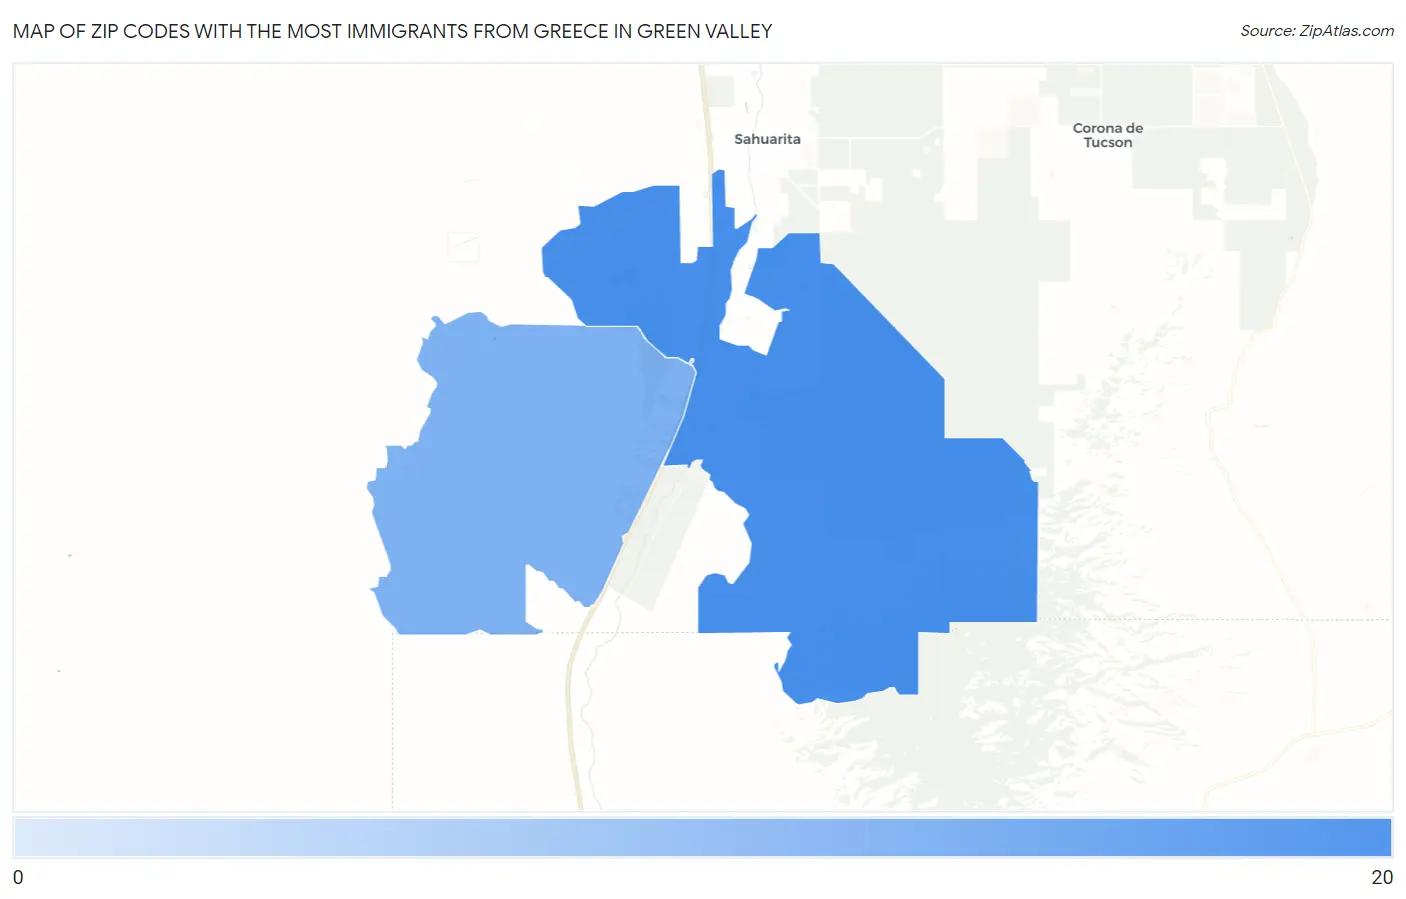
Map of Zip Codes with the Most Immigrants from Greece in Green Valley
0
20
Zip Codes with the Most Immigrants from Greece in Green Valley, AZ
| Zip Code | Greece | vs State | vs National | |
| 1. | 85614 | 16 | 1,080(1.48%)#19 | 118,932(0.01%)#1,797 |
| 2. | 85622 | 5 | 1,080(0.46%)#44 | 118,932(0.00%)#2,955 |
1
Common Questions
What are the Top Zip Codes with the Most Immigrants from Greece in Green Valley, AZ?
Top Zip Codes with the Most Immigrants from Greece in Green Valley, AZ are:
What zip code has the Most Immigrants from Greece in Green Valley, AZ?
85614 has the Most Immigrants from Greece in Green Valley, AZ with 16.
What is the Total Immigrants from Greece in Green Valley, AZ?
Total Immigrants from Greece in Green Valley is 16.
What is the Total Immigrants from Greece in Arizona?
Total Immigrants from Greece in Arizona is 1,080.
What is the Total Immigrants from Greece in the United States?
Total Immigrants from Greece in the United States is 118,932.